R E S E A R C H
Open Access
Extracting DNA words based on the
sequence features: non-uniform
distribution and integrity
Zhi Li
1, Hongyan Cao
1, Yuehua Cui
1,2*and Yanbo Zhang
1** Correspondence:[email protected];
1Department of Health Statistics,
School of Public Health, Shanxi Medical University, Taiyuan 030001, China
Full list of author information is available at the end of the article
Abstract
Background:DNA sequence can be viewed as an unknown language with words as its functional units. Given that most sequence alignment algorithms such as the motif discovery algorithms depend on the quality of background information about sequences, it is necessary to develop an ab initio algorithm for extracting the “words”based only on the DNA sequences.
Methods:We considered that non-uniform distribution and integrity were two important features of a word, based on which we developed an ab initio algorithm to extract“DNA words”that have potential functional meaning. A Kolmogorov-Smirnov test was used for consistency test of uniform distribution of DNA sequences, and the integrity was judged by the sequence and position alignment. Two random base sequences were adopted as negative control, and an English book was used as positive control to verify our algorithm. We applied our algorithm to the genomes of Saccharomyces cerevisiaeand 10 strains ofEscherichia colito show the utility of the methods.
Results:The results provide strong evidences that the algorithm is a promising tool for ab initio building a DNA dictionary.
Conclusions:Our method provides a fast way for large scale screening of important DNA elements and offers potential insights into the understanding of a genome.
Keywords:DNA words, DNA vocabulary, Integrity of word
Background
Like a sealed book, the genome contains all information in its sequences and extract-ing the words of the language is a key step to decrypt the secret of life. A lot of se-quence alignment algorithms, such as motif discovery algorithms [1, 2], were developed for this purpose. However these algorithms are limited in two ways: 1) their performances depend on the quality of available background information about the sequences, that is the extent of knowledge about biological function [1]; and 2) they can not analyze genomic regions with unknown functions. Therefore, it is necessary to develop an ab initio algorithm for extracting meaningful DNA words based only on DNA sequence itself.
Some ab initio methods have been developed in the literature, such as k-mer [3], relative entropy [4], and information content [5–8]. In these methods, the frequency
information of a word in a DNA sequence was used widely, but the position information was not paid enough attention. However, the position information, i.e., the distribution of a word in a DNA sequence, is very important to understand the function of the elements. A uniform distribution can be assumed when no information can be obtained from the distribution of a sequence [9]. Therefore, the basic hypothesis in this study is that the in-formation of a functional DNA element deviates from a uniform distribution. Based on this hypothesis, identifying patterns of DNA sequences that deviate from uniform distri-bution can provide a fast means for word detection and shed novel light on the function of a genome. In addition, the integrity is also an important feature of a word [10]. Integrity means that a word should be a complete unit which has a clear boundary. For example, the statistical characteristics (e.g., distribution or frequency) of“biology” and“iology”are almost the same in an English text. But the former is a word because it is a complete unit and has particular meaning. Currently, hardly any algorithm can distinguish them based purely on DNA sequences. Based on the two features, we can define a word as a complete symbol sequence not following the uniform distribution within a certain scope.
Carpena et al. [11] have shown the importance of the distribution in the identification of words. In their work, a clustering coefficient was used to denote the distribution of words. In addition, the semantic meanings of the words were used to explore the integ-rity. However, the semantic meanings are difficult to be applied for genome sequences due to the lack of a dictionary to define the genome content. Hackenberg et al. [12] also applied a clustering coefficient to denote the distribution of a base sequence within a one-dimensional DNA sequence context. Their results showed that the clustering of a DNA word was significantly associated with functional elements. However, no methods were provided to check the integrity, which may lead to false positives.
In this study, we developed an algorithm to extract meaningful DNA words based on these two features: non-uniformity and integrity. A Kolmogorov-Smirnov (KS) test was used for consistency test of uniform distribution, and the integrity of a word was checked by the sequence and position alignment among the symbol sequences. To ver-ify the algorithm, both negative and positive controls were considered. In principle, a random sequence following a uniform distribution should not carry any information, and nothing can be found according to this algorithm in principle. Thus, two random sequences were used to check the false positives. We also used an English book as a positive control to check if the algorithm can identify meaningful words without speci-fying any structures. Finally, we applied our method to the genomes ofSaccharomyces cerevisiae (Scere) and 10 strains of Escherichia coli (Ecoli). Results show that DNA words extracted from a DNA strand can carry specific information to reveal biological functions. The identified DNA words can be incorporated into a DNA vocabulary, based on which and in coupling with gene function information derived from Gene Ontology (GO) database, we can explore the relationships between these DNA words and gene functions via fast computational tools.
Methods Statistical tests
Consistency test of uniform distribution
function of a uniform distribution, Fn(x) is the empirical distribution function of the
sample, andDnquantifies a distance between them.
Dn¼max Fj n ð Þx −F xð Þj ð1Þ
For example, in the chromosome NC_009786.1 (79237 bp) shown in Section 4, the base T appears 20384 times, and its positions on this chromosome can be recorded as follows. (For avoiding unreasonable segmentation, the full length of every chromosome was analyzed.)
Based on these positions, aPvalue can be inferred by the KS test. The number of the positions, 20384, is the sample size. Similarly, the positions of an arbitrary repeated se-quence in a genome can be recorded, and whether or not it is evenly distributed in the genome can also be tested.
According to the basic hypothesis, the closer the distribution of a sample is to a uni-form distribution, the less the inuni-formation it carries and the smaller the Dn value is.
Considering the practical significance of the information, it was necessary to set a threshold for Dn. Our preliminary study [13] had shown that considering the
restric-tions of the sample size and the sampling error, the minimum Dn value can be set as
0.1, and the sample size should be larger than 100.
Judgement of integrity
Assume that the sets s1, s2, …, sn were the positions of the respective words w1,
w2, …, wn in the same chromosome. Here the positions of each word include all
the physical locations occupied by the word. Then, the integrity can be described as equation (2).
s1∩s2∩⋯∩sn¼∅ ð2Þ
The integrity means that the boundary of a word can be identified. For example, “bioinformation” is an English word, and its subsequence “ioinformatio” should not be identified because its boundary is wrong. But its subsequence “information” is a different English word and should be identified. Then how to filter the results like “ioinformatio”. In an English text, “ioinformatio” should appear at the posi-tions of “bioinformation”, therefore the positions of “ioinformatio” would be fil-tered after the positions of “bioinformation” are deleted. But “information” is different. On the one hand, it is a subsequence of “bioinformation”, therefore it can appear at the positions of “bioinformation”. On the other hand, it is also an English word, therefore it can appear at the positions not belonging to “bioinfor-mation”, too. In this algorithm, the total of two classes of positions are named as raw positions, and the second class are named as net positions. According to equation (2), the net positions of “information” should be tested whether or not they are evenly distributed.
NC_009786.1: T T C A G A T T A A …
The algorithm for extracting words
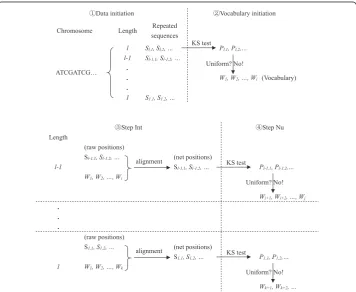
By combining the two criteria stated above, namely, non-uniformity and integrity, we developed an algorithm named Nu-Int (Non-uniform & Integrity) to extract meaning-ful DNA words from a DNA strand. As shown in Fig. 1, this algorithm includes five steps summarized as follows.
(1) Data initialization: All symbol sequences whose numbers of repetitions > 100 were extracted and classified by their lengths.
(2) Vocabulary initialization: In the beginning, the vocabulary of the DNA strand is null. Therefore, we do not need to check equation (2). The symbol sequences in the class with the longest length were tested separately by the KS test. The type I errorαwas adjusted according to the formula,α= 1–0.95^(1/n), wherenis the number of symbol sequences in this class. WhenP<αandDn> 0.1, it can be
considered that the symbol sequence did not follow the uniform distribution, and can be added in the vocabulary of the DNA strand.
(3) Step Int: The symbol sequences in the next class were compared with the
recognized words in the vocabulary. If a symbol sequence was the subsequence of a recognized word, the positions of this word should be deleted from the raw positions of this symbol sequence.
(4) Step Nu: The net positions of this symbol sequence were tested by the KS test. The symbol sequences not meeting the requirements (i.e., numbers of repetitions > 100,
P<αandDn> 0.1) would be eliminated.
Fig. 1Illustration of extracting words.“Sl,1”represented the positions of the first repeated sequence of
lengthl, and“Pl,1”represented itsPvalue for KS test, and so on.“W1”represented the positions of the first
(5) Repeating step (3)-(4). The symbol sequences in the rest classes were analyzed in descending order of word lengths.
In this study, the sequence and position alignment among the symbol sequences was executed by Perl language, and the KS test was executed by R language [14].
Algorithm verification with control Negative control
In this study, two pseudo chromosomes (rand1 and rand2) were used to evaluated the denoising ability of this algorithm. They were made up of the random arrangements of bases with equal probability, and their length were 4,000 bp and 6,400,000 bp, respectively.
Positive control
Unlike natural language, there is not a reference vocabulary in the genome. Therefore we can not verify directly the result extracted from the genome. However, the comma-less texts from natural language is a good analogy [12]. It was relatively easy to identify whether or not the result extracted from the English text was a word. In this study, an English book, the Holy Bible(King James), was adopted as a positive control. In this text, only 26 letters of the English alphabet were retained, and all uppercase let-ters were converted to lowercase. The number of remaining characlet-ters in this book was 3,317,198.
Algorithm verification with genomic comparison
Due to limited knowledge, we could not distinguish the meanings of the extracted DNA words directly. But the DNA words from different genomes can be used to show the difference among the genomes. In this study, we downloaded ten strains of Ecoli genomes from the NCBI website [GenBank: NC_000913.2, NC_007779.1, NC_010473.1, NC_009801.1, NC_009786.1, NC_009787.1, NC_009788.1, NC_009789.1, NC_009790.1, NC_009791.1, NC_011353.1, NC_011350.1, NC_011351.1, NC_011415.1, NC_011407.1, NC_011408.1, NC_011411.1, NC_011413.1, NC_011416.1, NC_011419.1, NC_011741.1, NC_012967.1, NC_012971.2, NC_016902.1, NC_016903.1, NC_016904.1] and Scere genome [GenBank: NC_001133.9, NC_001134.8, NC_001135.5, NC_001136.10, NC_001137.3, NC_001138.5, NC_001139.9, NC_001140.6, NC_001141.2, NC_001142.9, NC_001143.9, NC_001144.5, NC_001145.3, NC_001146.8, NC_001147.6, NC_001148.4, NC_001224.1]. The download links were given in Additional file 1. The sequences of the chromosomes were collected from the .fna files. Each chromosome was numbered, and the numbers were given in Additional file 2. The lengths of these chromosomes were listed in Table 1 and were sorted in ascending order.
Associations between DNA words and gene functions
All DNA words extracted from these genomes were incorporated into a DNA vocabu-lary. Gene sequences were extracted from .fna files according to the corresponding sites provided by .gbk files, and the word frequency of each DNA word in a gene can be counted. Gene annotations from the GO were adopted for this study, and the categor-ies of gene functions can be collected. The download links of the Ontology files and the gene annotations of Ecoli and Scere were given in Additional file 1. Based on these data, a logistic regression was used to investigate the relationships between the categor-ies of gene functions and the DNA words.
Grading GO terms according to Ontology file
For enriching the genes annotated by similar functions, it is necessary to grade GO terms. The relationship among GO terms is a directed acyclic graph. All GO terms are divided into three categories (molecular function, biological process, and cellular com-ponent), and each category has a root node. The terms (IDs of functions) in the mo-lecular function category were adopted in this study.
These terms were graded according to the GO hierarchy. The level–1 terms should be the direct child node of the root node and the level–2 terms were the direct child node of the level–1 terms, and so on. For enriching all annotated genes of a term, a gene annotated by its child terms should be enriched, therefore its all child term, in-cluding direct and indirect ones, should be recorded.
Grouping genes according to gene annotations
To get gene annotations, the function entries were extracted from the annotation files, and the entries with evidence code IEA were deleted. The genes appeared in these entries were associated with the genes in .gbk files, and the genes with
Table 1List of chromosomes and their lengths
Chromosome Length(bp) Chromosome Length(bp) Chromosome Length(bp)
Ecoli06_pla3.fnaa 4082 Ecoli06_pla6.fna 100021 Scere07.fna 1090940
Ecoli04_pla6.fna 5033 Ecoli10_pla2.fna 103795 Scere15.fna 1091291
Ecoli10_pla1.fna 5360 Scere01.fna 230218 Scere04.fna 1531933
Ecoli06_pla2.fna 5366 Scere06.fna 270161 Ecoli09.fna 4558953
Ecoli04_pla4.fna 6199 Scere03.fna 316620 Ecoli08.fna 4629812
Ecoli06_pla1.fna 6929 Scere09.fna 439888 Ecoli01.fna 4639675
Ecoli04_pla2.fna 34367 Scere08.fna 562643 Ecoli02.fna 4646332
Ecoli05_pla2.fna 37452 Scere05.fna 576874 Ecoli03.fna 4686137
Ecoli06_pla5.fna 60555 Scere11.fna 666816 Ecoli07.fna 4700560
Ecoli04_pla3.fna 70609 Scere10.fna 745751 Ecoli06.fna 4887515
Ecoli04_pla5.fna 74224 Scere14.fna 784333 Ecoli10.fna 4920168
Ecoli04_pla1.fna 79237 Scere02.fna 813184 Ecoli04.fna 4979619
Scere_mit.fna 85779 Scere13.fna 924431 Ecoli05.fna 5572075
Ecoli06_pla4.fna 91158 Scere16.fna 948066
Ecoli05_pla1.fna 94644 Scere12.fna 1078177
a
conflict identifications (37 genes from Ecoli, and 20 genes from Scere) were deleted.
Because the definitions of functions are not exclusive in Geng Ontology, a gene can be associated with several functions that belong to the same level in the directed acyclic graph. For each function, all annotated genes can be divided into three groups: exclu-sive, control and share. The exclusive group includes genes only annotated by the func-tion; the control group includes genes not annotated by the funcfunc-tion; the share group includes genes annotated simultaneously by other functions in the same level. The number of annotated genes of each group was recorded.
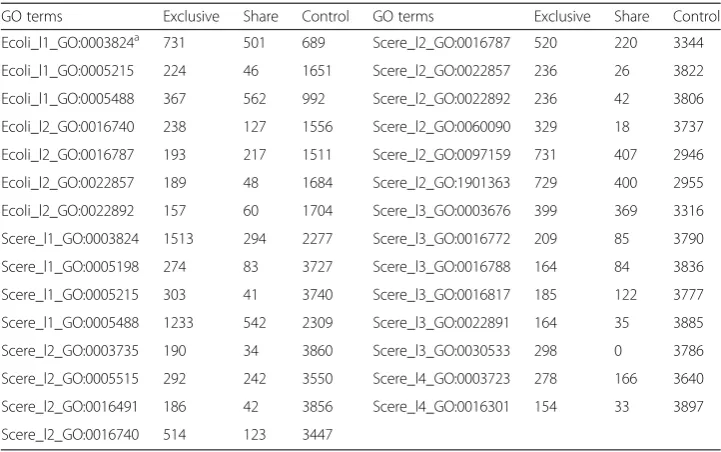
To facilitate the calculation, the functions whose numbers of annotated genes > 150 in the exclusive group and the control group were selected. Twenty nine GO terms sat-isfying the requirements were listed in Table 2.
Establishing the fitting models
The gene sequences were collected from the genomes based on their positions in .gbk files. One gene can appear on more than one chromosome, and its sequence might vary on different chromosomes. The word frequency of each DNA word was counted based on these gene sequences. Because the words of the DNA vocabulary varied in length, a short word can be the subsequence of a long word. In this case, the word frequency of this long word must be deleted from the word frequency of this short word. If the se-quences of a gene varied, the average frequency was calculated, and the word frequency was divided by the number of sequences.
Based on the words frequency and genes in the exclusive group and the control group, the logistic regression was applied to investigate the relationships between the functions and the words. Two models, with or without interaction (equation 3 and 4), were adopted for each function. In the models, Yi was the value of the ith gene
Table 2Groups of annotated genes by GO terms
GO terms Exclusive Share Control GO terms Exclusive Share Control
Ecoli_l1_GO:0003824a 731 501 689 Scere_l2_GO:0016787 520 220 3344
Ecoli_l1_GO:0005215 224 46 1651 Scere_l2_GO:0022857 236 26 3822
Ecoli_l1_GO:0005488 367 562 992 Scere_l2_GO:0022892 236 42 3806
Ecoli_l2_GO:0016740 238 127 1556 Scere_l2_GO:0060090 329 18 3737
Ecoli_l2_GO:0016787 193 217 1511 Scere_l2_GO:0097159 731 407 2946
Ecoli_l2_GO:0022857 189 48 1684 Scere_l2_GO:1901363 729 400 2955
Ecoli_l2_GO:0022892 157 60 1704 Scere_l3_GO:0003676 399 369 3316
Scere_l1_GO:0003824 1513 294 2277 Scere_l3_GO:0016772 209 85 3790
Scere_l1_GO:0005198 274 83 3727 Scere_l3_GO:0016788 164 84 3836
Scere_l1_GO:0005215 303 41 3740 Scere_l3_GO:0016817 185 122 3777
Scere_l1_GO:0005488 1233 542 2309 Scere_l3_GO:0022891 164 35 3885
Scere_l2_GO:0003735 190 34 3860 Scere_l3_GO:0030533 298 0 3786
Scere_l2_GO:0005515 292 242 3550 Scere_l4_GO:0003723 278 166 3640
Scere_l2_GO:0016491 186 42 3856 Scere_l4_GO:0016301 154 33 3897
Scere_l2_GO:0016740 514 123 3447
a“
associated with a function (1 for exclusive group, and 0 for control group), andfm,iwas
the word frequency of themth word in theith gene.
logit E Yð ½ ijFiÞ ¼βFi¼β0þβ1f1;iþ⋯þβmfm;i ð3Þ
logit E Yð ½ ijFiÞ ¼βFi¼β0þβ1f1;iþ⋯þβmfm;iþβmnfm;ifn;i ð4Þ
Because there were too many words in the vocabulary, a selection was necessary to simplify the analysis process. We considered two scenarios when performing the selection.
(1)Without interaction
Two selections were conducted. The first selection was done based on the word frequency. We definedfe as the word frequency in the exclusive group,fc
as the word frequency in the control group, and fd=fe- fc. The words were selected if fe> 0.6 and fd> 0.1. The selected words were used to fit the logistic regression model. Due to the huge difference in the sample size between the two groups for most of the terms, bootstrapping was applied to estimate the statistics. In the second selection,P value was adopted as selection criteria. The words withP< 0.2 were chosen. The final model without interaction was built with these words.
(2)With first-order interaction
The first selection was conducted as described above. If there were too many words selected from the first selection, there would be too many interaction terms in the model. Therefore, when the number of the words from the first selection was more than 50, the selection criteria offdwould raise until the number of selected words was less than 50. The second selection was executed the same as above.
Subsequently, all first-order interaction terms of those chosen words were added in the model. Every interaction term was the product of two word frequencies. For the third selection, the terms withP< 0.2 were chosen. The final model with first-order interaction was established based on these chosen terms.
Evaluating the fitting models by bootstrapping
Results
Algorithm verification with control
For pseudo chromosomes (random sequences), no word was extracted by this method. The satisfied denoising ability was demonstrated by this result. It is possible that some DNA words can be generated by chance in these random base sequences. But their positions in these sequences should be random, and follow a uniform distribution. Therefore, they can not pass the selection criteria.
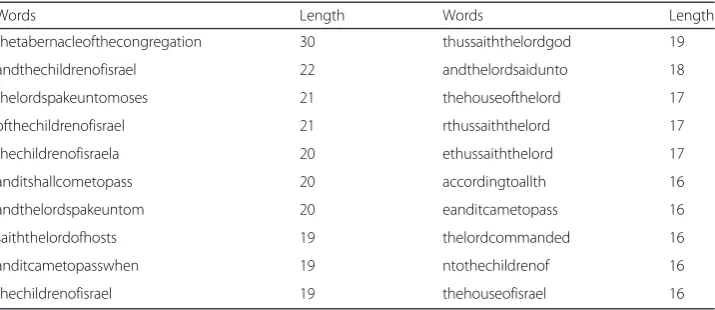
All 4523 words extracted from the Holy Biblewere given in Additional file 3, and the top 20 longest English words were listed in Table 3. In this table, almost every word was made up of a few simple natural English words. These English words had clear meanings, and their meanings were related to the content of this book. Besides, the boundary of 65.7 % words can be identified accurately. For example, a compound word “thechildrenofisrael” was identified, but its incomplete subsequences, such as “hechildrenofisrael”, were not found in the results. Although the compound words “andthechildrenofisrael”and“ofthechildrenofisrael”also appeared in the results, their boundaries were also complete. Meanwhile, “thechildrenofisraela” in the results also indicated that this algorithm still needs to be improved.
Algorithm verification with genomic comparison
All DNA words were given in Additional file 4. As shown in Fig. 2, the length of most DNA words < 10. The word length ranged from 1 to 11 in Ecoli, and from 3 to 17 in Scere. In number, the words of Ecoli were larger than the words of Scere. Moreover, there were only a few common words between Ecoli and Scere. The difference showed in this figure demonstrated the great difference between the two species.
Besides, the vocabularies of all DNA strands were compared. A complete comparison between each two strands was given in Additional file 5 (its legend was given in Additional file 6), and the partial results were shown in Fig. 3. As shown in Fig. 3, all genomes can be divided into three categories: Ecoli nuclear chromosomes, Ecoli plas-mid chromosomes and Scere chromosomes. There were hardly common words among the three classes of chromosomes. We observed huge differences among them.
For the comparison among the chromosomes within each class, there was a high simi-larity among Ecoli nuclear chromosomes. There was a low simisimi-larity among plasmid
Table 3Top 20 longest words in the information spectrums of theHoly Bible
Words Length Words Length
thetabernacleofthecongregation 30 thussaiththelordgod 19
andthechildrenofisrael 22 andthelordsaidunto 18
thelordspakeuntomoses 21 thehouseofthelord 17
ofthechildrenofisrael 21 rthussaiththelord 17
thechildrenofisraela 20 ethussaiththelord 17
anditshallcometopass 20 accordingtoallth 16
andthelordspakeuntom 20 eanditcametopass 16
saiththelordofhosts 19 thelordcommanded 16
anditcametopasswhen 19 ntothechildrenof 16
chromosomes, and the similar results were showed for Scere chromosomes. For the com-parison between the sense strand and the antisense strand of the same chromosome, there was a higher similarity between two strands of each Ecoli nuclear chromosomes. There was a low similarity between two strands of each plasmid chromosomes, and the similar results were shown for Scere chromosomes. As shown in these results, the vocabularies can show the features of different chromosome, and these DNA words had biological significances.
Fig. 2Comparison between Ecoli vocabulary and Scere vocabulary. The DNA words were sorted by length. The height of every bar represented the number of the words in a length.“Common”represented the common words between Ecoli and Scere
Associations between DNA words and gene functions
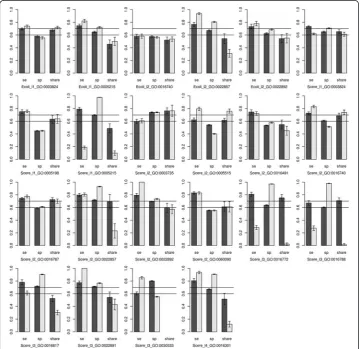
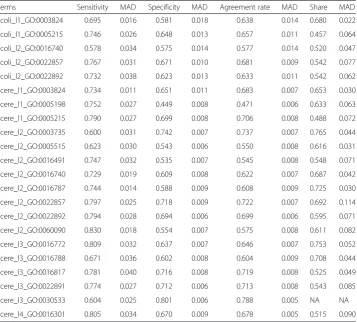
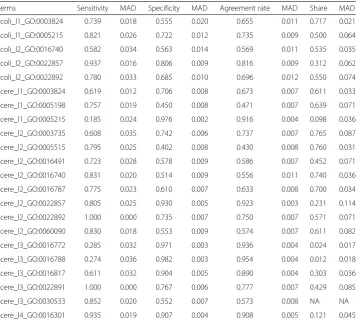
For each GO term, two fitting models were established depending on whether or not the first-order interaction was added. In the end, 22 GO terms were used to establish 44 fitting models. The predicted effects of all models were illustrated in Fig. 4, and detailed values were shown in Tables 4 and 5.
As shown in Fig. 4, without considering the interaction, the predicted sensitivity and specificity of the fitting models of Scere_l1_GO:0005215, Scere_l2_GO:0022857, Scere_l2_GO:0022892, Scere_l3_GO:0016817, and Scere_l3_GO:0022891 were greater than 0.7. With the first-order interaction, the predicted sensitivity and specificity of the fitting models of Ecoli_l1_GO:0005215, Ecoli_l2_GO:0022857, Scere_l2_GO:0022857, Scere_l2_GO:0022892, Scere_l3_GO:0022891, and Scere_l4_GO:0016301 were greater than 0.7. The functions of these GO terms are transporter activity (GO:0005215), trans-membrane transporter activity (GO:0022857), substrate-specific transporter activity (GO:0022892), substrate-specific transmembrane transporter activity (GO:0022891), hydrolase activity on acid anhydrides (GO:0016817) and kinase activity (GO:0016301),
respectively. These logistic models included the DNA words and corresponding coeffi-cients related with the functions. Given a gene sequence, the frequency of all DNA words could be counted. Therefore, the probability prediction of these functions could be acquired according to corresponding models. It should be noted that a gene from prokaryote should be applied with the models of Ecoli, and a gene from eukaryote should be applied with the models of Scere.
Although the interaction can improve the prediction performance in many cases, but not always. In addition, the predicted results were bad in the share group. Although the predicted accuracy rates were high for some terms (e.g., Scere_l2_GO:0003735) in the share group, the sensitivity or specificity of these terms were poor and the prediction would be meaningless.
Discussion
In this study, we hypothesize that non-uniform distribution and integrity were two important features of a DNA word. Therefore, we can define a word as a complete symbol sequence not following the uniform distribution within a certain scope. Carpena et al. [11] and Hackenberg et al. [12] have shown the importance of the non-uniform distribution in the identification of the words. Carpena et al. [11] have also explored the integrity with the help of the semantic meanings of the words, but their method can not be applied to the genome directly. In this study,
Table 4Evaluation of function prediction of logistic model without interaction
Terms Sensitivity MAD Specificity MAD Agreement rate MAD Share MAD
Ecoli_l1_GO:0003824 0.695 0.016 0.581 0.018 0.638 0.014 0.680 0.022
Ecoli_l1_GO:0005215 0.746 0.026 0.648 0.013 0.657 0.011 0.457 0.064
Ecoli_l2_GO:0016740 0.578 0.034 0.575 0.014 0.577 0.014 0.520 0.047
Ecoli_l2_GO:0022857 0.767 0.031 0.671 0.010 0.681 0.009 0.542 0.077
Ecoli_l2_GO:0022892 0.732 0.038 0.623 0.013 0.633 0.011 0.542 0.062
Scere_l1_GO:0003824 0.734 0.011 0.651 0.011 0.683 0.007 0.653 0.030
Scere_l1_GO:0005198 0.752 0.027 0.449 0.008 0.471 0.006 0.633 0.063
Scere_l1_GO:0005215 0.790 0.027 0.699 0.008 0.706 0.008 0.488 0.072
Scere_l2_GO:0003735 0.600 0.031 0.742 0.007 0.737 0.007 0.765 0.044
Scere_l2_GO:0005515 0.623 0.030 0.543 0.006 0.550 0.008 0.616 0.031
Scere_l2_GO:0016491 0.747 0.032 0.535 0.007 0.545 0.008 0.548 0.071
Scere_l2_GO:0016740 0.729 0.019 0.609 0.008 0.622 0.007 0.687 0.042
Scere_l2_GO:0016787 0.744 0.014 0.588 0.009 0.608 0.009 0.725 0.030
Scere_l2_GO:0022857 0.797 0.025 0.718 0.009 0.722 0.007 0.692 0.114
Scere_l2_GO:0022892 0.794 0.028 0.694 0.006 0.699 0.006 0.595 0.071
Scere_l2_GO:0060090 0.830 0.018 0.554 0.007 0.575 0.008 0.611 0.082
Scere_l3_GO:0016772 0.809 0.032 0.637 0.007 0.646 0.007 0.753 0.052
Scere_l3_GO:0016788 0.671 0.036 0.602 0.008 0.604 0.009 0.708 0.044
Scere_l3_GO:0016817 0.781 0.040 0.716 0.008 0.719 0.008 0.525 0.049
Scere_l3_GO:0022891 0.774 0.027 0.712 0.006 0.713 0.008 0.543 0.085
Scere_l3_GO:0030533 0.604 0.025 0.801 0.006 0.788 0.005 NA NA
we proposed a novel method with the help of the sequence and position alignment among the symbol sequences.
Negative control is very important for evaluating the false positive of an ab initio al-gorithm. In this study, two random base sequences were adopted to check it. As shown in the results, the denoising capability of our algorithm was reasonable. For the DNA vocabulary, there has not been a gold standard. Therefore, we used an English text, Holy Bible, as a positive control. As shown in the results, not only some words can be extracted, but also the boundary of many words can be identified. However, we also re-alized that the boundary of some words still cannot be identified accurately. Note that the symbol sequences were analyzed in a descending order for given word lengths in the algorithm. This unidirectional search can cause an amplification of biases. The re-sults can be improved by a bidirectional search, which will be investigated in our future work. Moreover, the integrity was not quantitatively analyzed. We expect that a quanti-tative evaluation method independent of dictionary can be developed in the near future.
In this study, the great difference between two species, Ecoli and Scere, was illus-trated by their vocabularies. Meanwhile, the similarities and differences between the DNA strands can also be clearly shown by their vocabularies. It should be noted that the antisense strand is the reverse complementary chain of the sense strand, but the in-formation of two strands is different. From these comparison results, further utilization of this algorithm can be extended to the area of taxonomy.
Table 5Evaluation of function prediction of logistic model with the first-order interaction
Terms Sensitivity MAD Specificity MAD Agreement rate MAD Share MAD
Ecoli_l1_GO:0003824 0.739 0.018 0.555 0.020 0.655 0.011 0.717 0.021
Ecoli_l1_GO:0005215 0.821 0.026 0.722 0.012 0.735 0.009 0.500 0.064
Ecoli_l2_GO:0016740 0.582 0.034 0.563 0.014 0.569 0.011 0.535 0.035
Ecoli_l2_GO:0022857 0.937 0.016 0.806 0.009 0.816 0.009 0.312 0.062
Ecoli_l2_GO:0022892 0.780 0.033 0.685 0.010 0.696 0.012 0.550 0.074
Scere_l1_GO:0003824 0.619 0.012 0.706 0.008 0.673 0.007 0.611 0.033
Scere_l1_GO:0005198 0.757 0.019 0.450 0.008 0.471 0.007 0.639 0.071
Scere_l1_GO:0005215 0.185 0.024 0.976 0.002 0.916 0.004 0.098 0.036
Scere_l2_GO:0003735 0.608 0.035 0.742 0.006 0.737 0.007 0.765 0.087
Scere_l2_GO:0005515 0.795 0.025 0.402 0.008 0.430 0.008 0.760 0.031
Scere_l2_GO:0016491 0.723 0.028 0.578 0.009 0.586 0.007 0.452 0.071
Scere_l2_GO:0016740 0.831 0.020 0.514 0.009 0.556 0.011 0.740 0.036
Scere_l2_GO:0016787 0.775 0.023 0.610 0.007 0.633 0.008 0.700 0.034
Scere_l2_GO:0022857 0.805 0.025 0.930 0.005 0.923 0.003 0.231 0.114
Scere_l2_GO:0022892 1.000 0.000 0.735 0.007 0.750 0.007 0.571 0.071
Scere_l2_GO:0060090 0.830 0.018 0.553 0.009 0.574 0.007 0.611 0.082
Scere_l3_GO:0016772 0.285 0.032 0.971 0.003 0.936 0.004 0.024 0.017
Scere_l3_GO:0016788 0.274 0.036 0.982 0.003 0.954 0.004 0.012 0.018
Scere_l3_GO:0016817 0.611 0.032 0.904 0.005 0.890 0.004 0.303 0.036
Scere_l3_GO:0022891 1.000 0.000 0.767 0.006 0.777 0.007 0.429 0.085
Scere_l3_GO:0030533 0.852 0.020 0.552 0.007 0.573 0.008 NA NA
In the results of the English text, it is obvious that not all English words were cap-tured. In order to capture the missing DNA words in a genome study, a DNA vocabu-lary can be constructed by integrating all the DNA words extracted from different DNA strands. According to the DNA vocabulary and gene annotations, we explored the relationships between gene functions and the DNA words. The results showed that the words can predict gene functions to some degree. In many cases, prediction ability was improved with interaction, but not always. In this study, the product of two word frequencies was adopted in the inspection of the interaction. Other higher order inter-actions might exit and can be considered as well.
An important problem in the function prediction was that the prediction results were not satisfying in the share group. The reason might be that the functions of the share group were fundamentally different from the functions of exclusive group. In addition, there were many functions which were not able to be predicted by these words. It might indicate that these functions were not the major or critical features of the chromosomes.
Conclusions
In summary, we proposed a novel definition for DNA word based on distribution and integrity. According to the definition, a simple and effective algorithm was developed to extract DNA words, based on which a DNA dictionary can be built ab initio. This may open a new perspective to explore the functions of a genome with the aid of com-putationally efficient tools.
Additional files
Additional file 1:Link of Download.doc.The download links of the data in this manuscript. (DOC 12 kb)
Additional file 2:Numbers of Chromosomes.doc.The numbers of all chromosomes were listed in this file. (DOC 45 kb)
Additional file 3:Vocabulary of Holy Bible.csv.The words extracted from theHoly Biblewere listed in these files. (CSV 28 kb)
Additional file 4:DNAWords.csv.The DNA words extracted from Ecoli and Scere. (CSV 23 kb)
Additional file 5:Complete Comparison of vocabularies.jpg.A complete comparison between the vocabularies of all DNA strands was shown in this figure. (JPG 10477 kb)
Additional file 6:The legend of Additional file 5.doc.(DOC 10 kb)
Abbreviations
KS:Kolmogorov-Smirnov; Scere: Saccharomyces cerevisiae; Ecoli: Escherichia coli.
Competing interests
The authors declare that they have no competing interests.
Authors’contributions
ZL conducted the analysis and drafted the manuscript; HC participated in data analysis; YC and YZ participated in study design and drafted the manuscript. All authors read and approved the final manuscript.
Acknowledgements
We gratefully acknowledge support from the National Natural Science Foundation of China [31071156, 31371336].
Author details
1Department of Health Statistics, School of Public Health, Shanxi Medical University, Taiyuan 030001, China. 2
Department of Statistics and Probability, Michigan State University, East Lansing, MI 48824, USA.
References
1. Bailey TL. Discovering sequence motifs. In: Jonathan MK, editor. Bioinformatics, vol. I. Totowa: Humana Press; 2008. p. 271–92.
2. Sun HQ, Low MYH, Hsu WJ, Rajapakse JC. RecMotif: a novel fast algorithm for weak motif discovery. BMC Bioinform. 2010;11 Suppl 11:S8.
3. Chor B, Horn D, Goldman N, Levy Y, Massingham T. Genomic DNA k-mer spectra: models and modalities. Genome Biol. 2009;10:R108.
4. Bohlin J, Van Passel MW, Snipen L, Kristoffersen AB, Ussery D, Hardy SP. Relative entropy differences in bacterial chromosomes, plasmids, phages and genomic islands. BMC Genomics. 2012;13:66.
5. Castellini A, Franco G, Manca V. A dictionary based informational genome analysis. BMC Genomics. 2012;13:485. 6. Chang CH, Hsieh LC, Chen TY, Chen HD, Luo L, Lee HC. Shannon information in complete genomes. J Bioinform
Comput Biol. 2005;3:587–608.
7. Chun-Ting Z, Feng G, Ren Z. Segmentation algorithm for DNA sequences. Physical Rev E. 2005;72:041917. 8. Sadovsky MG, Putintseva JA, Shchepanovsky AS. Genes, information and sense: complexity and knowledge
retrieval. Theor Biosci. 2008;127:69–78.
9. Pawitan Y. In all likelihood: statistical modelling and inference using likelihood. Oxford: University Press; 2001. 10. Asudeh A, Dalrymple M, Toivonen I. Constructions with lexical integrity. Journal of Language Modelling.
2013;1(1):1–54.
11. Carpena P, Bernaola-Galván P, Hackenberg M, Coronado AV, Oliver JL. Level statistics of words: finding keywords in literary texts and symbolic sequences. Phys Rev E Stat Nonlin Soft Matter Phys. 2009;79:035102.
12. Hackenberg M, Rueda A, Carpena P, Bernaola-Galván P, Barturen G, Oliver JL. Clustering of DNA words and biological function: a proof of principle. J Theor Biol. 2012;297:127–36.
13. Li Z, Cui YH, Zhang YB. Quantification of the differences between the distributions of the sequences in a Genome. Chin J Health Stat. 2014;8(4):554–8.
14. R Core Team. R. A language and environment for statistical computing. Vienna, Austria: R Foundation for Statistical Computing; 2013. http://www.R-project.org/. (Accessed on 19 January 2016).
• We accept pre-submission inquiries
• Our selector tool helps you to find the most relevant journal
• We provide round the clock customer support
• Convenient online submission
• Thorough peer review
• Inclusion in PubMed and all major indexing services
• Maximum visibility for your research
Submit your manuscript at www.biomedcentral.com/submit