1
Impact of atopy on risk of glioma: A Mendelian randomization study
1
2
Linden Disney-Hogg
1*, Alex J. Cornish
1*, Amit Sud
1, Philip J. Law
1, Ben Kinnersley
1, Daniel I.
3
Jacobs
2, Quinn T. Ostrom
3, Karim Labreche
1, Jeanette E. Eckel-Passow
4, Georgina N.
4
Armstrong
2, Elizabeth B. Claus
5,6, Dora Il'yasova
7,8,9, Joellen Schildkraut
8,9, Jill S.
Barnholtz-5
Sloan
3, Sara H. Olson
10, Jonine L. Bernstein
10, Rose K. Lai
11, Minouk J. Schoemaker
1, Matthias
6
Simon
12, Per Hoffmann
13,14, Markus M. Nöthen
14,15, Karl-Heinz Jöckel
16, Stephen Chanock
17,
7
Preetha Rajaraman
17, Christoffer Johansen
18, Robert B. Jenkins
19, Beatrice S. Melin
20,
8
Margaret R. Wrensch
21,22, Marc Sanson
23,24, Melissa L. Bondy
2, Richard S. Houlston
1,259
10
1.
Division of Genetics and Epidemiology, The Institute of Cancer Research, London, UK.
11
2.
Department of Medicine, Section of Epidemiology and Population Sciences, Dan L.
12
Duncan Comprehensive Cancer Center, Baylor College of Medicine, Houston, TX,
13
USA.
14
3.
Case Comprehensive Cancer Center, School of Medicine, Case Western Reserve
15
University, Cleveland, Ohio, USA.
16
4.
Division of Biomedical Statistics and Informatics, Mayo Clinic College of Medicine,
17
Rochester, Minnesota, USA.
18
5.
School of Public Health, Yale University, New Haven, Connecticut, USA.
19
6.
Department of Neurosurgery, Brigham and Women’s Hospital, Boston,
20
Massachusetts, USA.
21
7.
Department of Epidemiology and Biostatistics, School of Public Health, Georgia State
22
University, Atlanta, Georgia, USA.
23
8.
Duke Cancer Institute, Duke University Medical Center, Durham, North Carolina,
24
USA.
2
9.
Cancer Control and Prevention Program, Department of Community and Family
26
Medicine, Duke University Medical Center, Durham, North Carolina, USA.
27
10.
Department of Epidemiology and Biostatistics, Memorial Sloan Kettering Cancer
28
Center, New York, New York, USA.
29
11.
Departments of Neurology and Preventive Medicine, Keck School of Medicine,
30
University of Southern California, Los Angeles, California, USA.
31
12.
Department of Neurosurgery, University of Bonn Medical Center,
Sigmund-Freud-32
Str. 25, 53105 Bonn, Germany.
33
13.
Human Genomics Research Group, Department of Biomedicine, University of Basel,
34
Basel, Switzerland.
35
14.
Department of Genomics, Life & Brain Center, University of Bonn, Bonn, Germany.
36
15.
Institute of Human Genetics, University of Bonn School of Medicine & University
37
Hospital Bonn, Bonn, Germany.
38
16.
Institute for Medical Informatics, Biometry and Epidemiology, University Hospital
39
Essen, University of Duisburg-Essen, Essen, Germany.
40
17.
Division of Cancer Epidemiology and Genetics, National Cancer Institute, Bethesda,
41
USA
42
18.
Institute of Cancer Epidemiology, Danish Cancer Society, Copenhagen, Denmark,
43
Rigshospitalet, University of Copenhagen, Copenhagen, Denmark.
44
19.
Department of Laboratory Medicine and Pathology, Mayo Clinic Comprehensive
45
Cancer Center, Mayo Clinic, Rochester, Minnesota, USA.
46
20.
Department of Radiation Sciences, Umeå University, Umeå, Sweden
47
21.
Department of Neurological Surgery, School of Medicine, University of California,
48
San Francisco, San Francisco, California, USA .
49
22.
Institute of Human Genetics, University of California, San Francisco, California, USA
3
23.
Sorbonne Universités UPMC Univ Paris 06, INSERM CNRS, U1127, UMR 7225, ICM,
F-51
75013 Paris, France.
52
24.
AP-HP, Groupe Hospitalier Pitié-Salpêtrière, Service de neurologie 2-Mazarin, Paris,
53
France.
54
25.
Division of Molecular Pathology, The Institute of Cancer Research, London UK.
55
56
* These authors contributed equally to this work
57
‡ Correspondence to: Richard S Houlston, Division of Genetics and Epidemiology, The
58
Institute of Cancer Research, 15 Cotswold Road, London, SM2 5NG. Tel: +44 (0) 208 722
59
4175; Fax: +44 (0) 722 4365; E-mail: [email protected]
60
61
62
63
64
65
66
67
68
69
70
71
72
73
74
4
ABSTRACT
76
77
BACKGROUND:
An inverse relationship between allergies with glioma risk has been
78
reported in several but not all epidemiological observational studies. We performed an
79
analysis of genetic variants associated with atopy to assess the relationship with glioma risk
80
using Mendelian randomization (MR), an approach unaffected by biases from temporal
81
variability and reverse causation that might have affected earlier investigations.
82
83
METHODS:
Two-sample MR was undertaken using genome-wide association study data. We
84
used single nucleotide polymorphisms (SNPs) associated with atopic dermatitis, asthma and
85
hay fever, IgE levels and self-reported allergy as instrumental variables. We calculated MR
86
estimates for the odds ratio (OR) for each risk factor with glioma using SNP-glioma estimates
87
from 12,488 cases and 18,169 controls, using inverse-variance weighted (IVW), maximum
88
likelihood estimation (MLE), weighted median estimate (WME) and mode-based estimate
89
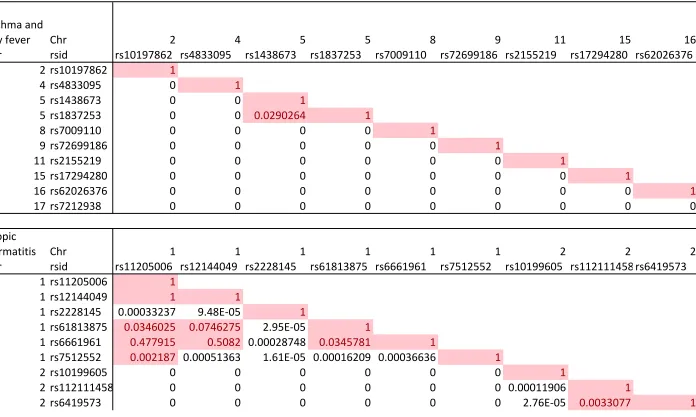
(MBE) methods. Violation of MR assumptions due to directional pleiotropy were sought
90
using MR-Egger regression and HEIDI-outlier analysis.
91
92
RESULTS:
Under IVW, MLE, WME and MBE methods, associations between glioma risk with
93
asthma and hay fever, self-reported allergy and IgE levels were non-significant. An inverse
94
relationship between atopic dermatitis and glioma risk was found by IVW (OR=0.96, 95%
95
confidence interval [CI]: 0.93-1.00, P=0.041) and MLE (OR=0.96, 95% CI=0.94-0.99, P=0.003)
96
but not by WME (OR=0.96, 95% CI: 0.91-1.01, P=0.114) or MBE (OR=0.97, 95% CI: 0.92-1.02,
97
P=0.194).
98
5
CONCLUSIONS:
Our investigation does not provide strong evidence for relationship
100
between atopy and the risk of developing glioma, but findings do not preclude a small effect
101
in relation to atopic dematitis. Our analysis also serves to illustrate the value of using several
102
MR methods to derive robust conclusions.
103
104
KEYWORDS
: Mendelian randomisation; allergy; cancer; glioma; risk
105
106
107
108
109
110
111
112
113
114
115
116
117
118
119
120
121
122
123
6
BACKGROUND
125
126
Although glioma accounts for around 80% of malignant primary brain tumours [1], to date
127
few aetiological risk factors are well established for the disease [2]. Over the past three
128
decades the search for an immune-mediated risk factor that might influence risk has led to
129
studies of a possible relationship between multiple allergic conditions and autoimmune
130
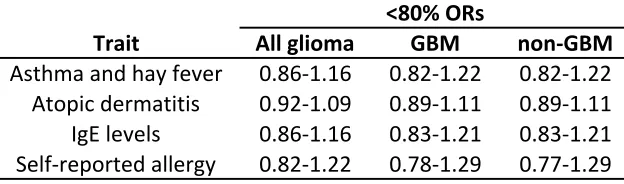
disorders with glioma [3].
131
132
Several case-control studies have shown that self-reported allergic conditions may protect
133
against glioma [4]. For example, in the International Adult Brain Tumour Study, based on
134
1,178 glioma patients, an odds ratio (OR) of 0.59 was found for any self-reported allergy [5].
135
Other case-control studies have reported similar ORs, however most have been reliant on
136
substantial numbers of proxy informants (up to 44%) [4, 6], and potential bias as a
137
consequence of how controls were ascertained, thereby casting doubt on findings. In
138
contrast to case-control studies, evidence for an association between glioma and allergy
139
from cohort-based analyses has been less forthcoming [7], although such studies have been
140
poorly powered to demonstrate a relationship.
141
142
Assaying IgE potentially reduces bias stemming from self-reporting despite levels not
143
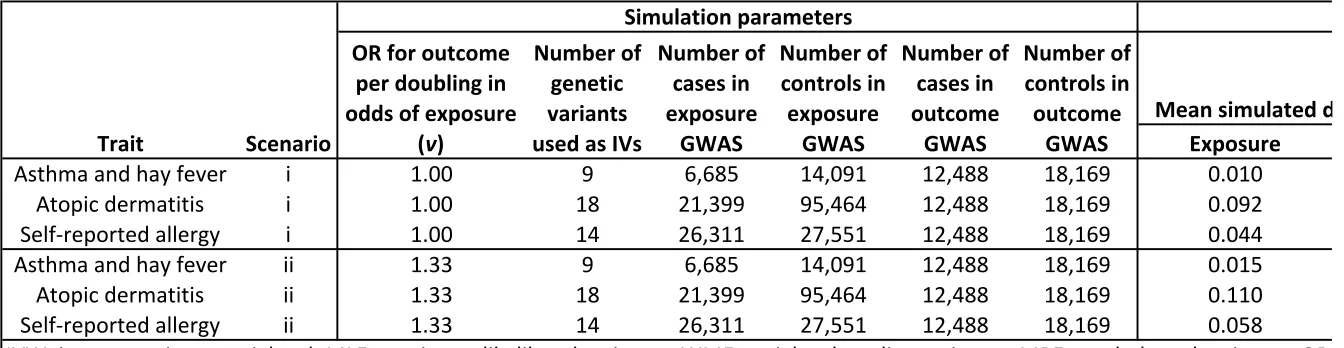
necessarily corresponding to specific allergies or equating to a single allergic response.
144
Nevertheless measurement of IgE has been explored by a number of researchers seeking to
145
identify risk factors for glioma [8-10]. In a case-control study of 228 cases and 289 controls
146
performed in 2004, self-reported allergies and IgE levels were both inversely associated with
147
glioma, but concordance between the two outcomes was poor [8]. In a larger study of 535
148
cases and 532 controls, both self-reported allergies and IgE levels were inversely related to
7
glioma risk, however IgE levels in patients were affected by temozolomide treatment [11]. A
150
case-control study nested within the European Prospective Investigation into Cancer and
151
Nutrition cohort based on prospectively collected serum IgE levels reported a
non-152
significant OR of 0.73 [9]. A similar nested case-control study performed in the USA based
153
on 181 cases reported non-significant OR of 0.72 for high serum IgE [10].
154
155
Several mechanisms have been proposed to explain a possible association between atopic
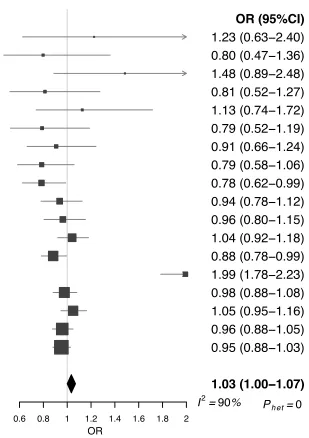
156
disease and glioma [12]. The findings could reflect a true causal effect of the heightened
157
immune function reported for atopy on tumour development. Alternatively, the
158
associations observed might be non-causal, arising as a consequence of methodological
159
biases inherent in the study design. Imprecisely defined exposures such as allergic disease
160
are likely to have affected the validity of the findings of both case-control and cohort
161
studies. The heterogeneous description of allergy in studies and different levels of detail in
162
self-reporting on individual allergies complicate interpretation of the results. Additional
163
biases include possible selection bias in controls, recall bias from self-reported allergy
164
assessment and reverse causation or confounding from unmeasured effects. Finally, the
165
high frequency of exposure ascertainment by proxy for cases is also likely to have
166
systematically biased findings.
167
168
Mendelian randomization (MR) analysis can be used to minimise potential biases in
169
conventional observational studies and to determine the causal association of an exposure
170
with an outcome, such as disease risk [13]. The causal association can also be manifested by
171
common genetic and biological pathways that determine two sequentially developed
172
phenotypes, such as an atopic trait and glioma risk. Atopy has a strong heritable basis [14,
173
15], and thus far genome-wide association studies (GWAS) have identified over 50 loci
8
associated with different atopy-related traits [16]. The alleles associated with atopy should
175
be randomly assigned to offspring from parents during mitosis, a process analogous to the
176
random assignment of subjects to an exposure of interest in randomised clinical trials. Thus,
177
genetic scores summarising the effects of single nucleotide polymorphisms (SNPs)
178
associated with atopy-related traits can serve as instrumental variables (IVs) in a MR
179
analysis of atopy and glioma risk.
180
181
To examine the nature of the association between atopy and glioma, we implemented
two-182
sample MR [17] to estimate associations between atopy-associated SNPs and glioma risk
183
using summary data from the recent GWAS meta-analysis performed by the Glioma
184
International Case-Control Consortium study (GICC) [18].
185
186
187
188
189
190
191
192
193
194
195
196
197
198
9
METHODS
200
201
Two-sample MR was undertaken using GWAS data. Ethical approval was not sought for this
202
specific project because all data came from the summary statistics of published GWAS, and
203
no individual-level data were used.
204
205
Glioma genotyping data
206
Glioma genotyping data were derived from the most recent meta-analysis of GWAS in
207
glioma, which related >10 million genetic variants (after imputation) to glioma, in 12,488
208
glioma patients and 18,169 controls from eight independent GWAS datasets of individuals
209
of European descent [18]
(
Additional file 2: Table S1
). Comprehensive details of the
210
genotyping and quality control of the seven GWAS have been previously reported [18].
211
212
Genetic variant instruments for atopic traits
213
SNPs associated with each of the atopy-related traits investigated – atopic dermatitis
214
(eczema), asthma and hay fever, IgE level, and self-reported allergy by the NHGRI-EBI GWAS
215
Catalog [19-26] at genome-wide significance (i.e. P≤5.0 × 10
-8) in individuals with European
216
ancestry were used as IVs. To avoid co-linearity between SNPs for each trait, we excluded
217
SNPs that were correlated (i.e. r
2value of ≥0.001) within each trait, and only considered the
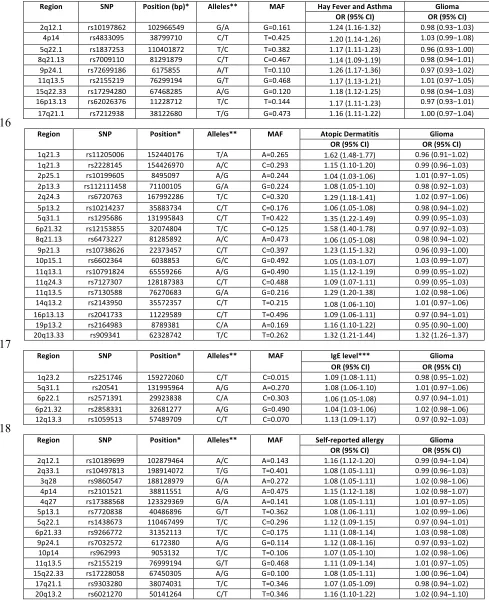
218
SNPs with the strongest effect on the trait for use as IVs (
Additional file 3: Table S2
). For
219
each SNP, we recovered the chromosome position, risk allele, association estimates
(per-220
allele log-OR) and standard errors (SEs), summarised in
Table 1
. The allele that was
221
associated with increased risk of the exposure was considered the effect allele. For IgE level,
222
the allele associated with an increase in serum IgE was considered the effect allele. Allele
223
frequencies for these SNPs were compared between the atopy-related trait and glioma
10
datasets to ensure that the effect estimates were recorded with respect to the same allele.
225
Gliomas are heterogeneous and different tumour subtypes, defined in part by malignancy
226
grade (for example, pilocytic astrocytoma World Health Organization (WHO) grade I, diffuse
227
‘low-grade' glioma WHO grade II, anaplastic glioma WHO grade III and glioblastoma [GBM]
228
WHO grade IV) can be distinguished [27]. For the sake of brevity we considered gliomas as
229
being either GBM or non-GBM.
230
231
Two-sample Mendelian randomization method
232
The association between each atopy-related trait and glioma was examined using MR on
233
summary statistics using the inverse variance weighted (IVW) method and maximum
234
likelihood estimation (MLE) as per Burgess et al. [28]. The IVW ratio estimate (β) of all SNPs
235
associated with each atopy-related trait on glioma risk was calculated as follows:
236
237
β
=
!
!!
!!
!!!!
!
!
!!!
!! !!
!
.
238
Where X
kcorresponds to the association of SNP k (as log of the OR per risk allele) with the
239
atopy-related trait
Y,
Y
kis the association between SNP k and glioma risk (as log OR) with
240
standard error
!
!!. The estimate for (β) represents the causal increase in the log odds of
241
glioma for each trait. The standard error of the combined ratio estimate is given by:
242
243
se(β)
=
1
!
!!!
!!
!!
!
.
11
For the maximum likelihood estimate, a bivariate normal distribution for the genetic
245
associations was assumed, and the R function
optim was used to estimate
!
.
se(
β
)
was
246
calculated using observed information. The correlation between the errors of
!
!and
!
!was
247
taken to be 0 as they were derived from independent studies.
248
249
A central tenet in MR is the absence of pleiotropy (i.e. a gene influencing multiple traits)
250
between the SNPs influencing the exposure and outcome disease risk [13]. This would be
251
revealed as deviation from a linear relationship between SNPs and their effect size for atopy
252
and glioma risk. To examine for violation of the standard IV assumptions in our analysis we
253
first performed MR-Egger regression, as well as HEIDI-outlier analysis as per Zhu, Z et al. [29]
254
imposing the advocated threshold of
P ≤0.01. Additionally we derived weighted median
255
estimates (WME) [30] and mode-based estimates (MBE) [31] to establish the robustness of
256
findings.
257
258
Atopic dermatitis, asthma and hay fever, and self-reported allergyand all of the disease
259
outcomes (all glioma, GBM and non-GBM glioma) are binary The causal effect estimates
260
therefore represent the odds for outcome disease risk per unit increase in the log OR of the
261
exposure disease [32]. These ORs have been converted to represent the OR for the outcome
262
disease per doubling in odds of the exposure disease to aid interpretation [32].
263
264
For each statistical test we considered a global significance level of
P <0.05 as being
265
satisfactory to derive conclusions. To assess the robustness of our conclusions, we initially
266
imposed a conservative Bonferroni-corrected significance threshold of 0.0125 (i.e. 0.05/4
267
atopy-related traits). We considered a P value ≥0.05 as non-significant (i.e. no association), a
268
P value <0.05 as evidence for a potential causal association, and a
P <0.0125 as significant
12
evidence for an association. All statistical analyses were undertaken using R software
270
(Version 3.1.2). The meta and gsmr packages were used to generate forest plots and
271
perform HEIDI-outlier analysis [29].
272
273
The power of a MR investigation depends greatly on the proportion of variance in the risk
274
factor that is explained by the IV. We estimated study power a priori using the methodology
275
of Burgess
et al.
[33], making use of published estimates of the heritability of trait
276
associated IV SNPs [34-36], as well as estimates found by direct calculation (
Additional file
277
4: Table S3
), and the reported effect of each trait on glioma risk reported in meta-analysis of
278
epidemiological studies [18].
Additional file 5: Table S4
shows the range of ORs, for which
279
we had less than 80% power to detect for each of the four atopy-related traits.
280
281
Simulation model
282
Through simulation we evaluated the suitability of using each employed MR method in a
283
two-sample setting with binary-exposure and binary-outcome data. For
i
index
N
genetic
284
variants and
j
index individuals genetic variants
g
ijwere generated independently by
285
sampling from a Binomial(2,p
j) distribution with probability
p
jdrawn from a
286
Uniform(0.1,0.9) distribution, to mimic bi-allelic SNPs in Hardy-Weinberg equilibrium. Let w
j287
correspond to the per-allele OR for the exposure disease, sampled from ORs reported for
288
genome-wide significant SNPs reported in the GWAS Catalog [37], and v be the OR for the
289
outcome disease per doubling in odds of the exposure disease. For each individual,
290
exposure disease odds x
j, outcome disease odds y
j, exposure disease status a
j, and outcome
291
disease status b
jwere determined as follows:
292
!
!=
!
!!
!!!"!
13
!
!=
!
!×2
log!!! × log!!!
!~ Binomial
(
1
,
!
!1
+
!
!)
!
!~ Binomial(1
,
!
!1
+
!
!)
Data for 1,000,000 individuals were simulated and partitioned at random to reflect the
two-293
sample setting. Cases and controls for the exposure and outcome GWAS were sampled from
294
each half of the dataset using the exposure and outcome disease statuses of each individual,
295
and association statistics computed under an additive logistic regression model. To ensure
296
the simulated data closely resembled the atopy-related trait and glioma data, the simulation
297
analysis was repeated for each binary atopy-related trait using the same number of genetic
298
variants as IVs and the same numbers of case and control individuals as used to estimate the
299
atopy-related trait and glioma association statistics (
Additional file 6: Table S5
). Parameters
300
x
0=0.0005 and y
0=0.01 were chosen to ensure the prevalence of the simulated exposure and
301
outcome diseases were similar to that of the atopy-related traits and glioma respectively
302
(
Additional file 6: Table S5
). To determine the suitability of each MR method we considered
303
two scenarios: (i) no causal relationship between exposure and outcome (v=1.00) and (ii) a
304
causal relationship between exposure and outcome (v=1.33). We performed 100
305
simulations for each scenario for each binary atopy-related trait.
306
307
308
309
310
311
312
14
RESULTS
314
315
The atopic dermatitis risk SNP rs909341, which is highly correlated with the chromosome
316
20q13.33 glioma risk SNP rs2297440 (D’=0.89, r
2=0.77), was strongly associated with risk of
317
glioma (P=2.10x10
-34). Testing for pleiotropy using HEIDI outlier-analysis formally identified
318
rs909341 as violating the assumption of the instrument on the outcome. Henceforth we
319
confined our analysis of the relationship between atopic dermatitis and glioma to a dataset
320
excluding this SNP.
321
322
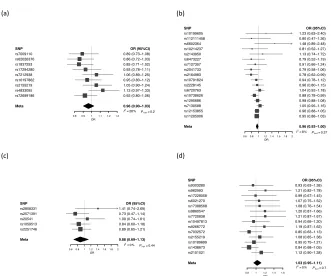
Figure 1
shows forest plots of ORs for glioma generated from the SNPs. There was minimal
323
evidence of heterogeneity between variants for asthma and hay fever, atopic dermatitis, IgE
324
levels and self-reported allergy (respective
I
2and
Phet values being 28% and 0.192, 8% and
325
0.377, 0% and 0.444, and 0% and 0.707). Including rs909341 in the analysis for atopic
326
dermatitis, the
I
2value was 90% and
Phet
< 10
-4(
Additional file 1: Figure S1
), providing
327
further evidence that inclusion of this SNP would invalidate the MR analysis.
328
329
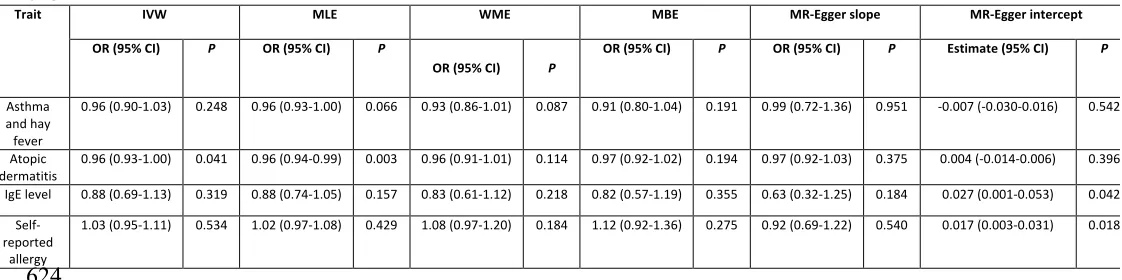
The results of the IVW, MLE, WME, MBE and MR-Egger methods are summarised in
Table 2
.
330
Using the IVW method to pool results from individual SNPs, no associations (i.e.
P≥0.05)
331
were identified between genetically conferred risk of raised IgE level (OR=0.88, 95%
CI=0.69-332
1.13,
P=0.319), asthma and hay fever (OR=0.96, 95% CI=0.90-1.03,
P=0.248), or
self-333
reported allergy (OR=1.03, 95% CI=0.95-1.11,
P=0.534) with risk of all glioma. There was
334
some support for an inverse relationship between atopic dermatitis and glioma risk
335
(OR=0.96, 95% CI=0.93-1.00,
P=0.041), albeit not significant after adjustment for multiple
336
testing.
337
15
Using MLE, no associations were identified between asthma and hay fever (OR=0.96, 95%
339
CI=0.93-1.00,
P=0.066), IgE levels (OR=0.88, 95% CI=0.74-1.05,
P=0.157) or self-reported
340
allergy (OR=1.02, 95% CI=0.97-1.08,
P=0.429) with risk of all glioma. For atopic dermatitis,
341
an OR of 0.96 (95% CI=0.94-0.99, P=0.003) was shown, which remained significant after
342
adjusting for multiple testing.
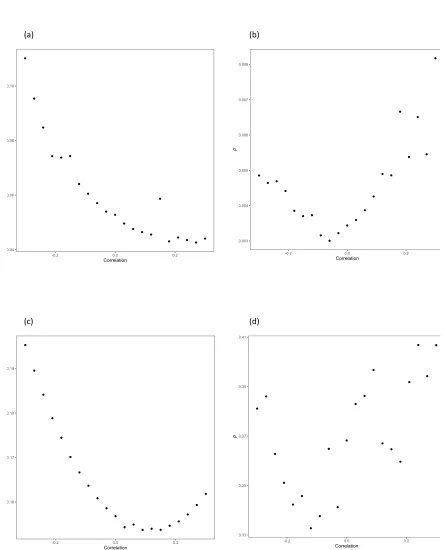
Figure 2
shows relaxation of the assumption that the
343
correlation between the errors in X
kand
Y
kis zero for each of the atopy-related traits
344
demonstrating the consistency of findings. Specifically, for a correlation in the range -0.15 to
345
0.15 the association between atopic dermatitis and glioma risk remained significant.
346
347
In contrast to findings from IVW and MLE, no significant support was provided by either the
348
WME or MBE for an association between any of the atopy-related traits and glioma risk,
349
including atopic dermatitis (WME: OR=0.96, 95% CI=0.91-1.01, P=0.114; MBE: OR=0.97, 95%
350
CI: 0.92-1.02, P=0.194;
Table 2
).
351
352
The respective effect estimated from MR-Egger regression (
Figure 3
) for atopic dermatitis,
353
IgE, asthma and hay fever, and self-reported allergy were 0.97 for atopic dermatitis (95%
354
CI=0.92-1.03; P=0.375) 0.63 for IgE levels (95% CI=0.32-1.25; P=0.184), 0.99 for asthma and
355
hay fever (95% CI=0.72-1.36, P=0.951) and 0.92 for self-reported allergy (95% CI=0.69-1.22;
356
P=0.540), with intercepts of -0.004 (95% CI=-0.014-0.006,
P=0.396), 0.027 (95%
CI=-0.001-357
0.053,
P=0.042), -0.007 (95% CI=-0.030-0.016,
P=0.542) and 0.017 (95% CI=0.003-0.031,
358
P=0.018). Collectively these findings provide possible evidence of systematic bias in the IVW
359
estimate for IgE level and self-reported allergy, which might have arisen through overall
360
unbalanced horizontal pleiotropy. There was no such evidence for such pleiotropy in respect
361
of atopic dermatitis.
362
16
We explored the possibility that a relationship between atopy and glioma might be subtype
364
specific, considering GBM and non-GBM separately. Imposing a stronger significance
365
threshold of
P=0.00625 (0.05/8, to correct for testing four traits over two outcomes), no
366
histology-specific associations were shown by the IVW method between asthma and hay
367
fever, IgE levels and self-reported allergy and glioma risk, respective ORs for the IVW
368
method being 0.97, 0.92, and 1.04 for GBM tumours, 0.96, 0.97, and 1.04 for non-GBM
369
tumours (
Additional file 7: Table S6
). For atopic dermatitis, a significant OR of 0.94 (95%
370
CI=0.90-0.98,
P=0.004) was shown for GBM but not for non-GBM (OR=0.98, 95% CI=
0.93-371
1.03,
P=0.421). The association between atopic dermatitis and risk of GBM was also
372
apparent in the MLE analysis, which provided an OR of 0.94 (95% CI=0.91-0.97, P=2.17 x 10
-373
4
). MR-Egger regression provided for an intercept of -0.007 (95% CI=-0.019-0.005, P=0.247).
374
As with the analysis of all glioma the association between atopic dermatitis and GBM was
375
weaker under the WME (OR=0.96, 95% CI=0.91-1.02, P=0.172) and MBE (OR=0.95, 95% CI=
376
0.90-1.01, P=0.096) frameworks.
377
378
Although previously implemented in other studies [32, 38], ratio estimators may not fully
379
recapitulate an estimate of the causal OR in the case of binary-exposures such as atopic
380
dermatitis, and binary-outcomes such as glioma [39]. We therefore evaluated through
381
simulation whether the IVW, MLE, WME, MBE and MR-Egger methods provide reliable
382
estimates of causal ORs. When no causal relationship between exposure and outcome was
383
simulated, each MR method provided accurate estimates of the null relationship (
Additional
384
file 6: Table S5
). Conversely when a causal relationship was simulated the magnitudes of the
385
relationship estimates were weakly inflated in some instances (
Additional file 6: Table S5
),
386
indicating the importance of considering additional evidence when evaluating causal
387
relationships between binary exposures and binary outcomes.
17
DISCUSSION
389
390
To our knowledge, this is the first MR study evaluating a range of atopy related traits with
391
glioma risk undertaken. Overall our results provide evidence for a causal protective effect of
392
atopic dermatitis with GBM tumours, but do not provide evidence that asthma and hay
393
fever, raised IgE levels, or self-reported allergy is protective against the risk of developing
394
glioma.
395
396
Possible mechanisms explaining an observed inverse relation between the risk of atopic
397
dermatitis and the risk of glioma have been suggested in previous papers [12], postulated to
398
be the consequence of the hyperactivity of the immune system. The question thus arises as
399
to how such divergent findings for other atopic traits can be explained or reconciled, when
400
they have been previously reported in high numbers.
401
402
A key assumption in MR is that the instrument affects glioma risk through its effect on a
403
specific phenotype/exposure (i.e. atopic traits), and does not have a direct effect on glioma
404
risk. We tested this assumption using MR-Egger regression and HEIDI outlier analysis and
405
found possible evidence of violation of this assumption for IgE and self-reported allergy. It is
406
notable that self-reported allergy does not show an approximately quadratic response to
407
correlation, in contrast to asthma and hay fever, atopic dermatitis, and IgE level. This is
408
likely to be a consequence of imprecise estimates of the association between SNPs and
409
allergy, illustrating the inherent issue in attempting to make use of self-reported allergy data
410
as an atopy-related trait.
411
18
The meta-analyses of published epidemiological observational studies have indeed provided
413
strong evidence for an inverse relationship between atopy and glioma risk [40]. However,
414
most of the support for such a relationship comes from the case-control studies [4]. A
415
common limitation in retrospective studies of glioma has been the use of proxy respondents
416
for cases who have cognitive impairment. A related issue is that glioma cases may not
417
remember past exposures accurately due to cognitive deficits [4]. Such issues are
418
compounded by the fact that across studies multiple atopic traits have been assessed. The
419
strength of support for a relationship seen across case-control studies contrasts markedly
420
with the limited the evidence for a relationship from prospective cohort-based analyses [7].
421
422
By inference, a relationship between long-term antihistamine use could theoretically
423
provide supporting evidence, albeit indirect, that atopic mediated mechanisms influence
424
glioma risk. However, the impact of antihistamine use is difficult to disentangle from that of
425
allergies, as these factors are highly correlated, and few individuals without allergies use
426
antihistamines regularly. Paradoxically an increased risk for glioma associated with
427
antihistamine, particularly among individuals with allergic conditions, has been found in
428
some studies [41, 42].
429
430
Raised IgE levels and self-reported allergy suffer limitations as traits used to assess the
431
effect of atopy on glioma risk as they are both variable over short time scales in their level
432
of expression (in contrast to clinical diagnosis of atopic dermatitis). Further, allergies may
433
develop later in life, and patients may not necessarily exhibit symptoms. This introduces the
434
possibility of bias and error due to time varying association of SNPs with the exposure.
435
However, it has been suggested that seasonality does not have a significant effect [11]. Th
436
19
An additional possible explanation for the lack of causal association between IgE levels and
438
glioma risk seen in this study is that the causality is in fact reversed, which could result in
439
epidemiological observational studies reporting inverse relationships [8, 9], but would not
440
affect an MR analysis. Immunosuppression caused by glioblastoma is well documented [43,
441
44] and may lead to reduced expression of atopy. Furthermore, in addition to steroids,
442
temozolomide therapy, routinely used to treat GBM nowadays, leads to reduced blood IgE
443
levels [11].
444
445
Using data from large genetic consortia for multiple atopy-related traits and glioma risk has
446
enabled us to more precisely test our study hypotheses than if we had used individual-level
447
data from a smaller study. Through simulation scenarios, the IVW, MLE, WME, MBE and
MR-448
Egger methods have been demonstrated to accurately estimate causal effects using
449
summary-level data [28, 30, 31, 45]. However, using summary-level data instead of
450
individual-level data limits the approaches that can be used to test the validity of genetic
451
variants as IVs, as adjusting for measured covariates and assessing gene-environment
452
interactions is generally not possible using summary-level data [46]. The first-stage F
453
statistic was large (>25 for all traits), and so weak instrument bias is unlikely.
454
455
Epidemiological observational studies have reported inverse relationships between
atopy-456
related traits and glioma risk, with ORs in the range 0.43-0.96 for asthma [6, 47], 0.42-0.90
457
for atopic dermatitis [6, 47], 0.37-0.73 for IgE levels [8-10] and 0.47-0.69 for self-reported
458
allergies [4, 5, 8]. Odds ratios for binary exposures estimated in this MR study represent the
459
OR for the outcome disease per doubling in odds of the exposure disease, and the
460
magnitudes of these causal effect estimates are therefore not directly comparable to those
461
reported in observational studies.
20
463
Our MR analysis has several strengths. Firstly, by utilising the random allocation of genetic
464
variants, we were able to overcome potential confounding and reverse causation that may
465
bias estimates from observational studies, Secondly, given that a poor outcome from glioma
466
is almost universal, it is unlikely that survival bias will have influenced study findings. Lastly,
467
the findings from this study represent the association of a lifelong atopy with glioma in the
468
general European population.
469
470
Our study does however have limitations. Firstly, while it is entirely appropriate to
471
implement different MR methods to assess the robustness of finding, they have different
472
differing power to demonstrate associations, with the WME, MBE and MR-Egger methods
473
having less power than IVW and MLE. Irrespective of such factors our study had only had
474
80% power to detect ORs of 1.16, 1.09, 1.16 and 1.22 for asthma and hay fever, atopic
475
dermatitis, IgE level and self-reported allergy respectively (
Additional file 5: Table S4
). This
476
is a result of the very low proportion of variability in the atopy-related traits explained by
477
the SNPs used. Hence, we cannot exclude the possibility that these traits influence glioma
478
risk, albeit modestly. To explore this possibility will require additional IVs and larger sample
479
sizes affording increased power. Furthermore, it is possible that an effect of atopy on glioma
480
risk might be mediated through mechanisms associated with a trait that we have not
481
captured by using MR to assess asthma and hay fever, and self-reported allergy. Secondly, a
482
weakness of the two-sample MR strategy is that it does not allow examination of non-linear
483
relationships between exposures and outcomes. Finally, we have sought to examine
484
whether bias could be introduced when considering a binary exposure for a binary outcome.
485
Although in our simulation study we found no evidence of bias when estimating non-causal
21
relationships, we did not extend our analysis to consider the potential impact of invalid
487
SNPs.
488
489
490
491
492
493
494
495
496
497
498
499
500
501
502
503
504
505
506
507
508
509
510
22
CONCLUSIONS
512
513
In conclusion, our investigation does not provide strong evidence for a relationship between
514
atopy-related diseases and risk of developing glioma, but findings do not preclude a small
515
effect for atopic dermatitis. Our analysis also serves to illustrate the value of using several
516
MR methods to derive robust conclusions.
517
518
519
520
521
522
523
524
525
526
527
528
529
530
531
532
533
534
535
23
LIST OF ABBREVIATIONS
537
538
CI: Confidence interval
539
GBM: Glioblastoma
540
GICC: Glioma International Case-Control Consortium Study
541
GWAS: Genome-wide association study
542
IV: Instrumental variable
543
IVW: Inverse-variance weighted
544
MBE: Mode-based estimate
545
MLE: Maximum likelihood estimation
546
MR: Mendelian randomization
547
OR: Odds ratio
548
SE: Standard error
549
SNP: Single nucleotide polymorphism
550
WHO: World Health Organization
551
WME: Weighted median estimate
552
553
554
555
556
557
558
559
560
24
DECLARATIONS
562
Ethics approval and consent to participate
563
Two-sample MR was undertaken using GWAS data. Ethical approval was not sought for this
564
specific project because all data came from the summary statistics of published GWAS, and
565
no individual-level data were used.
566
567
Consent for publication
568
Not applicable
569
570
Availability of data and material
571
Genotype data from the GICC GWAS are available from the database of Genotypes and
572
Phenotypes (dbGaP) under accession phs001319.v1.p1. Additionally, genotypes from the
573
GliomaScan GWAS can be accessed through dbGaP accession phs000652.v1.p1.
574
575
Competing interests
576
The authors declare that they have no competing interests
577
578
Funding
579
L D-H was supported by a Wellcome Trust Summer Student bursary. A.S. is supported by a
580
Cancer Research UK clinical Fellowship. In the UK, funding was provided by Cancer Research
581
UK (C1298/A8362) supported by the Bobby Moore Fund. The GICC was supported by grants
582
from the National Institutes of Health, Bethesda, Maryland (R01CA139020, R01CA52689,
583
P50097257, P30CA125123). The UK Interphone Study was supported by the European
584
Commission Fifth Framework Program “Quality of Life and Management of Living
585
Resources” and the UK Mobile Telecommunications and Health Programme. The Mobile
25
Manufacturers Forum and the GSM Association provided funding for the study through the
587
scientifically independent International Union against Cancer (UICC).
588
589
Author contributions
590
R.S.H. and A.J.C. managed the project. L.D-H., A.J.C., A.S., P.J.L. and R.S.H. drafted the
591
manuscript. L.D-H. and A.J.C. performed statistical analyses. B.K., K.L., M.J.S. and R.H.S.
592
acquired and analysed the U.K. data. M. Simon, P.H., M.M.N. and K.-H.J. acquired and
593
analysed the German data. D.I.J., Q.T.O., J.E.E.-P., G.N.A., E.B.C., D.I., J.S., J.S.B.-S., S.H.O.,
594
J.L.B., R.K.L., C.J., R.B.J., B.S.M., M.R.W., M.L.B. and R.S.H. acquired and analysed the GICC
595
data. S.C. and P.R. acquired and analysed the National Cancer Institute (NCI) data. M.
596
Sanson acquired and analysed the French data. All authors reviewed the final manuscript.
597
598
Acknowledgements
599
Not applicable
600
601
602
603
604
605
606
607
608
609
610
26
612
Table 1: Variant and effect allele with frequencies and magnitude of effect on each
atopy-613
related trait and strength of association with glioma
614
615
Region SNP Position (bp)* Alleles** MAF Hay Fever and Asthma Glioma
OR (95% CI) OR (95% CI)
2q12.1 rs10197862 102966549 G/A G=0.161 1.24 (1.16-1.32) 0.98 (0.93−1.03) 4p14 rs4833095 38799710 C/T T=0.425 1.20 (1.14-1.26) 1.03 (0.99−1.08) 5q22.1 rs1837253 110401872 T/C T=0.382 1.17 (1.11-1.23) 0.96 (0.93−1.00) 8q21.13 rs7009110 81291879 C/T C=0.467 1.14 (1.09-1.19) 0.98 (0.94−1.01) 9p24.1 rs72699186 6175855 A/T T=0.110 1.26 (1.17-1.36) 0.97 (0.93−1.02) 11q13.5 rs2155219 76299194 G/T G=0.468 1.17 (1.13-1.21) 1.01 (0.97−1.05) 15q22.33 rs17294280 67468285 A/G G=0.120 1.18 (1.12-1.25) 0.98 (0.94−1.03) 16p13.13 rs62026376 11228712 T/C T=0.144 1.17 (1.11-1.23) 0.97 (0.93−1.01) 17q21.1 rs7212938 38122680 T/G G=0.473 1.16 (1.11-1.22) 1.00 (0.97−1.04)
616
Region SNP Position* Alleles** MAF Atopic Dermatitis Glioma
OR (95% CI) OR (95% CI)
1q21.3 rs11205006 152440176 T/A A=0.265 1.62 (1.48-1.77) 0.96 (0.91−1.02) 1q21.3 rs2228145 154426970 A/C C=0.293 1.15 (1.10-1.20) 0.99 (0.96−1.03) 2p25.1 rs10199605 8495097 A/G A=0.244 1.04 (1.03-1.06) 1.01 (0.97−1.05) 2p13.3 rs112111458 71100105 G/A G=0.224 1.08 (1.05-1.10) 0.98 (0.92−1.03) 2q24.3 rs6720763 167992286 T/C C=0.320 1.29 (1.18-1.41) 1.02 (0.97−1.06) 5p13.2 rs10214237 35883734 C/T C=0.176 1.06 (1.05-1.08) 0.98 (0.94−1.02) 5q31.1 rs1295686 131995843 C/T T=0.422 1.35 (1.22-1.49) 0.99 (0.95−1.03) 6p21.32 rs12153855 32074804 T/C C=0.125 1.58 (1.40-1.78) 0.97 (0.92−1.03) 8q21.13 rs6473227 81285892 A/C A=0.473 1.06 (1.05-1.08) 0.98 (0.94−1.02) 9p21.3 rs10738626 22373457 C/T C=0.397 1.23 (1.15-1.32) 0.96 (0.93−1.00) 10p15.1 rs6602364 6038853 G/C G=0.492 1.05 (1.03-1.07) 1.03 (0.99−1.07) 11q13.1 rs10791824 65559266 A/G G=0.490 1.15 (1.12-1.19) 0.99 (0.95−1.02) 11q24.3 rs7127307 128187383 C/T C=0.488 1.09 (1.07-1.11) 0.99 (0.95−1.03) 11q13.5 rs7130588 76270683 G/A G=0.216 1.29 (1.20-1.38) 1.02 (0.98−1.06) 14q13.2 rs2143950 35572357 C/T T=0.215 1.08 (1.06-1.10) 1.01 (0.97−1.06) 16p13.13 rs2041733 11229589 C/T T=0.496 1.09 (1.06-1.11) 0.97 (0.94−1.01) 19p13.2 rs2164983 8789381 C/A A=0.169 1.16 (1.10-1.22) 0.95 (0.90−1.00) 20q13.33 rs909341 62328742 T/C T=0.262 1.32 (1.21-1.44) 1.32 (1.26−1.37)
617
Region SNP Position* Alleles** MAF IgE level*** Glioma
OR (95% CI) OR (95% CI)
1q23.2 rs2251746 159272060 C/T C=0.015 1.09 (1.08-1.11) 0.98 (0.95−1.02) 5q31.1 rs20541 131995964 A/G A=0.270 1.08 (1.06-1.10) 1.01 (0.97−1.06) 6p22.1 rs2571391 29923838 C/A C=0.303 1.06 (1.05-1.08) 0.97 (0.94−1.01) 6p21.32 rs2858331 32681277 A/G G=0.490 1.04 (1.03-1.06) 1.02 (0.98−1.06) 12q13.3 rs1059513 57489709 C/T C=0.070 1.13 (1.09-1.17) 0.97 (0.92−1.03)
618
Region SNP Position* Alleles** MAF Self-reported allergy Glioma
OR (95% CI) OR (95% CI)
27
* NCBI build 37; ** Reference allele/effect allele; *** per standard deviation; MAF= minor
619
allele frequency; OR= odds ratio
620
Table 2: IVW, MLE, WME, MBE and MR-Egger test results for combined atopy-related
621
instrumental variables
622
623
Trait IVW MLE WME MBE MR-Egger slope MR-Egger intercept
OR (95% CI) P OR (95% CI) P
OR (95% CI) P
OR (95% CI) P OR (95% CI) P Estimate (95% CI) P
Asthma and hay fever
0.96 (0.90-1.03) 0.248 0.96 (0.93-1.00) 0.066 0.93 (0.86-1.01) 0.087 0.91 (0.80-1.04) 0.191 0.99 (0.72-1.36) 0.951 -0.007 (-0.030-0.016) 0.542
Atopic
dermatitis 0.96 (0.93-1.00) 0.041 0.96 (0.94-0.99) 0.003 0.96 (0.91-1.01) 0.114 0.97 (0.92-1.02) 0.194 0.97 (0.92-1.03) 0.375 0.004 (-0.014-0.006) 0.396 IgE level 0.88 (0.69-1.13) 0.319 0.88 (0.74-1.05) 0.157 0.83 (0.61-1.12) 0.218 0.82 (0.57-1.19) 0.355 0.63 (0.32-1.25) 0.184 0.027 (0.001-0.053) 0.042
Self-reported
allergy
1.03 (0.95-1.11) 0.534 1.02 (0.97-1.08) 0.429 1.08 (0.97-1.20) 0.184 1.12 (0.92-1.36) 0.275 0.92 (0.69-1.22) 0.540 0.017 (0.003-0.031) 0.018
624
IVW= inverse variance weighted; MLE= maximum likelihood estimation; WME= weighted
625
median estimate; MBE= mode-based estimate
626
627
628
629
630
631
632
633
634
635
636
637
638
28
Figure 1: Forest plot of Wald ORs and 95% confidence intervals generated from SNPs
640
associated with atopy-related traits.
ORs for individual SNPs are listed according to
641
magnitude of effect in the instrumental variable analysis and are presented with pooled
642
effects using the IVW method. Squares represent the point estimate, and the bars are the
643
95% confidence intervals. (a) Asthma and hay fever, (b) atopic dermatitis, (c) IgE level, (d)
644
self-reported allergy.
645
646
647
SNP rs7009110 rs62026376 rs1837253 rs17294280 rs7212938 rs10197862 rs2155219 rs4833095 rs72699186 Meta0.8 0.9 1 1.1 1.2 1.3
OR OR (95%CI) 0.89 (0.73−1.08) 0.86 (0.72−1.03) 0.85 (0.71−1.02) 0.93 (0.78−1.11) 1.06 (0.89−1.25) 0.95 (0.80−1.12) 1.05 (0.90−1.24) 1.13 (0.97−1.33) 0.92 (0.80−1.06) 0.96 (0.90−1.03) I2 = 28%
Ph et = 0.2
SNP rs10199605 rs112111458 rs6602364 rs10214237 rs2143950 rs6473227 rs7127307 rs2041733 rs2164983 rs10791824 rs2228145 rs6720763 rs10738626 rs1295686 rs7130588 rs12153855 rs11205006 Meta
0.60.8 1 1.21.41.61.8 2 OR OR (95%CI) 1.23 (0.63−2.40) 0.80 (0.47−1.36) 1.48 (0.89−2.48) 0.81 (0.52−1.27) 1.13 (0.74−1.72) 0.79 (0.52−1.19) 0.91 (0.66−1.24) 0.79 (0.58−1.06) 0.78 (0.62−0.99) 0.94 (0.78−1.12) 0.96 (0.80−1.15) 1.04 (0.92−1.18) 0.88 (0.78−0.99) 0.98 (0.88−1.08) 1.05 (0.95−1.16) 0.96 (0.88−1.05) 0.95 (0.88−1.03) 0.96 (0.93−1.00) I2 = 8%
Ph et = 0.37
SNP rs9303280 rs962993 rs17228058 rs6021270 rs17388568 rs9860547 rs7720838 rs10497813 rs9266772 rs7032572 rs2155219 rs10189699 rs1438673 rs2101521 Meta
0.8 1 1.2 1.4 1.6 OR OR (95%CI) 0.93 (0.63−1.38) 1.21 (0.82−1.78) 0.99 (0.67−1.45) 1.07 (0.75−1.52) 1.08 (0.76−1.54) 1.20 (0.87−1.66) 1.21 (0.87−1.67) 0.94 (0.69−1.30) 1.19 (0.87−1.62) 0.85 (0.63−1.13) 1.08 (0.85−1.38) 0.95 (0.75−1.21) 0.84 (0.68−1.05) 1.12 (0.90−1.38) 1.03 (0.95−1.11) I2= 0%
Ph et = 0.7 SNP rs2858331 rs2571391 rs20541 rs1059513 rs2251746 Meta
0.60.8 1 1.21.41.6 1.8 2 OR
OR (95%CI) 1.41 (0.74−2.69) 0.73 (0.47−1.14) 1.09 (0.74−1.61) 0.84 (0.60−1.18) 0.89 (0.65−1.21)
0.88 (0.69−1.13)
I2 = 0% Ph et = 0.44
(a) (b)
29
Figure 2: Plot of
P
value of MLE associations with glioma against correlation between
648
errors in
Xk
and
Yk
.
(a) Asthma and hay fever, (b) atopic dermatitis, (c) IgE level, (d)
self-649
reported allergy.
650
651
0.16 0.17 0.18 0.19
-0.2 0.0 0.2
Correlation
P
0.04
0.06
0.08
0.10
-0.2 0.0 0.2
Correlation
P
(a) (b)
(c) (d)
0.33
0.35
0.37 0.39 0.41
-0.2 0.0 0.2
Correlation
P
0.003 0.004
0.005
0.006 0.007
0.008
-0.2 0.0 0.2
Correlation
30
Figure 3: Scatter plots of genetic associations with glioma against genetic associations
652
with the exposure.
(a) Asthma and hay fever, (b) atopic dermatitis, (c) IgE level, (d)
self-653
reported allergy
.
654
655
-0.04 -0.02
0.00
0.02
0.00 0.05 0.10 0.15 0.20
βAsthma and hay fever βG
lio
ma IVW
MR-EGGER
-0.03
-0.02 -0.01
0.00 0.01
0.02
0.000 0.025 0.050 0.075 0.100 0.125 βIgE
βG
lio
ma IVW
MR-EGGER
-0.03
-0.02 -0.01 0.00 0.01 0.02
0.00 0.05 0.10 0.15
βSelf-reported Allergy βG
lio
ma IVW
MR-EGGER -0.04
-0.02
0.00
0.02
0.0 0.1 0.2 0.3 0.4 0.5
βAtopic Dermatitis
βG
lio
ma IVW
MR-EGGER
(c) (d)
31