Open Access
Research article
Comparative genomics in chicken and Pekin duck using FISH
mapping and microarray analysis
Benjamin M Skinner
1, Lindsay BW Robertson
1,2, Helen G Tempest
1,3,
Elizabeth J Langley
1, Dimitris Ioannou
1, Katie E Fowler
1,
Richard PMA Crooijmans
4, Anthony D Hall
5, Darren K Griffin*
†1and
Martin Völker
†1Address: 1Department of Biosciences, University of Kent, Canterbury, CT2 7NJ, UK, 2Institute of Cancer Research, Belmont, Surrey, SM2 5NG, UK, 3Bridge Genoma, 1 St Thomas Street, London Bridge, London, SE1 9RY, UK, 4Animal Breeding and Genomics Centre, Wageningen University,
Marijkeweg 40, 6709 PG Wageningen, The Netherlands and 5Cherry Valley Ltd, Rothwell, Market Rasen, Lincolnshire, LN7 6BJ, UK
Email: Benjamin M Skinner - [email protected]; Lindsay BW Robertson - [email protected];
Helen G Tempest - [email protected]; Elizabeth J Langley - [email protected]; Dimitris Ioannou - [email protected]; Katie E Fowler - [email protected]; Richard PMA Crooijmans - [email protected]; Anthony D Hall - [email protected]; Darren K Griffin* - [email protected]; Martin Völker - [email protected]
* Corresponding author †Equal contributors
Abstract
Background: The availability of the complete chicken (Gallus gallus) genome sequence as well as a large number of chicken probes for fluorescent in-situ hybridization (FISH) and microarray resources facilitate comparative genomic studies between chicken and other bird species. In a previous study, we provided a comprehensive cytogenetic map for the turkey (Meleagris gallopavo) and the first analysis of copy number variants (CNVs) in birds. Here, we extend this approach to the Pekin duck (Anas platyrhynchos), an obvious target for comparative genomic studies due to its agricultural importance and resistance to avian flu.
Results: We provide a detailed molecular cytogenetic map of the duck genome through FISH assignment of 155 chicken clones. We identified one inter- and six intrachromosomal rearrangements between chicken and duck macrochromosomes and demonstrated conserved synteny among all microchromosomes analysed. Array comparative genomic hybridisation revealed 32 CNVs, of which 5 overlap previously designated "hotspot" regions between chicken and turkey.
Conclusion: Our results suggest extensive conservation of avian genomes across 90 million years of evolution in both macro- and microchromosomes. The data on CNVs between chicken and duck extends previous analyses in chicken and turkey and supports the hypotheses that avian genomes contain fewer CNVs than mammalian genomes and that genomes of evolutionarily distant species share regions of copy number variation ("CNV hotspots"). Our results will expedite duck genomics, assist marker development and highlight areas of interest for future evolutionary and functional studies.
Published: 5 August 2009
BMC Genomics 2009, 10:357 doi:10.1186/1471-2164-10-357
Received: 18 March 2009 Accepted: 5 August 2009
This article is available from: http://www.biomedcentral.com/1471-2164/10/357
© 2009 Skinner et al; licensee BioMed Central Ltd.
Background
Comparative genomics allows the transfer of genomic information from a well-characterized species to another that is less well described. It can be applied at all levels from that of the chromosome to the genome sequence. However, despite the recent advances in sequencing tech-nologies, the considerable effort involved in producing a genome sequence assembly is reflected by the small number of vertebrate genomes that have been sequenced to date. In birds, there is only one published genome sequence, that of the chicken [1], with the zebra finch genome due to be published soon.
Combining cross-species fluorescent in-situ hybridization (FISH) and microarray analysis using resources developed in the chicken provides a powerful tool for the identifica-tion of gross genomic rearrangements, gene gains/losses, copy number variants (CNVs) and gene order in other bird species. These techniques do not require sequence data for any species other than the reference (i.e. chicken). We have previously successfully used this approach for a genome wide comparison of chromosomal rearrange-ments and CNVs between chicken and turkey[2]. This revealed a strong conservation of genome structure over about 30 million years of evolution between chicken and turkey[3]. In particular, our results suggested that, when compared to mammalian genomes, bird genomes contain a low number of CNVs (i.e. polymorphisms in the number of copies of a DNA fragment 1 kb or larger[4], with the exception of insertions or deletions of transposa-ble elements[5]). The latter finding indicates that patterns of CNVs in bird genomes mirror the low number of chro-mosomal rearrangements in this phylogenetic group[2,6].
Following on from the turkey, the Pekin duck (Anas platy-rhynchos, APL) is the next obvious target among domestic birds for detailed genomic studies due to its agricultural importance, with worldwide duck consumption being between 4 and 5% of the total poultry market[7]. Duck is also an important target for immunological studies because of its resistance to avian influenza[8]. Despite this, genomic information about the duck is limited to a few linkage and physical mapping studies. Huang et al. [9] produced a preliminary genetic map based on 240 micro-satellite loci and assigned 11 out of 19 linkage groups to ten duck (APL) chromosomes by FISH mapping of 28 BACs. Cross-species chromosome painting and G-band-ing studies [10-12] have suggested one interchromosomal difference between the chicken and duck karyotypes – the ancestral chromosomes 4 and 10, fused in the chicken lin-eage to give GGA4q and GGA4p respectively, remain sep-arate in duck[6]. This interchromosomal rearrangement presumably explains the difference in diploid chromo-some number between the two species, which is 2n = 78 in chicken and 2n = 80 in duck. FISH mapping of 57
chicken BACs revealed small intrachromosomal rear-rangements in APL2, 7, 8 and Z and confirmed synteny for GGA9, 11, 13–15, 18 and 28 in the duck genome[13]. However, no molecular markers are available for the remaining microchromosomes, which are indistinguisha-ble by conventional cytogenetics. It is also unclear which duck chromosome corresponds to GGA4p (ancestral chromosome 10). Thus, from a molecular cytogenetic standpoint, the duck genome is at present only partially defined, and given the low number of physical markers mapped by FISH, it is possible that hitherto undetected intrachromosomal rearrangements exist.
No data are currently available concerning CNVs in duck or indeed any other bird species than chicken and turkey. CNVs have been found to contribute significantly to nor-mal and disease-related genetic and phenotypic variation in humans and other primates[5,14]. Studies of the evolu-tionary significance of CNVs have largely focused on pri-mates and revealed numerous lineage-specific gene gains and losses and CNVs (e.g. [15-20]).
Our previous study of CNVs in chicken and turkey revealed a total of 16 CNVs[2]. Five of these CNVs appear to be shared in layer and broiler chickens, and in turkey, at regions dubbed "CNV hotspots" (i.e. genomic regions in which CNVs of approximately equal size were found in both chicken breeds and in turkey). Given that the contri-bution of CNVs to phenotypic variation is becoming increasingly clear, analyses of this kind of structural varia-tion in organismic groups other than mammals are clearly needed.
Here, we present a detailed molecular cytogenetic map for the duck based on comparative FISH mapping of 155 chicken BACs, which revealed several hitherto unde-scribed intrachromosomal rearrangements. We also pro-vide an analysis of CNVs in the duck genome by array comparative genomic hybridisation (array CGH) of duck DNA to a commercially available chicken whole-genome oligonucleotide tiling path microarray. The analysis of CNVs supports the hypotheses that bird genomes contain fewer CNVs than mammalian genomes and that some CNVs appear to be consistently shared across species, forming CNV hotspots.
Results
Comparative FISH mapping between chicken and duck
Addi-Comparative map of chicken and duck chromosomes 1–8 and Z Figure 1
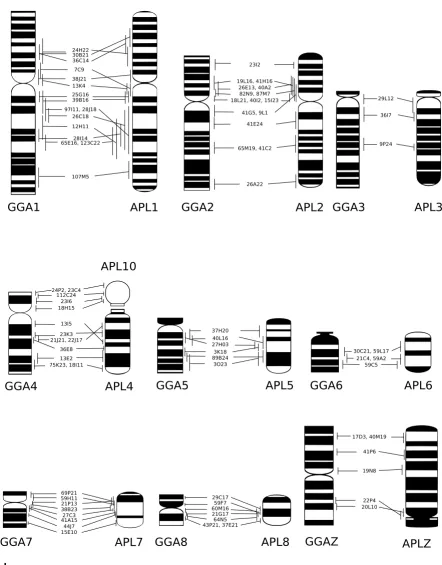
Comparative map of chicken and duck chromosomes 1–8 and Z. The G-banded ideograms of chicken (Gallus gallus; GGA) and duck (Anas platyrhynchos; APL) chromosomes 1–8 and Z are shown with the positions of all BACs successfully hybridized to both species as determined by FLpter measurements. Intrachromosomal rearrangements can be seen on GGA and APL1, 2, 4, 7, 8 and Z. GGA4p corresponds to APL10. Note the orientation of APLZ. Ideograms were prepared from[13,21]. Error bars represent one standard deviation.
tional file 1. Figure 2 shows example FISH results. Only one interchromosomal difference was detected among the macrochromosomes, the retention of the ancestral chro-mosomes 4 and 10 in duck (which are fused in chicken).
FISH mapping suggested intrachromosomal rearrange-ments on GGA1, 2, 4, 7, 8, Z and APL1, 2, 4, 7, 8 and Z. BACs WAG24H22, WAG30B21 and WAG36C14 clearly showed a rearrangement on GGA1p and APL1p. The order of BACs was not completely inverted, suggesting that the underlying rearrangement may be a translocation rather than a paracentric inversion. BACs WAG7C9 and WAG13K4 (Figure 2A, B) mapped to GGA1p and APL1q, indicating a small pericentric inversion. Besides, some BACs mapping to GGA1q and APL1q suggested possible rearrangements on these chromosome arms; however, the high standard deviations in the FLpter measurements determined for these BACs in duck made it difficult to dis-tinguish artefacts from real changes in marker order.
BACs WAG42G5 and WAG9L1 mapped to GGA2q and APL2p, providing clear evidence of a pericentric inversion. However, BAC WAG18G1, which mapped close to the centromere on GGA2p, also hybridized close to the cen-tromere in APL2p. This demonstrated that the inversion involves only a small fraction of 2p.
BACs WAG13I5, WAG23K3, WAG21J21 AND WAG22J17 clearly demonstrated a paracentric inversion on GGA4q and APL4 (example image of WAG13I5 in Figure 2C, D).
The morphological differences between GGA7 and APL7 were reflected in a change in marker order involving BACs WAG69P21, WAG59H11 and WAG21P13. However, like in the rearrangement on GGA1p and APL1p, marker order was not completely inverted, indicating that this rear-rangement may be more complex than a simple pericen-tric inversion. Similarly, our FISH mapping results did not provide clear evidence for a pericentric inversion causing the morphological differences between GGA8 and APL8.
Marker order on GGAZ and APLZ chromosome was largely conserved, with the possible exception of a small inversion involving BACs WAG22P4 and WAG20L10. Thus, it seems that the morphological differences between the metacentric GGAZ and the subtelocentric APLZ are due to neocentromere formation rather than a pericentric inversion.
Dual-color FISH experiments with BACs mapping to either end of a microchromosome were used to check for conserved synteny among the microchromosomes. This demonstrated conserved synteny for APL9, 11, 14–16, 19, 21, 27–29. The BACs successfully hybridized to the micro-chromosomes are listed in Additional file 2; example results are shown in Figure 2E, F.
FISH mapping of BACs WAG112C24 and WAG23I06 facilitated the identification of the duck orthologue of GGA4p. Chromosome area measurements suggested that this chromosome should be numbered as APL10. There were no major differences in size order between the remaining microchromosomes and their chicken ortho-logues.
Copy number variation between chicken and duck
Hybridisation of genomic DNA from two female ducks to the Nimblegen chicken whole genome tiling path micro-array revealed 32 CNVs, of which ten were seen in both
individuals (CNVs marked with a in Table 1). Both gains
and losses relative to chicken were seen (8 gains and 24 losses). The mean and median lengths of the detected CNVs were 281 kb and 50 kb respectively, ranging from 2.8 kb to 4.4 Mb. The CNV locations were compared with those previously found in turkey and chicken broilers and layers[2]. Six CNVs overlapped with CNVs identified in turkey, and of these five CNVs matched the five potential CNV 'hotspots' described by Griffin et al. [2] (bolded in Table 1). Three of the 'hotspot' CNVs were seen in both ducks. Known or predicted genes were found to be associ-ated with 22 of the 32 CNVs (68.75%). In the ten cases where no genes were associated, all were losses, and all except one were found either near to the beginning or end of the chromosome (between 2 bp and 4 Mb of the sequence start or end according to Ensembl, http:// www.ensembl.org/Gallus_gallus). The exception, CNV#14, covered a sequence gap, which likely contains centromeric repeats. Two of the CNVs, #7 and #9, were in regions that are potentially involved in rearrangements on GGA7 and 8 respectively.
Discussion
Comparative cytogenetic map of the duck genome
from repetitive content, especially on the macrochromo-somes, accounting for our wider error bars when assigning positions to BACs on these chromosomes.
In agreement with previous studies, no other interchro-mosomal rearrangements were detected between chicken and duck. However, our BAC mapping data are consistent with intrachromosomal rearrangements distinguishing chromosomes GGA1, 2, 4, 7, 8, Z and APL1, 2, 4, 7, 8 and Z, which confirms and expands on previous findings[13]. The detection of additional rearrangements on GGA1 and APL1 and GGA4q and APL4 was due to the much higher
number of BACs hybridized in this study compared to previous studies. Likewise, higher density mapping dem-onstrated that the morphological differences between GGAZ and APLZ are probably due to the formation of a neocentromere rather than a pericentric inversion. This type of chromosomal rearrangement was previously reported in birds only for the red-legged partridge [23] and the Japanese quail[24]. However, despite the good coverage of the duck cytogenetic map presented here, it was not possible to determine unequivocally the nature of all chromosomal rearrangements observed between chicken and duck. It seems likely however that, in addi-tion to peri- and paracentric inversions and neocentro-mere formation, translocations contributed to avian genome evolution. This conclusion is based on the order of BACs associated with rearrangements on GGA1, 7 and 8 and APL1, 7 and 8, which is not entirely consistent with the order expected if the rearrangements were inversions. Thus, it appears that while the available data from com-parative FISH mapping suggest a relatively low frequency of intrachromosomal rearrangements in the evolution of bird genomes, the underlying processes may be more diverse than previously appreciated. Undoubtedly, the higher resolution afforded by genome sequencing projects such as that of the zebra finch will help to resolve this question.
The evolutionary direction of intrachromosomal changes could be determined for GGA8 and APL8 only. Compari-son with the turkey map [2] suggested that APL8 likely represents the ancestral state; the order of BACs on turkey chromosome 10 (ancestral chromosome 8) and the mor-phology of this chromosome is the same as in duck, indi-cating that the rearrangement has occurred in the chicken lineage. Due to a lack of comparative data, it was not pos-sible to determine the polarity of the remaining intrachro-mosomal rearrangements. If BAC positions are compared between this map and the turkey map (Additional file 1, [2]), the differences fit the patterns expected from the pre-viously described inter- and intra-chromosomal rear-rangements.
Among the rearrangements that we detected, the inversion observed in GGA4q and APL4 is of particular interest. Morphological differences in GGA4 have been described between different chicken breeds[25], and the ancestral bird chromosome 4 (corresponding to GGA4q and APL4, respectively) is also one of the chromosomes most prone to convergent independent fusions in birds (with ances-tral chromosome 10) [6]. This contrasts with the con-served synteny of the ancestral bird chromosome 4 (corresponding to GGA4q and APL4, respectively) in humans. Together, the data suggest that rearrangements in chromosome 4 may be more common than has been sus-pected from previous comparative genomic studies, and Example FISH Results
Figure 2
Example FISH Results. BAC WAG13K4 on A) chicken (Gallus gallus; GGA) chromosome 1p and B) duck (Anas
platy-rhynchos; APL) chromosome 1q. BAC WAG13I5 on C)
chicken chromosome 4q and D) duck chromosome 4 dem-onstrating part of the evidence that led us to deduce a para-centric inversion. Conserved synteny among the
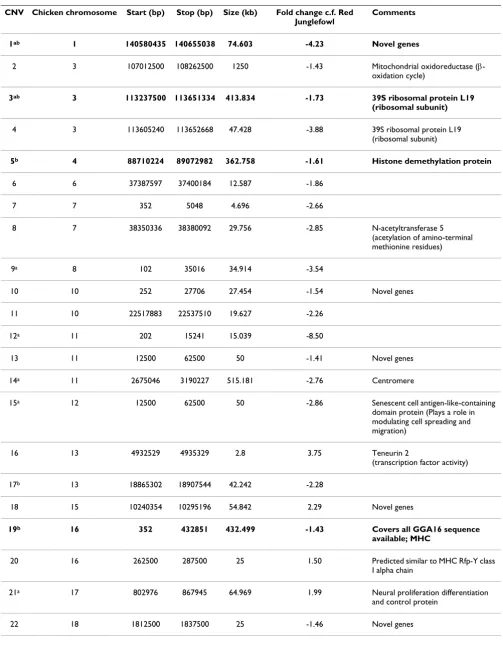
Table 1: CNVs detected in duck (Anas platyrhynchos) relative to chicken reference DNA.
CNV Chicken chromosome Start (bp) Stop (bp) Size (kb) Fold change c.f. Red Junglefowl
Comments
1ab 1 140580435 140655038 74.603 -4.23 Novel genes
2 3 107012500 108262500 1250 -1.43 Mitochondrial oxidoreductase (β-oxidation cycle)
3ab 3 113237500 113651334 413.834 -1.73 39S ribosomal protein L19
(ribosomal subunit)
4 3 113605240 113652668 47.428 -3.88 39S ribosomal protein L19 (ribosomal subunit)
5b 4 88710224 89072982 362.758 -1.61 Histone demethylation protein
6 6 37387597 37400184 12.587 -1.86
7 7 352 5048 4.696 -2.66
8 7 38350336 38380092 29.756 -2.85 N-acetyltransferase 5 (acetylation of amino-terminal methionine residues)
9a 8 102 35016 34.914 -3.54
10 10 252 27706 27.454 -1.54 Novel genes
11 10 22517883 22537510 19.627 -2.26
12a 11 202 15241 15.039 -8.50
13 11 12500 62500 50 -1.41 Novel genes
14a 11 2675046 3190227 515.181 -2.76 Centromere
15a 12 12500 62500 50 -2.86 Senescent cell antigen-like-containing domain protein (Plays a role in modulating cell spreading and migration)
16 13 4932529 4935329 2.8 3.75 Teneurin 2
(transcription factor activity)
17b 13 18865302 18907544 42.242 -2.28
18 15 10240354 10295196 54.842 2.29 Novel genes
19b 16 352 432851 432.499 -1.43 Covers all GGA16 sequence
available; MHC
20 16 262500 287500 25 1.50 Predicted similar to MHC Rfp-Y class I alpha chain
21a 17 802976 867945 64.969 1.99 Neural proliferation differentiation and control protein
analyzing them will prove valuable for understanding avian and other vertebrate genome evolution.
The present study extended the data previously available for conserved synteny among the microchromosomes. Fil-lon et al. [13]demonstrated conserved synteny for seven microchromosome pairs (APL9, 12, 14–16, 19, 29); here we demonstrate conserved synteny for ten microchromo-some pairs (APL9, 11, 14–16, 19, 21, 27–29). The lack of detected rearrangements makes it reasonable to suggest that there are very few, if any, rearrangements among the remaining microchromosomes – including the as-yet unexamined smallest microchromosomes for which no markers exist. Indeed, no sequence data from the chicken genome has yet been assigned to these smallest chromo-somes, and it is still unclear why, although there is a sug-gestion that there may be a cloning or sequencing bias against microchromosomal sequences[26]. Data on con-served microchromosomal synteny in other bird species are restricted to the Japanese quail (Coturnix japonica[27]) and the turkey[2]. Despite the paucity of data, the emerg-ing picture is one of remarkable conservation among most avian species, with the exception of a few groups where large-scale interchromosomal rearrangements are com-mon (such as the Falconiformes or Psittaci-formes[28,29]).
The detailed cytogenetic map allowed for an improved definition of the duck karyotype. Chromosome banding and macrochromosome painting studies had previously shown orthology of APL1–9 and Z to GGA1–3, 4q, 5–9 and Z [10-12]. However, it was not known which duck chromosome corresponded to chicken chromosome 4p;
Fillon et al. [13]suggested that this was approximately
APL10–13. In this study we have used a combination of BAC mapping and chromosome area measurements which suggest that this chromosome should be numbered as APL10. Moreover we found no evidence for rearrange-ments among the microchromosomes. Accordingly, we propose that duck chromosomes be numbered as per chicken for 1–9; that APL10 corresponds to GGA4p; then GGA10 onwards correspond to APL11 onwards. The suc-cessful hybridization of at least one BAC from GGA1–28 (except 25) means markers are now available for APL1–29 (except 26) and Z. Taken together, these results enabled us to define unequivocally chromosomes APL1–29.
Copy number variation between chicken and duck
The purpose of our array CGH experiments was to test two of our earlier hypotheses: (i) that birds show a reduced number of CNVs compared to mammals, (ii) that genomic CNV hotspots described previously in chicken and turkey [2] are found in the duck as well (indicating
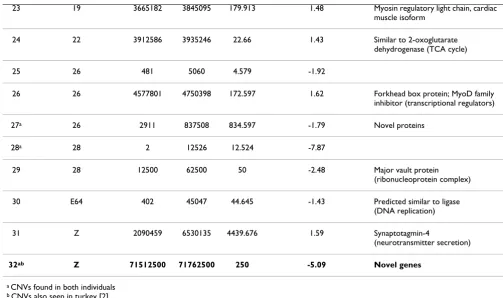
23 19 3665182 3845095 179.913 1.48 Myosin regulatory light chain, cardiac muscle isoform
24 22 3912586 3935246 22.66 1.43 Similar to 2-oxoglutarate dehydrogenase (TCA cycle)
25 26 481 5060 4.579 -1.92
26 26 4577801 4750398 172.597 1.62 Forkhead box protein; MyoD family inhibitor (transcriptional regulators)
27a 26 2911 837508 834.597 -1.79 Novel proteins
28a 28 2 12526 12.524 -7.87
29 28 12500 62500 50 -2.48 Major vault protein (ribonucleoprotein complex)
30 E64 402 45047 44.645 -1.43 Predicted similar to ligase (DNA replication)
31 Z 2090459 6530135 4439.676 1.59 Synaptotagmin-4
(neurotransmitter secretion)
32ab Z 71512500 71762500 250 -5.09 Novel genes
a CNVs found in both individuals b CNVs also seen in turkey [2]
The 5 CNVs overlapping the 5 potential hotspots from [2] are bolded.
conservation over a large evolutionary distance). The suc-cessful hybridizations that we observed, despite approxi-mately 90 million years of divergence between chicken and duck[31], extend avian cross-species microarray experiments from the sole previous study in turkey[2]. The present study revealed a total of 32 CNVs in the duck when compared to the chicken, which is substantially fewer than the 58 CNVs discovered in a comparison of human and chimpanzee[31], which diverged only 6–7 million years ago[32]. While this result supports the hypothesis that bird genomes show fewer CNVs than mammalian ones, it should also be noted that we found twice as many CNVs in duck as were found in the compar-ison of turkey and chicken (32 versus 16) [2]. Only ten of these CNVs were found in both duck specimens exam-ined, indicating substantial intraspecific variation. These findings highlight the need for further studies with larger sample sizes and call for some caution when comparing the frequency of CNVs in birds and mammals.
The comparison of CNVs between chicken breeds and tur-key revealed five tentative CNV hotspots by virtue of the fact that they contained CNVs of similar size in different chicken lines and in turkey[2]. Of these five hotspot regions, three contained CNVs in both ducks and two con-tained CNVs in one duck. The hotspot regions contain a number of novel genes including most of the available sequence for GGA16, covering the MHC loci. Moreover these findings lend support to our avian "CNV hotspot hypothesis" but, of course, need to be confirmed by ana-lysing a wider number of species.
All copy number gains (in duck compared to chicken) were located in coding regions. Genes in regions of copy number gain relative to chicken included transcription factors, neural proliferation control and neurotransmitter activity, and a predicted MHC class I gene. This is consist-ent with previously described duplication of the MHC class I locus in the mallard duck, followed by subsequent inactivation of some of the extra gene copies[33].
Where copy number losses relative to chicken were detected, two possible explanations exist: a true copy number loss, or sequence divergence leading to lack of hybridization on the microarray. If such sequence diver-gence had occurred, however, the loss might be expected in both individuals. This was only seen for 9 CNVs; the remainder are more likely to be true polymorphic copy number differences. However, it is important to note that about two thirds of all apparent copy number losses were observed in coding regions; hence, the observed loss in hybridization efficiency is likely associated with func-tional consequences, regardless of whether it is due to copy number change or sequence divergence. Thus these results highlight genomic regions that are of particular interest for further functional and evolutionary studies.
It has been suggested that segmental duplications are cor-related with CNVs, and facilitate chromosomal rearrange-ments, the lack of segmental duplications in birds therefore explaining the relative paucity of CNVs[1]. Due to the vastly different levels of resolution afforded by cytogenetic mapping and microarray analysis, it is diffi-cult to directly correlate the results of these two methods. Nevertheless, it is interesting to note that two of the CNVs revealed in this paper appear to coincide with rearrange-ments detected from the cytogenetic mapping. These are CNVs #7 and #9, on chromosomes GGA7 and 8 respec-tively. Further studies are necessary to examine this link between chromosomal rearrangements and CNVs in more detail.
Conclusion
The comparative cytogenetic map of the duck presented here highlights the extraordinary conservation seen among the genomes of many bird species, and how little structural genetic variation is readily apparent. The cytoge-netic map will allow the transfer of gecytoge-netic information directly from chicken to duck, expediting mapping studies in the duck and help to target marker development in duck through the prediction of new loci. The combination of area measurements and FISH mapping of chicken BACs allowed the identification of markers for chromosomes APL1–24 and 26–29 which will facilitate further mapping studies in the duck. Moreover, we have extended the anal-ysis of CNVs in birds, providing further evidence that birds have low numbers of CNVs when compared to mammals and that bird genomes contain CNV hotspots. While overall we confirm the evolutionary conservation of bird genomes, the intrachromosomal differences and CNVs found highlight areas of future interest for evolu-tionary and functional studies.
Methods
Cell culture and chromosome preparation
All chromosome preparations were made from cultured cells derived from fertilized eggs. Chicken eggs were sup-plied by Hill Top Farm, Cambridgeshire, UK and Friday's Farm, Kent, UK. Duck eggs were provided by Cherry Val-ley Ltd, Market Rasen, UK. Fibroblast cultures were estab-lished from 5- to 7-day-old embryos. Chromosome preparation followed standard protocols[34,35]: mito-static treatment with colcemid at a final concentration of
0.1 μg/ml for 1 h at 37°C, hypotonic treatment with 75
mM KCl for 15 min at 37°C and fixation with 3:1 metha-nol:acetic acid.
Selection and preparation of BAC clones
proto-cols. At least one BAC was available for GGA1–28 (except 25) and Z. The 155 BACs successfully hybridized to both chicken and duck are detailed in Additional files 1 and 2.
Fluorescent in-situ hybridisation (FISH)
Slides with metaphase preparations were aged for one hour at 70°C on a hotplate then treated with 4 mg/ml RNase A for one hour at 37°C. The chromosomes were denatured for 1 minute 30 seconds in 70% formamide in 2×SSC at 70°C. BACs were applied to slides and sealed under coverslips with rubber cement. Hybridization was carried out in a humidified chamber for 72 hours at 37°C. Following post-hybridization washes (40% or 30% for-mamide in 2×SSC for 20 minutes; 1 minute in 2×SSC/ 0.1% Igepal at RT; 15 minutes in 4×SSC/0.05% Tween 20 at RT; 25 minutes in 4×SSC/0.05% Tween 20/2% BSA at RT), probes were detected with 1:200 streptavidin-Cy3 (Amersham), plus 1:200 FITC-anti-digoxigenin (Amer-sham) for dual-color experiments, in 4×SSC, 0.05% Ige-pal, 1.25% BSA for 35 minutes. Slides were washed in 4×SSC, 0.05% Igepal for 3 × 5 minutes then counter-stained using Vectashield with DAPI (Vector Labs).
Dual-color FISH was used to determine whether there was conserved synteny among the microchromosomes, select-ing BACs that were as close as possible to the ends of the chromosomes. For GGA11, only one hybridizing BAC in duck was available.
Image capturing and analysis
Slides were analyzed on an Olympus BX-61 epifluores-cence microscope equipped with a cooled CCD camera and appropriate filters. Images were captured using Smart-Capture 3 (Digital Scientific UK). The signal positions were measured as the fractional length from the p-termi-nus (FLpter[38]). FLpter and area measurements were car-ried out in ImageJ[39]. The area of duck chromosomes was determined as a ratio of the easily recognized chro-mosome 5, as per[40]. For area measurements, 10 met-aphases were measured per chromosome; the numbers of metaphases used for FLpter measurements are given in Additional file 1.
Array CGH
The NimbleGen chicken whole-genome tiling array (Cat-alogue Number/Design Name B3791001-00-01, galGal3 WG CGH – Roche NimbleGen, Milton Keynes, UK) was used for the array CGH experiments. It contains 385,000 50-mer oligonucleotides with an average spacing of 2,586 base pairs (source – UCSC, build – galGal3) and was interrogated with duck whole genomic DNA extracted from blood from two female ducks using a DNeasy Ani-mal Blood and Tissue kit (Qiagen, #69504); the reference (Red Jungle Fowl) DNA, from the same animal used in the chicken genome sequencing project, was kindly provided
by Dr Hans Cheng (Michigan State University). Labeling of genomic DNA and hybridization to the Roche Nimble-Gen array were performed by the company (Roche Nim-bleGen) and used random priming to incorporate modified nucleotides by either amino-allyl or direct link-age to either of the two dyes used (Cy3 and Cy5). All of the hybridizations in this experiment used two dyes per slide (Cy3 and Cy5). Red Jungle Fowl reference DNA (Cy5) was co-hybridized with duck test DNA (Cy3).
CGH analysis proceeded in three stages, normalization, window averaging and segmentation. After combining the signal intensity and genomic coordinate information, the Cy3 and Cy5 signal intensities were normalized to one another using Qspline normalization[41]. Qspline is a robust non-linear method for normalization using array signal distribution analysis and cubic splines. Once nor-malized, the data was prepared for DNA segmentation analysis. This included a window averaging step, where the probes that fall into a defined base pair window size (25 kb) are averaged, using the Tukey's biweight mean[42]. The Tukey's biweight method yields a robust weighted mean that is relatively insensitive to outliers, even when extreme. A new position was assigned to this average, which is the midpoint of the window. Segmenta-tion was also performed on unaveraged data to permit smaller segments than the window size to be detected. The circular binary segmentation algorithm [43] was used to segment the averaged log2 ratio data. DNA segments were called by attempting to break the segments into sub-segments by looking at the t-statistic of the means. Permu-tations (n = 1000) were used to provide the reference dis-tribution. If the resulting p-value was below the threshold (default of p = 0.01), then a breakpoint was called. A pruning step was used to remove spurious segments, rejecting segments where the standard deviation of the means was not sufficiently different. By default, a cut off of 1.5 standard deviations was used. CNVs were called for segments in which the log2 ratio was greater than | ± 0.5|. Where overlapping CNVs were detected in window aver-aged and unaveraver-aged data, the data were considered to represent a single CNV.
Authors' contributions
Additional material
Acknowledgements
The authors would like to thank Hans Cheng (MSU) for the Red Junglefowl DNA, and the BBSRC and Genesis-Faraday for the project grant which funded this study.
References
1. Hillier LW, Miller W, Birney E, Warren W, Hardison RC, Ponting CP, Bork P, Burt DW, Groenen MA, Delany ME, Dodgson JB, Chinwalla AT, Cliften PF, Clifton SW, Delehaunty KD, Fronick C, Fulton RS, Graves TA, Kremitzki C, Layman D, Magrini V, McPherson JD, Miner TL, Minx P, Nash WE, Nhan MN, Nelson JO, Oddy LG, Pohl CS, Ran-dall-Maher J, Smith SM, Wallis JW, Yang SP, Romanov MN, Rondelli CM, Paton B, Smith J, Morrice D, Daniels L, Tempest HG, Robertson L, Masabanda JS, Griffin DK, Vignal A, Fillon V, Jacobbson L, Kerje S, Andersson L, Crooijmans RP, Aerts J, Poel JJ van der, Ellegren H, Caldwell RB, Hubbard SJ, Grafham DV, Kierzek AM, McLaren SR, Overton IM, Arakawa H, Beattie KJ, Bezzubov Y, Boardman PE, Bon-field JK, Croning MD, Davies RM, Francis MD, Humphray SJ, Scott CE, Taylor RG, Tickle C, Brown WR, Rogers J, Buerstedde JM, Wilson SA, Stubbs L, Ovcharenko I, Gordon L, Lucas S, Miller MM, Inoko H, Shiina T, Kaufman J, Salomonsen J, Skjoedt K, Wong GK, Wang J, Liu B, Yu J, Yang H, Nefedov M, Koriabine M, Dejong PJ, Goodstadt L, Webber C, Dickens NJ, Letunic I, Suyama M, Torrents D, von Mering C, Zdobnov EM: Sequence and comparative analysis of the chicken genome provide unique perspectives on vertebrate evolution. Nature 2004, 432(7018):695-716.
2. Griffin DK, Robertson LB, Tempest HG, Vignal A, Fillon V, Crooij-mans RP, Groenen MA, Deryusheva S, Gaginskaya E, Carre W, Wad-dington D, Talbot R, Volker M, Masabanda JS, Burt DW: Whole genome comparative studies between chicken and turkey and their implications for avian genome evolution. BMC
Genomics 2008, 9:168.
3. Pereira SL, Baker AJ: A molecular timescale for galliform birds accounting for uncertainty in time estimates and heteroge-neity of rates of DNA substitutions across lineages and sites.
Mol Phylogenet Evol 2006, 38(2):499-509.
4. Feuk L, Marshall CR, Wintle RF, Scherer SW: Structural variants: changing the landscape of chromosomes and design of dis-ease studies. Human Molecular Genetics 2006, 15(Spec No 1):R57-66.
5. Freeman JL, Perry GH, Feuk L, Redon R, McCarroll SA, Altshuler DM, Aburatani H, Jones KW, Tyler-Smith C, Hurles ME, Carter NP,
Scherer SW, Lee C: Copy number variation: new insights in genome diversity. Genome Res 2006, 16(8):949-961.
6. Griffin DK, Robertson LB, Tempest HG, Skinner BM: The evolution of the avian genome as revealed by comparative molecular cytogenetics. Cytogenet Genome Res 2007, 117(1–4):64-77. 7. Food and Agriculture Organisation of the United Nations
[http://faostat.fao.org/]
8. Munster VJ, Veen J, Olsen B, Vogel R, Osterhaus AD, Fouchier RA: Towards improved influenza A virus surveillance in migrat-ing birds. Vaccine 2006, 24(44–46):6729-6733.
9. Huang Y, Zhao Y, Haley CS, Hu S, Hao J, Wu C, Li N: A Genetic and Cytogenetic Map for the Duck (Anas platyrhynchos).
Genetics 2006, 173(1):287-296.
10. Denjean B, Ducos A, Darre A, Pinton A, Seguela A, Berland H, Blanc M, Fillon V, Darre R: Caryotype des canards commun (Anas platyrhynchos), Barbarie (Cairina moschata) et de leur hybride. Revue Med Vet 1997, 148(8–9):695-704.
11. Schmid M, Nanda I, Guttenbach M, Steinlein C, Hoehn M, Schartl M, Haaf T, Weigend S, Fries R, Buerstedde JM, Wimmers K, Burt DW, Smith J, A'Hara S, Law A, Griffin DK, Bumstead N, Kaufman J, Thom-son PA, Burke T, Groenen MA, Crooijmans RP, Vignal A, Fillon V, Morisson M, Pitel F, Tixier-Boichard M, Ladjali-Mohammedi K, Hillel J, Maki-Tanila A, Cheng HH, Delany ME, Burnside J, Mizuno S: First report on chicken genes and chromosomes 2000. Cytogenet
Cell Genet 2000, 90(3–4):169-218.
12. Schmid M, Nanda I, Hoehn H, Schartl M, Haaf T, Buerstedde JM, Arakawa H, Caldwell RB, Weigend S, Burt DW, Smith J, Griffin DK, Masabanda JS, Groenen MA, Crooijmans RP, Vignal A, Fillon V, Moris-son M, Pitel F, Vignoles M, Garrigues A, Gellin J, Rodionov AV, Galkina SA, Lukina NA, Ben-Ari G, Blum S, Hillel J, Twito T, Lavi U, David L, Feldman MW, Delany ME, Conley CA, Fowler VM, Hedges SB, Godbout R, Katyal S, Smith C, Hudson Q, Sinclair A, Mizuno S: Second report on chicken genes and chromosomes 2005.
Cytogenet Genome Res 2005, 109(4):415-479.
13. Fillon V, Vignoles M, Crooijmans RP, Groenen MA, Zoorob R, Vignal A: FISH mapping of 57 BAC clones reveals strong conserva-tion of synteny between Galliformes and Anseriformes. Anim
Genet 2007, 38(3):303-307.
14. Emanuel BS, Saitta SC: From microscopes to microarrays: dis-secting recurrent chromosomal rearrangements. Nat Rev
Genet 2007, 8(11):869-883.
15. Bailey JA, Eichler EE: Primate segmental duplications: crucibles of evolution, diversity and disease. Nat Rev Genet 2006, 7(7):552-564.
16. Dumas L, Kim YH, Karimpour-Fard A, Cox M, Hopkins J, Pollack JR, Sikela JM: Gene copy number variation spanning 60 million years of human and primate evolution. Genome Res 2007, 17(9):1266-1277.
17. Fortna A, Kim Y, MacLaren E, Marshall K, Hahn G, Meltesen L, Bren-ton M, Hink R, Burgers S, Hernandez-Boussard T, et al.: Lineage-specific gene duplication and loss in human and great ape evolution. PLoS Biol 2004, 2(7):E207.
18. Locke DP, Segraves R, Carbone L, Archidiacono N, Albertson DG, Pinkel D, Eichler EE: Large-scale variation among human and great ape genomes determined by array comparative genomic hybridization. Genome Res 2003, 13(3):347-357. 19. Newman TL, Tuzun E, Morrison VA, Hayden KE, Ventura M,
McGrath SD, Rocchi M, Eichler EE: A genome-wide survey of structural variation between human and chimpanzee.
Genome Research 2005, 15(10):1344-1356.
20. Samonte RV, Eichler EE: Segmental duplications and the evolu-tion of the primate genome. Nat Rev Genet 2002, 3(1):65-72. 21. Ladjali-Mohammedi K, Bitgood JJ, Tixier-Boichard M, Ponce De Leon
FA: International system for standardized avian karyotypes (ISSAK): standardized banded karyotypes of the domestic fowl (Gallus domesticus). Cytogenet Cell Genet 1999, 86(3– 4):271-276.
22. Chowdhary BP, Raudsepp T: HSA4 and GGA4: remarkable con-servation despite 300-Myr divergence. Genomics 2000, 64(1):102-105.
23. Kasai F, Garcia C, Arruga MV, Ferguson-Smith MA: Chromosome homology between chicken (Gallus gallus domesticus) and the red-legged partridge (Alectoris rufa); evidence of the occurrence of a neocentromere during evolution. Cytogenet
Genome Res 2003, 102(1–4):326-330.
Additional file 1
Chicken (Gallus gallus; GGA) BACs successfully hybridized to duck (Anas platyrhynchos; APL) macrochromosomes. BACs with these markers successfully hybridized to duck chromosomes. FLpter represents Fractional Length from the p terminus[38]; SD represents standard devi-ation. For reference, our previous data on turkey (Meleagris gallopavo, MGA) [2] is also included.
Click here for file
[http://www.biomedcentral.com/content/supplementary/1471-2164-10-357-S1.pdf]
Additional file 2
BACs on duck (Anas platyrhynchos; APL) microchromosomes. BACs with the named markers successfully hybridized to duck chromosomes. Duck chromosome number after APL10 was assigned as chicken (GGA) chromosome number plus one. The orthologous turkey (Meleagris gal-lopavo, MGA) chromosome (from [2]) is also listed.
Click here for file
Publish with BioMed Central and every scientist can read your work free of charge "BioMed Central will be the most significant development for disseminating the results of biomedical researc h in our lifetime."
Sir Paul Nurse, Cancer Research UK
Your research papers will be:
available free of charge to the entire biomedical community peer reviewed and published immediately upon acceptance cited in PubMed and archived on PubMed Central yours — you keep the copyright
Submit your manuscript here:
http://www.biomedcentral.com/info/publishing_adv.asp
BioMedcentral 24. Galkina S, Deryusheva S, Fillon V, Vignal A, Crooijmans R, Groenen
M, Rodionov A, Gaginskaya E: FISH on avian lampbrush chromo-somes produces higher resolution gene mapping. Genetica 2006, 128(1–3):241-251.
25. Musa HH, Li BC, Chen GH, Lanyasunya TP, Xu Q, Bao WB: Karyo-type and Banding Patterns of Chicken Breeds. International
Journal of Poultry Science 2005, 4(10):741-744.
26. Douaud M, Feve K, Gerus M, Fillon V, Bardes S, Gourichon D, Daw-son DA, Hanotte O, Burke T, Vignoles F, et al.: Addition of the microchromosome GGA25 to the chicken genome sequence assembly through radiation hybrid and genetic mapping. BMC Genomics 2008, 9:129.
27. Kayang BB, Fillon V, Inoue-Murayama M, Miwa M, Leroux S, Feve K, Monvoisin JL, Pitel F, Vignoles M, Mouilhayrat C, Beaumont C, Ito S, Minvielle F, Vignal A: Integrated maps in quail (Coturnix japonica) confirm the high degree of synteny conservation with chicken (Gallus gallus) despite 35 million years of diver-gence. BMC Genomics 2006, 7(1):101.
28. Bed'Hom B, Coullin P, Guillier-Gencik Z, Moulin S, Bernheim A, Volo-bouev V: Characterization of the atypical karyotype of the black-winged kite Elanus caeruleus (Falconiformes: Accipitridae) by means of classical and molecular cytoge-netic techniques. Chromosome Res 2003, 11(4):335-343. 29. Nanda I, Karl E, Griffin DK, Schartl M, Schmid M: Chromosome
repatterning in three representative parrots (Psittaci-formes) inferred from comparative chromosome painting.
Cytogenet Genome Res 2007, 117(1–4):43-53.
30. van Tuinen M, Hedges SB: Calibration of avian molecular clocks.
Mol Biol Evol 2001, 18(2):206-213.
31. Perry GH, Tchinda J, McGrath SD, Zhang J, Picker SR, Caceres AM, Iafrate AJ, Tyler-Smith C, Scherer SW, Eichler EE, Stone AC, Lee C: Hotspots for copy number variation in chimpanzees and humans. Proc Natl Acad Sci USA 2006, 103(21):8006-8011. 32. Steiper ME, Young NM: Primate molecular divergence dates.
Mol Phylogenet Evol 2006, 41(2):384-394.
33. Moon DA, Veniamin SM, Parks-Dely JA, Magor KE: The MHC of the duck (Anas platyrhynchos) contains five differentially expressed class I genes. J Immunol 2005, 175(10):6702-6712. 34. Ahlroth MK, Kola EH, Ewald D, Masabanda J, Sazanov A, Fries R,
Kulomaa MS: Characterization and chromosomal localization of the chicken avidin gene family. Anim Genet 2000, 31(6):367-375.
35. Griffin DK, Haberman F, Masabanda J, O'Brien P, Bagga M, Sazanov A, Smith J, Burt DW, Ferguson-Smith M, Wienberg J: Micro- and mac-rochromosome paints generated by flow cytometry and microdissection: tools for mapping the chicken genome.
Cytogenet Cell Genet 1999, 87(3–4):278-281.
36. Crooijmans RP, Vrebalov J, Dijkhof RJ, Poel JJ van der, Groenen MA: Two-dimensional screening of the Wageningen chicken BAC library. Mamm Genome 2000, 11(5):360-363.
37. Groenen MA, Cheng HH, Bumstead N, Benkel BF, Briles WE, Burke T, Burt DW, Crittenden LB, Dodgson J, Hillel J, Lamont S, de Leon AP, Soller M, Takahashi H, Vignal A: A consensus linkage map of the chicken genome. Genome Res 2000, 10(1):137-147. 38. Lichter P, Tang CJ, Call K, Hermanson G, Evans GA, Housman D,
Ward DC: High-resolution mapping of human chromosome 11 by in situ hybridization with cosmid clones. Science 1990, 247(4938):64-69.
39. Abramoff MD, Magelhaes PJ, Ram SJ: Image Processing with ImageJ. Biophotonics International 2004, 11(7):36-42.
40. Morris WB, Stephenson JE, Robertson LB, Turner K, Brown H, Ioan-nou D, Tempest HG, Skinner BM, Griffin DK: Practicable approaches to facilitate rapid and accurate molecular cytogenetic mapping in birds and mammals. Cytogenet Genome
Res 2007, 117(1–4):36-42.
41. Workman C, Jensen LJ, Jarmer H, Berka R, Gautier L, Nielser HB, Saxild HH, Nielsen C, Brunak S, Knudsen S: A new non-linear nor-malization method for reducing variability in DNA microar-ray experiments. Genome Biol 2002, 3(9):.
42. Tukey J: A survey of sampling from contaminated distribu-tions. In Contributions to Probability and Statistics Edited by: Olkin E. Stanford University Press; 1960:448-485.