ANALYSIS OF STEAM ASSISTED GRAVITY
DRAINAGE (SAGD) PROJECTS-ENGINEERING AND
PRODUCTIVITY METRICS PERFORMANCE IN
ALBERTA OIL AND GAS INDUSTRY
Jatinder Kumar, MSc. P.Eng.
1, Elias Ikpe, Ph.D
2,
Dr. George Jergeas, Ph.D., P.Eng.
31,2,3
Civil Engineering, University of Calgary, Alberta
ABSTRACT
Alberta oil sands industry plays a crucial role in Canada’s global economic position and the delivery of energy to the world. SAGD projects compare to mining technology is the future of oil sand projects in Alberta.SAGD is a relatively new method of oil extraction and recovery. The paper reviewed and analysed SAGD projects engineering and construction productivity metrics performance.A qualitative research methodology was employed in investigating the project performance. Interviews were conducted with industry practitioners, which contained open - ended questions. The result of the analysis shows that average engineering productivity metrics for SAGD projects is 31.50 andthe median value is 124.33 with range from 0.417 to 80.539 while construction productivity metrics is 49.258and the median value is 52.775 with range from 0.417 to 43.508.This method has the potential to contribute to a reduction in cost and schedule overruns and improves SAGD project performance. It is concluded that the results of the study will help inachieving a higher rate of productivity in the Alberta oil and gas industry.
Keywords: SAGD Projects, Engineering, Construction Productivity, Metrics, Performance
I. INTRODUCTION
Alberta oil sands industry plays a crucial role in Canada‟s global economic position and the delivery of energy
to the world. The paper presents qualitative analysis of the data on SAGD projects engineering and construction
productivity metrics of Alberta oil and gas industry. The study focuses on the benchmarking of SAGD projects
to highlight and bring to the awareness of both practitioners and researchers the potential project improvements
that can be derived from benchmarking SAGD projects in the Alberta oil and gas industry. The research lists the
performance, engineering and construction productivity metrics for SAGD projects in three quartiles. It further
discusses in details the engineering and construction productivity metrics and the equations used to calculate in
II. LITERATURE REVIEW
The SAGD projects compare to mining technology is the future of oil sand projects in Alberta. The trend of
significant growth in oil and gas sector in Alberta, has created tremendous economic opportunities but has also
posed a number of challenges, including less than anticipated performance during the construction of project
(Aminah, 2006). In order to improve construction project performance, the COAA analysed the results of the
benchmarking activities following the completion of phase 1 and determined that there was a need for new
metrics and modifications to current metrics to expand performance measurements tailored to projects in
Alberta (COAA, 2009).These efforts to support project performance on construction sites have focused
predominantly on general metrics for construction industry that can be used to improve performance.
Comprehensive studies in the benchmarking oil & gas projects, and particularly, of SAGD projects engineering
and construction productivity metrics, have not yet been undertaken.
Benchmarking is defined as a continuous process of measuring practices against competitors recognized as
industry leaders in those practices with the purpose of improve performance by adopting or adapting the best
practice of the industry leading competitor (Alstete, 2008). Typically, benchmarking looks at output (results) of
a project resulting in lag benchmarks (Anderson &McAdam, 2004). It helps in budgeting and planning and is
regarded as one of the simplest tools for effective performance improvements (Williams etal, 2012). In the
capital projects industry, it is primarily used at the project level to help participants identify gaps in their work
processes, which lead to compromise performance (Brunso, 2003). Benchmarking needs top management
support and employee participation to succeed (Lee, 2006).According to Mohammed (1996) construction
benchmarking will be successful if consistent methods of measuring performance are developed and used.
Adopting and implementing the right practices is essential to attaining world-class performance (Saunders,
2008).
Goncharuk & Monat, (2009) suggested that benchmarking is a positive, proactive process to change operations
in a structured fashion to achieve superior performance. However, construction benchmarking faces many
challenges include incomplete or non-existent data (Mohammed, 1996). Aminah (2006) argued that collecting
historical data is not sufficient and suggested that future project performance measurement should be based
upon the sound benchmarking system. It will directly address many common perceptions regarding engineering
and construction productivity metrics.
III. METRICS
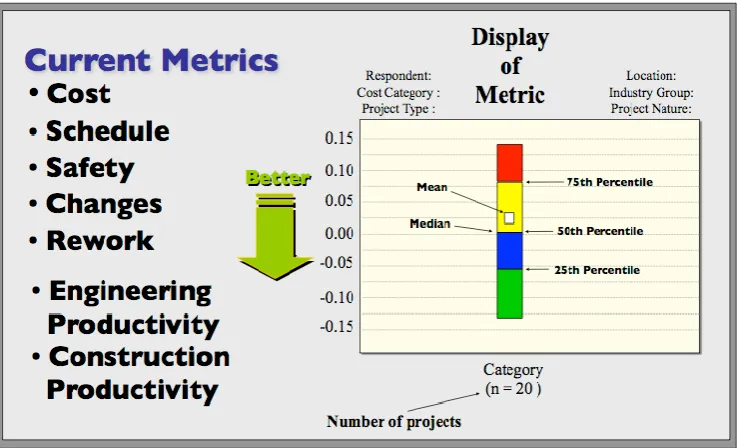
Metrics are defined as ratios of work hours (WH) to quantities (CII, 2008). For most, these metrics are easy to
understand and are consistent with most estimating and cost accounting systems. For these metrics, a lower
productivity rate is generally preferred. The metrics in the COAA Benchmarking System are visually displayed
in quartiles in reports and graphs. The visual display is enhanced through the use of a colour code for the four
Figure 1: Visual Display of Quartiles. Source: COAA (2008)
These additional metrics were developed to evaluate suspected major causes of cost overruns and schedule
delays common to large projects (Flyvberg 2003).
3.1 Engineering Productivity
CII (2008) define Engineering Productivity metrics as actual engineering work hours per Issued for
Construction (IFC) quantities, which is the number of actual direct work hours required to design a particular
unit of work. Engineering Productivity metrics are captured for significant work activities for the following
design disciplines: concrete, structural steel, piping, electrical, instrumentation, equipment
This calculation can be seen in Equation below.
Engineering Productivity
Quantity IFC
Hours Work Design Actual
Output Input
3.2 Construction Productivity Metrics
Construction Productivity metrics are defined as actual direct work hours required to install a unit quantity and
are captured for significant work activities for the following disciplines: concrete, structural steel, piping,
electrical, instrumentation, equipment, module installation, insulation, scaffolding (CII, 2008). This calculation
can be seen in Equation below.
Construction Productivity
Quantity Installed
Hours Work Direct Installed Actual
Output
Input
3.3 Research Methodology
There are three principal research approaches that can be employed in the social sciences, namely qualitative,
quantitative and mixed methods (Creswell, 2003). The qualitative methodology was employed and is considered
to be the most appropriate strategy in the context of this study for collecting data. Lincoln and Guba (1985)
described the qualitative research approach as an enquiry process of comprehending a social or human problem
informants and conducted in a natural setting. Walker (1997) and Creswell (2003) further described qualitative
methodology as explanatory in nature with the principal aim of trying to unearth answers to how? and why?
questions. The method can be used to better understand and to gain new perspectives on issues about which is
already known such as metrics system. The quantitative approach was not adopted because it would not be
sufficient in this case with limited number of oil and gas projects in Alberta. For the purpose of this research, the
authors consider qualitative methodology as more suitable to explore the SAGD projects engineering and
construction productivity metrics performance.
3.4 Development of Questionnaire
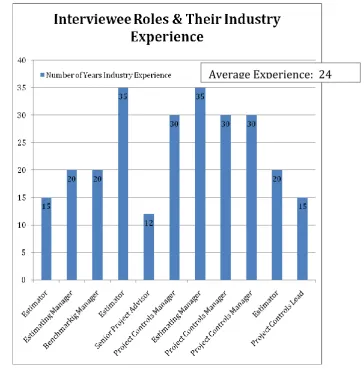
The questionnaire was designed primarily to elicit information from participants in Alberta oil and gas industries
on benchmarking SAGD projects so that metrics can be identified for a better performance. Some of these
personnel chosen are shown in figure 2 below and have average of 24 years experience in the oil and gas
industry. They are mostly responsible for project performance in their respective organizations and also are
knowledgeable on issues concerning COAA systems.Semi-structured interviews were conducted to assess the
effectiveness and use of existing metrics and SAGD projects performance. Interviews were conducted with
these personnel from 17 construction and oil and gas industries in Alberta. The interviewees were chosen from
owner, engineering, procurement and construction (EPC) companies.
Figure 2: Experience related to SAGD projects
3.5 Research Findings
Although the benchmarking program aims to capture more engineering productivity metrics but due to limited
SAGD projects and confidential polices, metrics for steel, total piping, tagged devices, Input / Output (I/O) and
total equipment are not discussed.As shown in table 1 below, mean value for total steel is 14.64 WH/Ton. It
means average SAGD project takes 14.64 works hours to produce engineering drawings for 1ton steel. Median
for steel productivity is 12.26 WH/ton with range from 7.028 WH/ton to 25.284. It can be inferred from the
table 1 below that means value for total piping is 0.599 WH/LF. It means average SAGD project takes 0.599
works hours to achieve production output. Median for total piping is 0.417WH/LF with range from 0.179
WH/LF to 2.087
.
Table 1: SAGD Projects-Engineering Productivity
Engineering Productivity Min Q1 Mean Median Q3 Max
Steel (WH/Ton), N= 10 7.028 10.59 14.64 12.263 20.31 25.284
Total Piping (WH/LF), N= 10 0.179 0.248 0.599 0.417 0.683 2.087
Tagged Devices (WH/Each), N= 12 1.408 4.757 17.13 17.11 25.2 44.232
I/O (WH/ Each), N= 10 5.336 7.732 32.61 14.001 43.38 137.66
Total Equipment (WH/Each), N=10 38.119 63.39 92.51 80.539 135.3 175.2
It can also be inferred from the table 1 above that mean value for tagged devices is 17.13 WH/each. It means
average SAGD project takes 17.13 works hours each to produce tag devices. Median value for tag device is
17.11 WH/each with range from 1.408 WH/each to 44.232. The table 1 further shows that mean value for 1/o is
32.61 WH/each. It means average SAGD project takes 32.61 work hours each to produce. Median value is
14.001WH/each with range from 5.336 to 137.66. The table 1 further shows that the mean value for total
equipment cost is 92.51 WH/each, which means average total equipment is 92.51 work hours for SAGD
projects. Median value is 80.539 with range from 38.119 to 175.2.
In Alberta, average engineering productivity for SAGD projects is 31.50 of the total engineering productivity.
The lower value represents a higher productivity (COAA, 2009). Data available from 10 projects show that, the
median value is 124.33 with range from 0.417 to 80.539. The average project cost may impact the direct
measures of engineering productivity. In general, engineering productivity metrics use direct engineering work
hours in metrics comparing them with specific issued for construction (IFC) quantities for specific disciplines.
However, it should be noted that this research measured productivity as a ratio of direct work hours to issue for
construction (IFC) quantities for engineering and to installed quantities for construction.
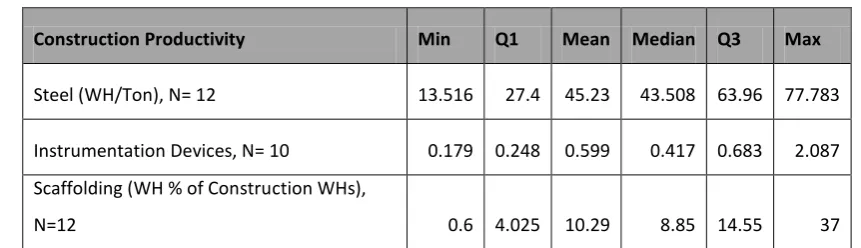
IV. PROJECT- CONSTRUCTION PRODUCTIVITY
In this research, it was captured for steel, instrumentation devices and scaffolding due to few number of SAGD
projects in the database. As shown in table 2 below, mean value for total steel is 45.23 WH/Ton. It means
average SAGD project takes 45.23 works hours to produce engineering drawings for 1ton steel. Median for steel
below that means value for instrumentation device is 0.599 WH/LF. It means average SAGD project takes
0.599 works hours to achieve production output. Median for total piping is 0.417WH/LF with range from 0.179
WH/LF to 2.087.
Table 2: SAGD Projects-Construction Productivity
Construction Productivity Min Q1 Mean Median Q3 Max
Steel (WH/Ton), N= 12 13.516 27.4 45.23 43.508 63.96 77.783
Instrumentation Devices, N= 10 0.179 0.248 0.599 0.417 0.683 2.087
Scaffolding (WH % of Construction WHs),
N=12 0.6 4.025 10.29 8.85 14.55 37
It can also be inferred from the table 2 above that means value for scaffolding (WH % of Construction WHs) is
10.29. It means scaffolding takes 10.29 works hours of percentage to achieve production output. Median for
scaffolding is 8.85 with range from 0.6 (WH % of Construction WHs) / to 37.
In Alberta oil and gas industry, average construction productivity for SAGD projects is 49.258 of the total
construction productivity. The lower value represents a higher productivity (COAA, 2009). Data available from
12 projects show that, the median value is 52.775 with range from 0.417 to 43.508. Compared to engineering
productivity on Alberta-based projects, construction productivity is considered to be more susceptible to
variance due to environmental factors such as weather. However, it should be noted that this research measured
productivity as a ratio of direct work hours to issue for construction (IFC) quantities for engineering and to
installed quantities for construction.
V. DISCUSSIONS
The analysis shows that in Alberta, average engineering productivity for SAGD projects is 31.50 of the total
engineering productivity metrics and the median value is 124.33 with range from 0.417 to 80.539. The average
project cost may impact the direct measures of engineering productivity. In general, engineering productivity
metrics use direct engineering work hours in metrics comparing them with specific issued for construction (IFC)
quantities for specific disciplines. The average construction productivity for SAGD projects is 49.258 of the
total construction productivity and the median value is 52.775 with range from 0.417 to 43.508.
Compared to engineering productivity on Alberta-based projects, construction productivity is considered to be
more susceptible to variance due to environmental factors such as weather.When these engineering and
construction productivity metrics are applied, the obvious benefits are the reduction of costs and schedule
overruns that will translate to higher profit margins for the oil and gas industry. This, therefore, makes a
compelling case for encouraging Alberta oil and gas industry to improve performance as this would lead to
greater benefits of improving SAGD projects performance. This finding is also of critical importance to this
research as it clearly sets out the business case for Alberta oil and gas industry. It demonstrates unequivocally
that there is a greater benefit arising for benchmarking SAGD projects and, by so doing, provides justification
VI. CONCLUSION
The paper presents qualitative analysis of the data on SAGD projects engineering and construction productivity
metrics of Alberta oil and gas industry. It focuses on engineering disciplines such as concrete, structural steel,
piping, electrical, instrumentation, equipment and construction discipline such as concrete, structural steel,
piping, electrical, instrumentation, equipment, module installation, insulation, scaffolding. From the
research,average engineering productivity for SAGD projects is 31.50 and the median value is 124.33 with
range from 0.417 to 80.539 while construction productivity is 49.258 and the median value is 52.775 with range
from 0.417 to 43.508.This method has the potential to contribute to a reduction in cost and schedule overruns
and improves SAGD project performance. It is concluded that the results of the study will help in achieving a
higher rate of productivity in the Alberta oil and gas industry.
VII. ACKNOWLEDGEMENT
The authors would like to thank Natural Sciences and Engineering Research Council of Canada (NSERC),
Construction Owners Association of Alberta (COAA), Construction Industry Institute (CII) and COAA
contributing members for providing financial support, data and guidance.
REFERENCES
[1]. Alnoor. A. H (2010)Effective Project Management of Oil & Gas Projects: A Model for Oil Sands' SAGD
Plants: A Thesis Submitted to the Faculty of Graduate Studies in Partial Fulfilment of the Requirements
for the Degree of Master of Science. Department of Civil Engineering, University of Calgary, Calgary.
Canada
[2]. Alstete, J. (2008). Measurement benchmarks or „real‟ benchmarking? An examination of current
perspectives, Benchmarking: An International Journal, 15(2),178-186.
[3]. Aminah R. (2005). “Results of a Survey of Performance Deviations on Major Industrial Construction Projects
in Alberta (1990-2003).” Report to Construction Owner Association of Alberta, Spring, 2005.
[4]. Anderson, K. &McAdam, R. (2004). A critique of benchmarking and performance measurement: Lead or
Lag? Benchmarking: An International Journal, 11(5),465-483
[5]. Brunso, T.P., Siddiqi, K.M. (2003). Using Benchmarks and Metrics to Evaluate Project Delivery of
Environmental Restoration Programs, Journal of Construction Engineering and Management, 129(2),
119-130
[6]. CAPP. (2009a). Canada's oil sands (pp. 2). Calgary, Alberta: Canadian Association of Petroleum
Producers (CAPP)
[7]. CAPP. (2014). Canada's oil, natural gas and oil sands - Overview and outlook
[8]. CII. (2002). Implementing the prefabrication, Modularization, and offsite fabrication decision framework:
Guide and tool. Austin, TX: University of Texas at Austin
[9]. COAA (2008). “Construction Owners Association of Alberta”, http://www.coaa.ab.ca.
[10].Creswell, J.W. (2003) Research Design: Qualitative, quantitative and Mixed Method Approaches,
[11].Flyvbjerg, B., Bruzelius, N., &Rothengatter, W. (2003). “Megaprojects and risk: An anatomy of
ambition.” Cambridge, UK: Cambridge University Press
[12].Goncharuk, A.G. &Monat, J.P. (2009). A synergistic performance management model conjoining
benchmarking and motivation. Benchmarking: An International Journal, 16(6), 767-784
[13].Government of Alberta. (2009/2010).Alberta oil sands quarterly update. Calgary,Alberta.
[14].Jergeas, G. (2008) Analysis of the Front-End loading of Alberta mega Oil Sands Projects. Project
management Journal. Vol. 39 (4) pp. 95 – 104
[15].Lee, Y.P. et al (2006). Understanding factors for benchmarking adoption: New evidence from Malaysia.
Benchmarking: An International Journal, 13(5), 548-565
[16].Lincoln, Y.S. &Guba, E.G (2000). Paradigmatic Controversies, Contradictions, and Emerging
Confluences in N.K. Dezin& Y.S. Lincoln (Eds). Handbook of Qualitative Research (2nd Ed). PP.
163-188. Thousand Oaks CA. Sage Publications Ltd in UK
[17].Mohamed, S. (1996). Benchmarking and improving construction productivity.Benchmarking for Quality
Management & Technology, 3(3), 50-58.
[18].Saunders, M. et al (2008). Implementing strategic initiatives: a framework of leading practices.
International Journal of Operations & Production Management, 28(11), 1095-1123.
[19].Walker, D.H.T. (1997). Choosing an Methodology. Journal of Construction Management and Economics,
15(2), 149
[20].Williams, J., Brown, C. & Springer, A. (2012). Overcoming benchmarking reluctance: a literature review.