A Prospective Study of the Role of Depression in the Development and
Persistence of Adolescent Obesity
Elizabeth Goodman, MD*§, and Robert C. Whitaker, MD, MPH‡§
ABSTRACT. Background. Adolescent obesity is a
strong predictor of adult obesity, and adult obesity has been associated with depression, especially in women. Studies have also suggested an association between de-pression in adolescence and higher body mass index (BMI) in adulthood. Whether depression leads to obesity or obesity causes depression is unclear.
Objective. To determine in longitudinal analyses whether depressed mood predicts the development and persistence of obesity in adolescents.
Methods. A prospective cohort study of 9374 adoles-cents in grades 7 through 12 who completed in-home interviews for the National Longitudinal Study of Ado-lescent Health. Assessments were made at baseline (1995) and at follow-up 1 year later. Depressed mood was as-sessed with the Center for Epidemiologic Studies De-pression Scale. BMI (kg/m2) was calculated from self-reported height and weight. BMI percentiles andzscores were computed using the 2000 Centers for Disease Con-trol and Prevention growth charts. Obesity was defined as BMI>95th percentile, overweight as BMI>85th
per-centile and<95th percentile, and normal weight as BMI <85th percentile. A parental respondent gave informa-tion on household income, parental educainforma-tion, and pa-rental obesity.
Results. At baseline, 12.9% were overweight, 9.7% were obese, and 8.8% had depressed mood. Baseline de-pression was not significantly correlated with baseline obesity. Among the 9.7% who were obese at follow-up, 79.6% were obese at baseline, 18.6% were overweight at baseline, and 1.8% were normal weight at baseline. Hav-ing depressed mood at baseline independently predicted obesity at follow-up (odds ratio: 2.05; 95% confidence interval: 1.18, 3.56) after controlling for BMI z score at baseline, age, race, gender, parental obesity, number of parents in the home, and family socioeconomic status. This finding persisted after controlling further for the adolescents’ report of smoking, self-esteem, delinquent behavior (conduct disorder), and physical activity. After controlling for all these same factors, depressed mood at baseline also predicted obesity at follow-up among those not obese at baseline (odds ratio: 2.05; 95% confidence
interval: 1.04, 4.06) and follow-up BMI z score among those obese at baseline ( ⴝ 0.11; standard error  ⴝ 0.05). In contrast, baseline obesity did not predict fol-low-up depression.
Conclusions. Depressed adolescents are at increased risk for the development and persistence of obesity dur-ing adolescence. Understanddur-ing the shared biological and social determinants linking depressed mood and obesity may inform the prevention and treatment of both disorders. Pediatrics 2002;109:497–504; depression, obe-sity, adolescence.
ABBREVIATIONS. BMI, body mass index; Add Health, National Longitudinal Study of Adolescent Health; CES-D, Centers for Epidemiologic Studies Depression Scale; OR, odds ratio; CI, con-fidence interval; SE, standard error.
O
besity has become a major public health
problem.
1,2More than 300 000 deaths each
year have been linked to obesity,
3and it
causes multiple medical complications.
4Although
obesity is increasing in all age groups and among all
racial/ethnic groups and educational levels, young
adults ages 18 to 29 are experiencing the highest rate
of increase.
5This suggests that there may be factors
operating during adolescence that predispose to
obe-sity risk in early adulthood, making adolescence a
critical period for the development of obesity.
6Obe-sity during adolescence carries with it important
psy-chosocial sequelae, in addition to the medical
com-plications. Obese female adolescents become adults
who, on average, earn lower wages and are at
in-creased risk of living in poverty, and obese male
adolescents are less likely to marry as adults.
7,8Stud-ies also suggest that obesity may lead to lower
self-esteem among adolescents and young adults,
espe-cially Hispanic and non-Hispanic white females.
9,10Studies on the psychological correlates and
se-quelae of obesity have usually characterized the
re-lationship between depression and obesity as
unidi-rectional.
9 –16The social stigmatization associated
with obesity is believed to engender chronic
embar-rassment, shame, and guilt, all of which may lead to
affective disorders.
17Within the context of the
fam-ily, obesity is believed to increase depressive
symp-toms because “the obese child is reared in a milieu in
which he becomes the focus of family conflicts and
the recipient of subtle hostility and rejection and is
treated differently than his siblings.”
18Although these are plausible explanations of how
obesity leads to depression, few longitudinal studies
have assessed the obesity-depression relationship to
From the Divisions of *Adolescent Medicine and ‡General and Community Pediatrics, Children’s Hospital Medical Center, Cincinnati, Ohio, and §Uni-versity of Cincinnati College of Medicine, Cincinnati, Ohio.
This work was presented, in part, at the North American Association for the Study of Obesity Annual Meeting, Quebec City, Canada, October 10, 2001. Received for publication Dec 26, 2001; accepted Mar 27, 2002.
Address correspondence to Elizabeth Goodman, MD, Heller School for Social Policy and Management, Brandeis University, MS035, 415 South St, Waltham, MA 02454. E-mail: [email protected]
These data are not available from the author. Persons interested in obtaining data files from the National Longitudinal Study of Adolescent Health should contact Francesca Florey, Carolina Population Center, 123 W Frank-lin St, Chapel Hill, NC 27516-3997. E-mail: [email protected]
help establish the causal direction of this association.
Most studies have been cross-sectional and have
re-lied on clinic-based populations. In a recent
prospec-tive study, Pine et al
19showed that childhood
de-pression was associated with an increased body mass
index (BMI) in adulthood. This association persisted
after controlling for socioeconomic factors. Although
the study was not drawn from a nationally
represen-tative sample, experienced losses to follow-up, had
limited data on childhood BMI, and had no data on
parental BMI, it provided the strongest evidence to
date that depression may be a cause and not just a
consequence of obesity.
19Additional studies are
im-portant to help clarify the timing of depression in
relation to the development of obesity.
Understand-ing that depression can lead to obesity may enlighten
obesity prevention strategies and lead to more focus
on the biological and social determinants shared by
both disorders. The objective of this study was to
determine, in a nationally representative sample,
whether depression increases risk for obesity during
adolescence. We hypothesized that high levels of
depressive symptoms would increase the risk of
obe-sity at 1-year follow-up among teens.
METHODS Sample
The data for this study were drawn from the National Longi-tudinal Study of Adolescent Health (Add Health), a nationally representative, comprehensive, school-based study of youth in grades 7 to 12.20. The current study used data from the weighted in-home sample at baseline (Wave 1 in April-December 1995) and first follow-up (Wave 2 in April-August 1996). The sample used in our analyses was defined by 5 inclusion criteria. The subjects were those who 1) were⬍20 years old at Wave 1; 2) completed the in-home interviews in both waves, 3) had a biological, step, foster, or adoptive parent (the “parental respondent” for purposes of this study) who completed an in-home interview at Wave 1; and 4) provided self-reported height and weight at both waves. Because of significant racial/ethnic differences in prevalence of obesity21,22 and depression23and because the subgroup sizes for some racial/ ethnic groups were so small, our study sample was further re-stricted to individuals who were white, Hispanic; black, non-Hispanic; or Hispanic. The final sample size was 9374 adolescents.
Measures
Obesity
Subjects self-reported their height in feet and inches and weight in pounds in both waves. From these data, BMI percentiles andz
scores were calculated using the 2000 Centers for Disease Control and Prevention growth charts.24 Obesity was defined as a BMI (kg/m2) greater than or equal to the 95th percentile for age and gender, overweight as a BMI greater than or equal to the 85th percentile but less than the 95th percentile, and normal weight as BMI less than the 85th percentile. Because the 95th percentile BMI in the reference growth charts was⬎30.0 in late adolescence and because some subjects were over 20 years of age at follow-up, a BMI of 30.0 or higher was considered obese in accordance with standard adult criteria.25
Depression
A slightly modified version of the Center for Epidemiologic Studies Depression Scale (CES-D, 18 of 20 total items) was used to assess depressive symptoms.26The CES-D is a well-validated and widely used instrument that was developed to measure symptoms of depression within the community. The scale is valid for use in both junior and senior high school student populations.27Roberts et al28determined that scores of 24 in females and 22 in males maximized the sensitivity and specificity of the CES-D for predict-ing major depressive disorder among adolescents. Thus, we
cre-ated a dichotomous variable indicating depressed mood based on these cutpoints.
Sociodemographic Variables
Age was determined as the date of the interview minus the date of birth. The Wave 1 in-home interviewer determined gender. Female gender was used as the reference category as evidence suggests obesity is more common among adolescent males.21,29 Race/ethnicity was categorized as white, non-Hispanic; black, non-Hispanic; or Hispanic based on self-identified membership in race/ethnic groups. White, non-Hispanic was used as the refer-ence category in regression analyses. Number of “parents” in the home was determined by categorizing answers to the relationship of the teen to those individuals identified by the teen as living in the house. If a member of the household roster was identified as mother, father’s wife, or father’s partner, “mother” was consid-ered to be living in the house. If a member of the household roster was identified as father, mother’s husband, or mother’s partner, then “father” was considered to be living in the house. The final measure was a dichotomous variable representing 2 parents in the home as opposed to 1 or none.
Two ordinal measures of socioeconomic status were drawn from information obtained during the parental interview. Parental respondents were asked to report, in thousands of dollars, how much before-tax total income the household received in 1994 by including income from all household members, dividends, wel-fare benefits, and other sources. As previously described,29 we created an ordinal 5-level variable for income ranging from level 1, those⬍1.5 times the federal poverty threshold in 1994, to level 5, those in the top 5% of US household incomes in 1994. Parental respondents reported their own and their current spouse or part-ner’s educational attainment. The higher of these 2 education levels was used to create a variable corresponding to educational level of the highest educated parent.29Categories of this 5-level ordinal measure of parental education ranged form less than a high school degree1to professional training beyond college.5 Pa-rental respondents also reported whether the teen’s biological mother and father “was obese,” but did not report actual parental height and weight. The number of obese parents was determined by summing responses to these questions (range: 0 –2).
Psychological and Behavioral Covariates
We defined 4 psychological and behavioral covariates based on previous research linking each to obesity and/or depression. These covariates were all measured at baseline. A description of each follows.
Self-Esteem
Self-esteem was measured by the 6-item personal self-image scale developed by Resnick et al for Add Health analyses.30The scale has excellent reliability (Cronbach’s␣⫽0.85). Higher scores indicate lower self-esteem. For logistic regression analyses, low self-esteem, defined as scoring in the highest quartile on this scale, was compared with a referent group of those in the other quar-tiles.
Smoking
Delinquent Behavior
Fifteen items in Add Health assessed involvement in delin-quent behaviors in the past 12 months. The scale had excellent reliability (Cronbach’s␣⫽0.84). Examples of behaviors assessed include deliberate destruction of someone else’s property, lying to parents, stealing, physical fighting, running away, and weapon carrying. These behaviors are consistent with those used to diag-nose conduct disorder,31which has been associated with the de-velopment of obesity in young adulthood.32To develop a proxy measure of conduct disorder, a dichotomous variable was created to identify those scoring in the top quartile on this scale.
Low Physical Activity
Public health guidelines suggest that adolescents should en-gage in at least 3 bouts of moderate to vigorous physical activity per week.33Thus, adolescents who did not report at least 3 bouts of moderate to vigorous physical activity per week were consid-ered to have low physical activity. Moderate to vigorous physical activity was defined as has been done in previous analyses using Add Health data.34,35
Data Analyses
We weighted the data to account for the complex sampling frame of Add Health and report unweighted sample size (N) and weighted percents in the tables. To decrease the likelihood of a type 1 error because of the extremely large weighted sample size, sample weights were normalized so that the weighted sample size equaled the observed sample size.36 Descriptive statistics were generated with SPSS version 10.37All statistical significance test-ing (2-tailed) was performed ustest-ing SUDAAN V8.0 to account for design effects (Research Triangle Institute, Research Triangle Park, NC).38We used 2tests for bivariate analyses and logistic and linear regression for multivariable analyses. Multivariable analy-sis was performed to examine the relationships between baseline depressed mood and obesity at baseline, obesity at follow-up, and BMIzscore at follow-up. Multivariable analysis was also used to examine the relationship between obesity at baseline and de-pressed mood at follow-up. These regressions controlled for the other variables potentially related to both depressed mood and obesity.
Because the 2 variables measuring socioeconomic status (pa-rental education and household income) were correlated to one another (Pearson’sr⫽0.50) and because current recommenda-tions39,40indicate that these factors represent different domains of social status and should be modeled separately, multivariable analyses were run separately using parental education and house-hold income as independent variables. Results were not substan-tially different between these sets of analyses, and because paren-tal education is less dynamic than household income and fewer subjects were missing education data than income data, results are presented for parental education only. In the total study sample, analyses that included both indicators of socioeconomic status yielded essentially identical results. Subgroup analyses were not performed with both indicators because of increased sample attri-tion from missing data. Results from multivariable analyses using household income and using both indicators of socioeconomic status are available from the first author (E.G.).
We first developed a logistic model to assess correlates of baseline obesity. The following 7 variables were entered simulta-neously in the model: age, gender, race/ethnicity, number of obese parents (0,1,2), parent education, number of parents in the house (0 –1 vs 2), and baseline depressed mood. We tested for 2-way interactions between depression, age, race/ethnicity, and gender. All were nonsignificant, so none are reported. After de-termining correlates of baseline obesity, we next turned to deter-mining predictors of obesity at follow-up. To do this, we devel-oped a “core” logistic model using these same 7 independent variables described above plus baseline BMIzscore. We tested the core model for 2-way interactions between depression, gender, age, and race/ethnicity. Again, no significant interactions were found, so none are reported. Using the total sample, we then took this core model and developed 4 separate models in which we added 1 of the 4 psychological and behavioral covariates to deter-mine whether addition of the covariate into the core model sig-nificantly altered the relationship between baseline depressed mood and follow-up obesity. We also tested for interactions
be-tween depressed mood and the appropriate psychological and behavioral covariate in these models. Significant interactions are reported and were retained in models using the associated covari-ate. A final model including the 8 independent variables in the core model and all 4 psychological and behavioral covariates and any significant interactions was also run.
We next stratified the study sample by baseline weight status into those who were obese at baseline and those who were not to determine whether baseline obesity changed the effect of baseline depressed mood on follow-up weight status. We performed the logistic regression models described above on the sample not obese at baseline. For those obese at baseline, we used the same model building strategy to develop a series of linear regression models. Follow-up BMI z score was the dependent variable in these linear regression models because such a large proportion of those obese at baseline were obese at follow-up.
We also performed parallel logistic regression modeling to determine whether baseline obesity predicted follow-up de-pressed mood. In these logistic models, dede-pressed mood at fol-low-up was the dependent variable. Independent variables in-cluded in the core model were age, gender, race/ethnicity, parent education, the number of parents in the house, and baseline CES-D score. The same psychological and behavioral covariates were used in these logistic models.
RESULTS
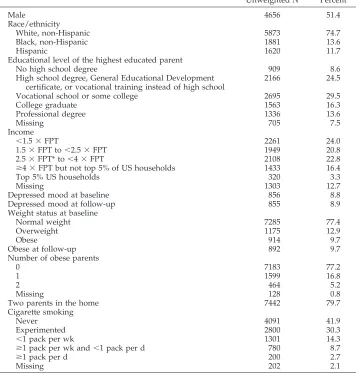
A description of the study sample is found in
Table 1. At baseline, 12.9% were overweight, 9.7%
were obese, and 8.8% had depressed mood. Baseline
depressed mood was not significantly associated
with baseline obesity—9.0% of those depressed at
baseline were obese compared with 9.8% of the
non-depressed and 8.2% of those obese at baseline were
depressed compared with 8.9% of the nonobese (
P
⫽
.60). In multivariable analysis, the number of obese
parents was the strongest correlate of baseline
obe-sity (odds ratio [OR]: 2.80; 95% confidence interval
[CI]: 2.43, 3.80), followed by non-Hispanic black
race/ethnicity, and male gender (Table 2). All 4
psy-chological and behavioral covariates were associated
with baseline depressed mood but not with obesity
at follow-up (Table 3).
smoking, depressed mood maintained its
signifi-cance (OR: 2.39; 95% CI: 1.05, 5.45).
Among those obese at baseline, linear regression
analyses (Table 4) revealed that baseline depressed
mood also predicted BMI
z
score at follow-up (

⫽
0.11; standard error [SE]

⫽
0.05;
P
⫽
.045). This
positive

suggests that depressed mood causes
worsening obesity over the next year among obese
adolescents. Controlling for psychological and
be-havioral covariates had some effect on this
relation-ship. The relationship between baseline depressed
mood and follow-up BMI
z
score remained
signifi-cant when adjusting for low physical activity and
high delinquency. Both of these covariates were not
significantly associated with BMI
z
score at
follow-up. However, in models which adjusted for low
self-esteem and cigarette smoking, the association of
baseline depressed mood to follow-up BMI
z
score
became nonsignificant. In the model adjusting for
low self-esteem, neither depressed mood nor low
self-esteem were associated with follow-up BMI
z
score. Although smoking at least a pack per day was
associated with decreasing BMI
z
score at
follow-up[

smoking at least a pack per day⫽ ⫺
0.21; SE

⫽
0.10;
P
⫽
.016], a significant, positive interaction between
depressed mood and smoking at least a pack per day
was also present [

interaction⫽
0.50; SE

⫽
0.25;
P
⫽
.048]. This suggests that depressed obese youth who
smoke heavily are at increased risk for worsening
obesity.
In contrast to the findings regarding the effects of
baseline depressed mood on follow-up obesity,
base-line obesity did not predict follow-up depressed
mood in either bivariate or multivariable analyses.
Of those obese at baseline, 9.9% had depressed mood
at follow-up compared with 8.7% of those who were
TABLE 1. Description of Study Sample (N⫽9374)
UnweightedN Percent
Male 4656 51.4
Race/ethnicity
White, non-Hispanic 5873 74.7
Black, non-Hispanic 1881 13.6
Hispanic 1620 11.7
Educational level of the highest educated parent
No high school degree 909 8.6
High school degree, General Educational Development certificate, or vocational training instead of high school
2166 24.5
Vocational school or some college 2695 29.5
College graduate 1563 16.3
Professional degree 1336 13.6
Missing 705 7.5
Income
⬍1.5⫻FPT 2261 24.0
1.5⫻FPT to⬍2.5⫻FPT 1949 20.8
2.5⫻FPT* to⬍4⫻FPT 2108 22.8
ⱖ4⫻FPT but not top 5% of US households 1433 16.4
Top 5% US households 320 3.3
Missing 1303 12.7
Depressed mood at baseline 856 8.8
Depressed mood at follow-up 855 8.9
Weight status at baseline
Normal weight 7285 77.4
Overweight 1175 12.9
Obese 914 9.7
Obese at follow-up 892 9.7
Number of obese parents
0 7183 77.2
1 1599 16.8
2 464 5.2
Missing 128 0.8
Two parents in the home 7442 79.7
Cigarette smoking
Never 4091 41.9
Experimented 2800 30.3
⬍1 pack per wk 1301 14.3
ⱖ1 pack per wk and⬍1 pack per d 780 8.7
ⱖ1 pack per d 200 2.7
Missing 202 2.1
FPT indicates Federal poverty threshold adjusted for household size.
TABLE 2. Correlates of Baseline Obesity
AOR 95% CI
Age 0.94 0.88, 1.01
Male gender 1.77 1.45, 2.17
Race
White, non-Hispanic 1.00
Black, non-Hispanic 1.94 1.51, 2.48
Hispanic 1.33 0.98, 1.80
Two parents in the home 1.06 0.81, 1.38 Number of obese parents 2.80 2.43, 3.22 Increasing parental education 0.76 0.69, 0.83 Depressed mood at baseline 0.90 0.62, 1.30
not obese at baseline (
P
⫽
.43) In the core model,
increasing parental education was protective (OR:
0.86, 95% CI: 0.76, 0.91), whereas older age (OR: 1.11;
95% CI: 1.04, 1.19) and higher baseline depressive
symptoms increased risk of depressed mood at
fol-low-up (OR: 1.17; 95% CI: 1.16, 1.19). Baseline obesity
was not significantly associated with follow-up
de-pressed mood in the core model (OR: 1.16; 95% CI:
0.81, 1.65). Additional modeling revealed that low
self-esteem, high delinquency, and smoking
behav-iors remained independent predictors of follow-up
depressed mood in multivariable analyses, but
base-line obesity remained nonsignificant in all models.
DISCUSSION
Using data from a nationally representative cohort
of
⬎
9000 adolescents who were surveyed in 1995 and
again 1 year later, we have shown that depressed
mood at baseline was associated with the
develop-ment of obesity in those not yet obese at baseline and
with an increase in age-adjusted BMI in those
al-ready obese at baseline. Among those adolescents
not yet obese at baseline, the odds of becoming obese
in the next year were doubled if they had a
de-pressed mood at baseline. This risk persisted after
controlling for several factors related to both
de-pressed mood and obesity, including low
self-es-teem, low levels of physical activity, parental obesity,
and lower levels of parent education.
The association between obesity and various
psy-chological states has been reported in the scientific
literature over the last several decades.
17Many of
these studies have examined the relationship
be-tween obesity and depression, but nearly all have
been cross-sectional in design, and very few have
involved children or adolescents. A prospective
study design is required to help distinguish whether
depressed mood could be a cause, and not just an
effect, of obesity.
Strauss
10prospectively examined changes in
self-esteem among obese and nonobese 9- and
10-year-old children. Obese children had worsening
esteem over a 4-year period, and this decline in
self-esteem was associated with increased feelings of
sadness and loneliness in early adolescence.
How-ever, this study did not assess whether either
wors-ening self-esteem or increased sadness was
associ-ated with the development or worsening of obesity
over time. Depression and self-esteem are highly
interrelated, both conceptually and clinically. In this
study, we found that baseline low self-esteem was
not associated with obesity at follow-up among
ad-olescents who were not obese at baseline. However,
among those obese at baseline, we were unable to
separate the effects of depressed mood from low
self-esteem, perhaps because of low discriminant
va-lidity of the measures used in Add Health.
To our knowledge, Pine et al
19,32have published
the only 2 prospective studies examining the
associ-ation between depression in childhood and
adoles-cence and later obesity. These studies suggested that
depression and conduct disorder were associated
with the development and persistence of obesity in
women, but not in men. In contrast, our study did
not demonstrate a moderating effect of gender. In
addition, we found that delinquent behaviors, used
TABLE 3. Percentage of Subjects With Baseline Depressed Mood and Follow-up Obesity That Have the Identified Psychological and Behavioral Covariate at Baseline
Baseline Depressed Mood Follow-up Obesity
Yes (%) No (%) PValue Yes (%) No (%) PValue
Cigarette smoking ⬍.0001 .72
Never 23.7 44.6 41.8 42.9
Experimenter 27.1 31.3 33.7 30.6
Current smoker,⬍1 pack per wk 23.6 13.8 13.5 14.7
Current smoker,ⱖ1 pack per wk and⬍1 pack per d
18.9 7.9 8.8 8.9
Current smoker,ⱖ1 pack per d 6.8 2.4 2.2 2.8
Low self-esteem 62.7 17.0 ⬍.0001 24.6 20.7 .16
High delinquency 46.6 19.8 ⬍.0001 20.2 22.4 .26
Low physical activity 33.0 25.0 ⬍.0001 28.2 25.1 .18
TABLE 4. Regression Models* Describing the Effect of Baseline Depressed Mood on Follow-up Obesity
Total Baseline Nonobese Baseline Obese
AOR 95% CI AOR 95% CI  SE
Core model 2.05† 1.18, 3.56 2.05† 1.04, 4.06 0.11† 0.05
Core model⫹low self esteem 2.01† 1.11, 3.64 2.23† 1.03, 4.83 0.08 0.06
Core model⫹cigarette smoking 2.02† 1.12, 3.65 1.95 0.94, 4.05 0.09 0.05
Core model⫹high delinquency 2.24† 1.27, 3.95 2.30† 1.14, 4.64 0.13† 0.06
Core model⫹low physical activity 2.03† 1.17, 3.52 2.00† 1,02, 3.94 0.11† 0.05
Core model⫹all covariates 2.17† 1.14, 4.11 2.39† 1.05, 5.45 0.08 0.06
* For total and baseline nonobese samples, logistic regression was used with obesity at follow as the dependent variable. For those obese at baseline, linear regression was used with BMIzscore at follow as the dependent variable. The core model including depressed mood at baseline plus the following 7 independent variables: age, gender, race/ethnicity, parental obesity, parental education, 2 parents in the home versus other, and baseline BMIzscore. The adjusted odds ratios (AOR) and adjusted regression coefficients () associated with depressed mood at baseline are presented for the logistic and linear regression models, respectively.
by us as a proxy for conduct disorder, were not
associated with obesity at follow-up and did not alter
the depressed mood-obesity relationship. The
differ-ences between the design of Pine’s study and our
own were numerous and might explain the different
results. Most important among these differences is
the fact that their studies used a standard psychiatric
interview to establish the diagnoses of depression
and conduct disorder. However, these investigators
were unable to control for the BMI of the child or
adolescent at baseline or for parental obesity, as we
did in our study.
Although we were able to control for parental
obesity in this study, parental BMI was not available
in Add Health. In fact, Add Health posed a number
of limitations for studying the relationship between
obesity and depression. For example, measured
heights and weights were available only at
follow-up, although self-reported height and weight was
present in both waves. Our analyses suggest that
there are some systematic differences in how
indi-viduals report their heights and weights. We did
assess whether depressed mood at follow-up
influ-enced reporting of height and weight and found no
difference in reporting among those with depressed
mood compared with those without. In addition,
previous work suggests these differences do not lead
to misclassification with regard to obesity status.
41Because we focused on the dichotomous outcome of
obesity, this reporting bias has little effect, except in
the analyses of worsening BMI among those obese at
baseline. Those obese at baseline may underreport
their BMI at follow-up, and they may do so more if
they are more obese at baseline. Another limitation
relates to the psychological and behavioral measures
in Add Health. Although these were drawn from
validated instruments, the survey does not include
complete scales. Thus, there is little data on the
va-lidity and reliability of these measures. The CES-D is
perhaps one of the strongest in the survey, as 16 of
the 20 items are included verbatim, but it is not a
diagnostic tool for major depressive disorder. Last,
Add Health is a study of in-school youth. Youth with
chronic disease, such as depression and obesity, may
be less likely to stay in school. Despite these
limita-tions, Add Health is one of the largest, most recent
epidemiologic studies of American youth and
pro-vides valuable data with which to understand the
complexities between depression, obesity, and
ado-lescent development.
The relationship between depression and obesity
during adolescence is important to understand
be-cause this is the developmental period in which both
conditions may have their origins. Furthermore, both
obesity
42and depression
43– 45are increasing
world-wide, and the reasons for these trends are unknown.
Obesity is a biologically heterogeneous disorder.
46It
is likely that there is a subgroup of individuals for
whom depressed mood is an important risk factor
for development of obesity. These may be the same
individuals who report increased, rather than
de-creased, appetite with the onset of depression or
those who have binge eating disorder, a group in
whom depression is more common.
47This subgroup
may also represent a population for whom treatment
of depressed mood could alter the course and/or
development of obesity. Once obesity develops at
any age, it is very resistant to treatment.
48,49In
con-trast, there are promising pharmacologic and
non-pharmacologic approaches to treating depression in
adults and children.
50 –54For individuals for whom
depressed mood increases risk of obesity, treatment
of the depression may also prevent development of
weight gain.
There is evidence of shared neurobiological
mech-anisms between obesity and depression, particularly
in regard to serotonin and its metabolites,
55,56as well
as evidence linking depressive symptoms and body
weight to alterations in
hypothalamic-pituitary-adre-nal axis functioning, particularly the chronic
exces-sive secretion of cortisol.
57,58Chronic stress is also
believed to increase abdominal obesity and its
re-lated adverse metabolic consequences, such as
hy-pertension, insulin resistance, and dyslipidemia.
59,60This stress, which may begin in early childhood and
could be linked to a hostile social environment, may
lead to changes in brain morphology and the
neu-roendocrine axis that can cause both obesity and
depression.
57,58,61Based on these shared
neuroendo-crine pathways, a theoretical basis for treating
obe-sity with antidepressants has already been
suggest-ed.
62Despite the appreciation that the antecedents of
obesity and depression can occur before adulthood
and that both are conditions governed by the brain,
little attention has been given to secular trends in the
social factors that may underlie the increasing
prev-alence of both conditions. We postulate that there
may be at least 3 such secular trends which may be
interrelated— declining levels of physical
activi-ty,
63,64increasing social isolation,
65and increasing
socioeconomic inequality.
57,66 – 69In addition to
in-creasing chronic levels of stress, lower
socioeco-nomic status may lead to increased depression and
obesity by constraining opportunities of physical
ac-tivity because of unsafe neighborhoods or
neighbor-hoods that lack resources such as parks,
play-grounds, and organized team sports. Such structural
effects also increase social isolation. Social policies,
such as increasing availability of quality after school
programs that increase opportunities for safe
out-door activity and peer interaction, may counteract
these processes and help stem the rising rates of
depression and obesity among youth.
CONCLUSION
ACKNOWLEDGMENTS
This research is based on data from the Add Health project, a program project designed by J. Richard Udry (PI) and Peter Bear-man, and funded by grant P01-HD31921 from the National Insti-tute of Child Health and Human Development to the Carolina Population Center, University of North Carolina at Chapel Hill. Cooperative funding was provided by the National Cancer Insti-tute; the National Institute of Alcohol Abuse and Alcoholism; the National Institute on Deafness and Other Communication Disor-ders; the National Institute of Drug Abuse; the National Institute of General Medical Sciences; the National Institute of Mental Health; the National Institute of Nursing Research; the Office of AIDS Research, National Institutes of Health; the Office of Behav-ior and Social Science Research, National Institutes of Health; the Office of the Director, National Institutes of Health; the Office of Research on Women’s Health, National Institutes of Health; the Office of Population Affairs, Department of Health and Human Services; the National Center for Health Statistics; Centers for Disease Control and Prevention, Department of Health and Hu-man Services; the Office of Minority Health, Centers for Disease Control and Prevention, Department of Health and Human Ser-vices; the Office of Minority Health, Office of the Assistant Secre-tary of Health, Department of Health and Human Services; the Office of Assistant Secretary of Planning and Evaluation, Depart-ment of Health and Human Services; and the National Science Foundation.
REFERENCES
1. Koplan JP, Dietz WH. Caloric imbalance and public health policy.
JAMA.1999;282:1579 –1581
2. US Department of Health and Human Services.The Surgeon General’s Call to Action to Prevent and Decrease Overweight and Obesity. Rockville, MD: Department of Health and Human Services, Public Health Service, Office of the Surgeon General; 2001:1–35
3. Allison DB, Fontaine KR, Manson JE, Stevens J, VanItallie TB. Annual deaths attributable to obesity in the United States.JAMA.1999;282: 1530 –1538
4. Must A, Spadano J, Coakley EH, Field AE, Colditz G, Heitz WH. The disease burden associated with overweight and obesity.JAMA.1999; 282:1523–1529
5. Mokdad AH, Serdula MK, Dietz WH, Bowman BA, Marks JS, Koplan JP. The spread of the obesity epidemic in the United States, 1991–1998.
JAMA.1999;282:1519 –1522
6. Dietz WH. Critical periods in childhood for the development of obesity.
Am J Clin Nutr.1994;59:955–959
7. Gortmaker SL, Must A, Perrien JM, Sobol AM, Dietz W. Social and economic consequences of overweight in adolescence and young adult-hood.N Engl J Med.1993;329:1008 –1012
8. Sargent JD, Blanchflower DG. Obesity and stature in adolescence and earnings in young adulthood. Analysis of a British birth cohort. [see comments].Arch Pediatr Adolesc Med.1994;148:681– 687
9. French SA, Story M, Perry CL. Self-esteem and obesity in children and adolescents: a literature review.Obes Res.1995;3:479 – 490
10. Strauss RS. Childhood obesity and self-esteem.Pediatrics.2000;105(1). Available at: www.pediatrics.org/cgi/content/full/105/1/e15 11. Sheslow D, Hassink S, Wallace W, DeLancey E. The relationship
be-tween self-esteem and depression in obese children.Ann N Y Acad Sci.
1993;699:289 –291
12. Carpenter KM, Hasin DS, Allison DB, Faith MS. Relationships between obesity and DSM-IV major depressive disorder, suicide ideation, and suicide attempts: results from a general population study.Am J Public Health.2000;90:251–257
13. Wallace WJ, Sheslow D, Hassink S. Obesity in children: a risk for depression.Ann N Y Acad Sci.1993;699:301–303
14. Istvan J, Zavela K, Weidner G. Body weight and psychological distress in NHANES I [see comments].Int J Obes Relat Metab Disord.1992;16: 999 –1003
15. Britz B, Siegfried W, Ziegler A, et al. Rates of psychiatric disorders in a clinical study group of adolescents with extreme obesity and in obese adolescents ascertained via a population based study.Int J Obes Relat Metab Disord.2000;24:1707–1714
16. Erickson SJ, Robinson TN, Haydel KF, Killen JD. Are overweight chil-dren unhappy? Body mass index, depressive symptoms, and over-weight concerns in elementary school children.Arch Pediatr Adolesc Med.2000;154:931–935
17. Friedman MA, Brownell KD. Psychological correlates of obesity: mov-ing to the next research generation.Psychol Bull.1995;117:3–20
18. Hammar SL, Campbell MM, Campbell VA, et al. An interdisciplinary study of adolescent obesity.J Pediatr.1972;80:373–383
19. Pine DS, Goldstein RB, Wolk S, Weissman MM. The association be-tween childhood depression and adulthood body mass index.Pediatrics.
2001;107:1049 –1056
20. Bearman PS, Jones J, Udry JR. The National Longitudinal Study of Adolescent Health: Research Design; 1997. Available at: http:// www.cpc.unc. edu/projects/addhealth/design.html
21. Troiano RP, Flegal KM. Overweight children and adolescents: descrip-tion, epidemiology, and demographics.Pediatrics.1998;101:497–505 22. Rosner B, Prineas R, Loggie J, Daniels SR. Percentiles for body mass
index in US children 5 to 17 years of age.J Pediatr.1998;132:211–222 23. Fleming JE, Offord DR. Epidemiology of childhood depressive disorders: a
critical review.J Am Acad Child Adolesc Psychiatry.1990;29:571–580 24. National Center for Health Statistics.CDC Growth Charts: United States.
2001. Available at: http://www.cdc.gov/nchs/about/major/nhanes/ growthcharts/datafiles.htm
25. World Health Organization.Physical Status: The Use and Interpretation of Anthropometry. Geneva, Switzerland: WHO; 1995
26. Radloff L. The CES-D scale: a self report depression scale for research in the general population.Appl Psychol Meas.1977;1:385– 401
27. Radloff L. The use of the Center for Epidemiologic Studies Depression Scale in adolescent and young adults.J Youth Adolesc.1991;20:149 –166 28. Roberts RE, Lewinsohn PM, Seeley JR. Screening for adolescent depression: a comparison of depression scales.J Am Acad Child Adolesc Psychiatry.1991;30:58 – 66
29. Goodman E. The role of socioeconomic status gradients in explaining differences in US adolescents’ health. Am J Public Health. 1999;89: 1522–1528
30. Resnick MD, Bearman PS, Blum RW, et al. Protecting adolescents from harm: findings from the National Longitudinal Study of Adolescent Health.JAMA.1997;278:823– 832
31. Diagnostic and Statistical Manual of Mental Disorders. 4th ed. Washington, DC: American Psychiatric Association; 1994
32. Pine DS, Cohen P, Brook J, Coplan JD. Psychiatric symptoms in ado-lescence as predictors of obesity in early adulthood: a longitudinal study.Am J Public Health.1997;87:1303–1310
33. Sallis J, Patrick K. Physical activity guidelines for adolescents: consen-sus statement.Pediatr Exerc Sci.1994;6:302–314
34. Gordon-Larsen P, McMurray RG, Popkin BM. Adolescent physical ac-tivity and inacac-tivity vary by ethnicity: the National Longitudinal Study of Adolescent Health.J Pediatr.1999;135:301–306
35. Gordon-Larsen P, McMurray RG, Popkin BM. Determinants of adoles-cent physical activity and inactivity patterns.Pediatrics.2000;105(6). Available at: www.pediatrics.org/cgi/content/full/105/6/e83 36. Brogan DJ. Pitfalls of using standard statistical software packages for
sample survey data. In: Armitage P, Colton T, eds.Encyclopedia of Biostatistics. Vol. 5. New York, NY: John Wiley & Sons; 1998:4167– 4174 37. SPSS.SPSS Base 10.0 User’s Guide. Chicago, IL: SPSS, Inc; 1999 38. Shah BV, Barnwell BG, Bieler GS. Sudaan User’s Manual Release 7.5.
Research Triangle Park, NC: Research Triangle Institute; 1997 39. Libratos P, Link BG, Kelsey JL. The measurement of social class in
epidemiology.Epidemiol Rev.1988;10:87–121
40. Kaplan GA, Keil JE. Socioeconomic factors and cardiovascular disease: a review of the literature.Circulation.1993;88:1973–1988
41. Goodman E, Hinden BR, Khandelwal S. Accuracy of teen and parental reports of obesity and body mass index.Pediatrics.2000;106:52–58 42. World Health Organization.Obesity: Preventing and Managing the Global
Epidemic. 1998. Available at: http://www.who.int/ncd/cvd/ obesityreport.pdf
43. Murray CJL, Lopex AD.Global Burden of Disease and Injury.Cambridge, MA: Harvard University Press; 1996
44. Cross-National Collaborative Group. The changing rate of major de-pression. Cross-national comparisons.JAMA.1992;268:3098 –3105 45. Klerman GL, Weissman MM. Increasing rates of depression.JAMA.
1989;261:2229 –2235
46. Perusse L, Chagnon YC, Weisnagel SJ, et al. The human obesity gene map: the 2000 update.Obes Res.2001;9:135–169
47. Smith DE, Marcus MD, Lewis CE, Fitzgibbon M, Schreiner P. Preva-lence of binge eating disorder, obesity, and depression in a biracial cohort of young adults.Ann Behav Med.1998;20:227–332
48. NIH Technology Assessment Conference Panel. Methods for voluntary weight loss and control.Ann Intern Med.1993;119:764 –770
49. National Institutes of Health. Clinical Guidelines on the Identification, Evaluation, and Treatment of Overweight and Obesity in Adults: The Evidence Report. 1998. Available at: http://www.nhlbi.nih.gov/ guidelines/obesity/ob gdlns.pdf. Accessed July 11, 2002
Newer Pharmacotherapies: Evidence Report/Technology Assessment Number 7. Rockville, MD: Agency for Health Care Policy and Research; 1999 51. Practice parameters for the assessment and treatment of children and
adolescents with depressive disorders. AACAP.J Am Acad Child Adolesc Psychiatry.1998;37:63S– 83S
52. Schulberg HC, Katon W, Simon GE, Rush AJ. Treating major depression in primary care practice: an update of the Agency for Health Care Policy and Research Practice Guidelines. Arch Gen Psychiatry. 1998;55: 1121–1127
53. Birmaher B, Ryan ND, Williamson DE, et al. Childhood and adolescent depression: a review of the past 10 years. Part I.J Am Acad Child Adolesc Psychiatry.1996;35:1427–1439
54. Birmaher B, Ryan ND, Williamson DE, Brent DA, Kaufman J. Child-hood and adolescent depression: a review of the past 10 years. Part II. J Am Acad Child Adolesc Psychiatry.1996;35:1575–1583
55. Wurtman JJ. Depression and weight gain: the serotonin connection.J Affect Disord.1993;29:183–192
56. Hoebel BG, Rada PV, Mark GP, Pothos EN. Neural systems for rein-forcement and inhibition of behavior: relevance to eating, addiction, and depression. In: Kahneman D, Diener E, Schwarz N, eds.Well-Being: The Foundations of Hedonic Psychology.New York, NY: Russell Sage Foundation; 1999:558 –572
57. McEwen BS. Protective and damaging effects of stress mediators.
N Engl J Med.1998;338:171–179
58. McEwen BS. Allostasis and allostatic load: implications for neuropsy-chopharmacology [see comments].Neuropsychopharmacology. 2000;22: 108 –124
59. Chrousos GP. The role of stress and the hypothalamic-pituitary-adrenal axis in the pathogenesis of the metabolic syndrome: neuro-endocrine
and target tissue-related causes.Int J Obes Relat Metab Disord.2000;24 S50 –S55
60. Bjorntorp P, Rosmond R. Neuroendocrine abnormalities in visceral obesity.Int J Obes Relat Metab Disord.2000;24:S80 –S85
61. Gohil BC, Rosenblum LA, Coplan JD, Kral JG. Hypothalmic-pituitary-adrenal axis function and the metabolic syndrome X of obesity.CNS Spectrums.2001;6:1– 8
62. Rosmond R, Bjorntorp P. The role of antidepressants in the treatment of abdominal obesity.Med Hypotheses.2000;54:990 –994
63. Hu PS, Young JR.Summary of Travel Trends. 1995 Nationwide Personal Transportation Survey. Washington, DC: US Department of Transporta-tion, Federal Highway Administration; 1999:1–54
64. Centers for Disease Control and Prevention. Fact sheet: youth risk behavior trends. 2001. Available at: http://www.cdc.gov/nccdphp/ dash/yrbs/00binaries/99yrbstrends.pdf
65. Putnam RD.Bowling Alone: The Collapse and Revival of American Commu-nity. New York, NY: Simon and Schuster; 2000
66. Rosmond R, Bjorntorp P. The hypothalamic-pituitary-adrenal axis ac-tivity as a predictor of cardiovascular disease, type 2 diabetes and stroke.J Intern Med.2000;247:188 –197
67. Brunner E. Stress and the biology of inequality. BMJ. 1997;314: 1472–1476
68. Herman JP, Cullinan WE. Neurocircuitry of stress: central control of the hypothalamo-pituitary-adrenocortical axis. Trends Neurosci. 1997;20: 78 – 84
69. McEwen BS, Seeman T. Protective and damaging effects of mediators of stress. Elaborating and testing the concepts of allostasis and allostatic load.Ann New York Acad Sci.1999;896:30 – 47
WHAT SEPARATES MAN AND APE THESE DAYS IS THE THUMB
ACTION
“Kids and the Gadget-Crazed Use Theirs for E-mail; Finessing the ‘Splat’ ”
“In Tokyo, so many kids are pounding at new electronic gadgets with their
thumbs they’re known as ‘oyayubi sedai’—the ‘thumb generation.’ Nokia Corp.
sponsored a contest for the fastest Finnish thumbs, where 2700 players competed
to thumb tap the highest score in the “Snake” gave included on Nokia phones.
AT&T Wireless Services Inc. is running ads featuring powerful thumbs that poke
through mittens, boxing gloves and golf gloves, ready for action on a mobile
phone.
Being ‘all thumbs’ used to mean you were clumsy. But phones, wireless e-mail
devices, and all the other hand-held gadgets featuring ‘thumb boards’ are turning
thumbs into universal index fingers for a generation of teenagers, young adults and
high-tech businesspeople.”
Fowler GA.Wall Street Journal. April 17, 2002