Microcontroller and Android HMI Based Water Level
and Control System
Tri Lestariningsih
1,*, Budi Artono
1, Nur Asyik Hidayatullah
1and Hendrik Kusbandono
11State Polytechnic Madiun, Jl. Serayu No. 84 Madiun Indonesia
Abstract
Water is a basic human need in daily life. The use of water is used for various household needs for example for consumption, bathing, washing and so on. At present there are still many people who use water pumps to fill water reservoirs at home or in office buildings that are filled manually, so that problems often occur such as the level of water in the reservoir where water is unknown, it is possible that the situation of reservoirs can occur overflow or empty. Utilizing technology in this research will create a tool used to control the water level in the reservoir, which is "Microcontroller-Based Water Level Control System and Android HMI" which is an alternative in controlling and monitoring the water level in a reservoir automatically using an Android Smartphone. This tool is used to control and monitor water reservoirs automatically via Android HMI so that it can be controlled remotely. This tool is designed using a NodeMCU ESP8266 Microcontroller, a relay module that functions to turn on and turn off the pump, and one sensor, the HC-SR04 Ultrasonic Sensor which functions to measure the water level in the reservoir. And the android application used is Cayenne. The test result data is shown in the cayenne application in the form of setting the water height setpoint, the ON / OFF pump indicator and the height value in units of percent (%) and centimeter (cm).
Keywords: Water Level Control, Mikrokontroler, NodeMCU ESP8266, Android HMI, Cayenne. Received on 24 September 2018, accepted on 24 January 2019, published on 28 January 2019
Copyright © 2019 Tri Lestariningsih et al., licensed to EAI. This is an open access article distributed under the terms of the Creative Commons Attribution licence (http://creativecommons.org/licenses/by/3.0/), which permits unlimited use, distribution and
reproduction in any medium so long as the original work is properly cited.
doi: 10.4108/eai.28-1-2019.162807
*Corresponding author. Email:[email protected]
1. Introduction
The basic need of the Indonesian people is the availability of water to meet their daily needs. Even though Indonesia is a water country, some regions in Indonesia experience water crisis or water shortages caused by prolonged drought. The availability of clean water in Indonesia has many problems including the service and distribution of drinking water, the quality and the amount of water available[1]. Water crisis occurs because people use water without thinking without thinking that the surface water will shrink[2]. One way to overcome the occurrence of a water crisis is the need for high water reservoirs that can be controlled and monitored. Control and monitoring of water level in water reservoirs can be done automatically by using ultrasonic sensors. Control
water level sensors. Water level control using a microcontroller and water level sensor[3][4][5][6]. Integrate water level measurements monitored using Short Message Services (SMS)[7][8][9]. Ultrasonic Sensor Research from Microcontroller-Based Automatic Water Level Control is still found to be lacking, as it can only detect water discharges in a reservoir and is monitored using LCD alone and also cannot be controlled remotely. In this study will make an alternative in controlling and monitoring water level in a reservoir automatically using an Android smartphone so that it can be controlled remotely to complement the shortcomings of previous research[10][11]. In this reseach design a Water Level Control System Based on Microcontroller and Android HMI by utilizing the HC-SR04 ultrasonic sensor with data processing and regulating of all system activities created
using NodeMCU ESP8266 then the water level
information will be displayed through AndroidHMI in the
2. Methodology
2.1. Tool Schema
The initial stage of designing this tool requires an initial overview of how the system works from the tool. Broadly speaking, the design using ultrasonic sensors consists of NodeMCU, relays, ultrasonic sensors, water pumps, Android HMI, and reservoir water reservoirs. The schematic drawing in this tool is shown in the image below
Figure 1. Tool Schematic
2.2. Flowchart
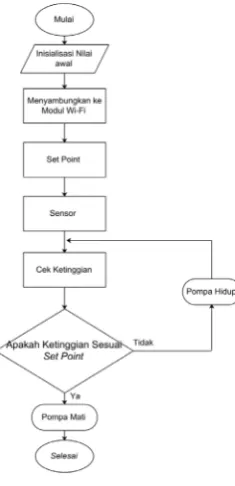
The tool to be made must have a proper work flow diagram and in accordance with the plans that have been prepared. To facilitate the process of making tools, a flowchart is made. Flowchart is a general description of the working principle of the tool to be made. By making a flow chart first, the concepts and general description of the device made will appear clear. The working process flow chart of the tool can be seen in the following figure.
Figure 2. Flowchart
The program starts with a start which means the circuit is turned on. The program performs initial initialization which is connected to the ultrasonic sensor circuit. After that the ultrasonic sensor is used to measure the height of the water level.When the reservoir is empty, the pump will start and fill the reservoir. If the water level reaches the upper limit setpoint, the pump will shut down and the water level results in the reservoir reservoir will be displayed on Android HMI. Then the ultrasonic sensor will continue to work and when the water level reaches the lower limit setpoint then the pump will start and the results of the water level on the reservoir reservoir will be displayed on the Android HMI.So, the reservoir water that we use automatically will not be empty because before the reservoir is at a predetermined setpoint, the water pump will start automatically.
2.3. Microcontroller Planning
Figure 3. Microcontroller Design
2.4. Breadboard Power Supply Planning
On the Installation of the breadboard power supply has one DC input from the power supply and there are several output options. The USB output is connected to the microcontroller input while the 5v output is connected to each component input to be used. Here is a picture of the installation on a breadboard power supply:
Figure 4. Planning Breadboard Power Supply
2.5. Ultrasonic Sensor Planning
In the system using the HC SR04 ultrasonic sensor where this sensor has a fairly good accuracy and data readings are quite stable. Operations are not influenced by sunlight or dark colored material, but are influenced by acoustic material. The first installation connects the VCC sensor with a 5V microcontroller then connects the triggered pin with one of the pins on the microcontroller and also the echo pin with one of the pins on the microcontroller and don't forget to connect the GND Sensor with the GND microcontroller. Next is the installation on the Microcontroller:
Figure 5. Planning of Ultrasonic Sensors
2.6. Relay Module Planning
pins are GND, VCC, and IN pins. GND for ground or voltage 0 volt (-), VCC For positive voltage + 5v, While IN to enter from the other sensors that function to move a sensor relay. While the output has 3 connections namely : 1. COM: the pin used in general or commond
2. NO (Normally Open):There is no contact between the common pin and pin NO. So when you trigger the relay, connect to the COM pin and supply is provided for the load
3. NC (Normally Closed):there is a contact between the common pin and the NC pin. There is always a connection between COM and NC pins, even when the relay is turned off. When you trigger the relay, the circuit is opened and no supply is provided for the load.
Figure 6. Relay Module Planning
2.7. Designing Applications on Android HMI
To make an Android smartphone as a monitoring tool that can display water level values in a reservoir and detect the state of the pump an application will be made on the Cayenne software. Making this application online on the website: http: // mydevices.com. Planning for making an application can be seen in Figure 7 below
Figure 7. Application Planning
appearance as needed.Display design on cayenne can be seen in Figure 8. below
Figure 8. Display Design on Cayenne
3. Results and Analysis
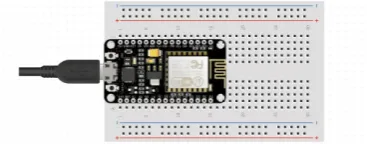
3.1. NodeMCU Board Testing
Testing the NodeMCU ESP8266 board is very important to do. Considering NodeMCU ESP8266 as one of the processors in this research tool.NodeMCU ESP8266 board testing aims to determine whether the program that has been uploaded (upload) to NodeMCU ESP8266 is functioning properly or not. The following are the steps for testing the NodeMCU ESP8266 board:
1. The program was first created with Arduino IDE software.
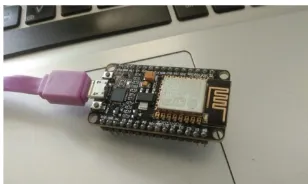
2. Connect the NodeMCU ESP8266 connector (mini usb) cable to the USB port of the laptop or PC being used.
Figure 9. ESP8266 NodeMCU Testing 3. After connecting, select the "Tools" menu then select
the NodeMCU ESP8266 board. Then also select the detected port.Arduino board and port selection can be seen in the image below:
Figure 10. Selection of the Arduino Board and Port
4. Compile the program needs to be done to ensure that the program created is correct. After compiling it, there will be a done compiling notification as shown in the image below
Figure 11. Notification of Done Compiling
5. Uploading compiled programs to the NodeMCU
ESP8266 board. When the done uploading notification appears, the program has successfully uploaded to the NodeMCU ESP8266 board. Notice of done uploading can be seen in the image below:
Figure 12. Done Uploading Notification
3.2. Testing the Breadboard Power Supply
Module
Figure 13. Testing Breadboard Power Supply
3.3. Testing of HC SR-04 Ultrasonic Sensor
Based on Android HMI
The HC SR04 Ultrasonic Sensor is the single most important sensor in thisresearch. Testing the HC SR04 ultrasonic sensor aims to determine the level of accuracy of the distance readings made by the sensor. With the high accuracy of this sensor, it will affect the performance of the Water Level Control system so that the system can run well. The following steps were taken to test the HC SR04 ultrasonic sensor:
1. Connect the VCC to the HC SR04 ultrasonic sensor with a voltage of 5VDC and GND with the GND breadboard power supply module.
2. Connect the trigpin and echopin HC SR04 ultrasonic sensor with the pin specified on NodeMCU ESP8266. 3. Write the program to be used in the Arduino IDE
software according to the HC SR04 ultrasonic sensor specifications. Then upload the program to the NodeMCU ESP8266 board.
4. Next monitoring the reading value of the HC SR04 ultrasonic sensor using Android HMI.
From the tests that have been done, the height of the reservoir or the distance of the sensor is 35 cmSo the water level reading that is displayed on Android HMI is:
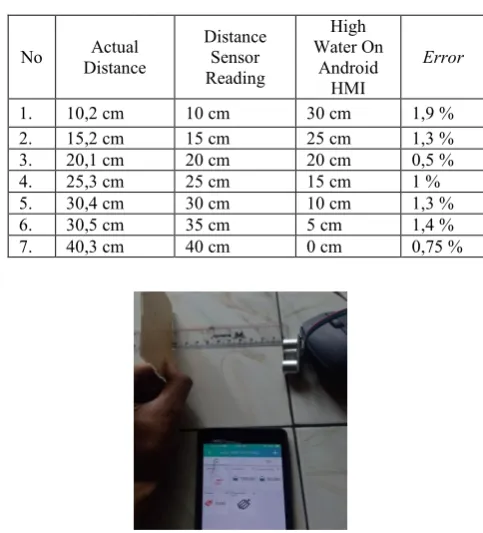
The following is a table and image of the ultrasonic sensor measurement test results for objects placed on Android HMI
Table 1. Test Results of 30 cm Setpoint Ultrasonic Sensor
Figure 14. Sensor Test Results with a Distance of 10cm
3.4. Testing the Relay Module based on
Android HMI
Relay module testing aims to turn on and turn off 1 phase pump and simultaneously monitored with Android HMI. Following the relay module testing steps are as follows: 1. Connect the VCC on the relay module with a voltage
of 5VDC and GND with the breadboard power supply GND module.
2. Connect the relay pin to the pin specified on NodeMCU ESP8266.
3. Next, monitor the reading value of the relay module using Android HMI.
The relay circuit is shown in the following figure:
Figure 15. Relay Circuit No Distance Actual Distance Sensor
Reading
High Water On
Android HMI
Error
1. 10,2 cm 10 cm 30 cm 1,9 % 2. 15,2 cm 15 cm 25 cm 1,3 % 3. 20,1 cm 20 cm 20 cm 0,5 %
4. 25,3 cm 25 cm 15 cm 1 %
5. 30,4 cm 30 cm 10 cm 1,3 %
6. 30,5 cm 35 cm 5 cm 1,4 %
7. 40,3 cm 40 cm 0 cm 0,75 %
Figure 16. Android display for relay
From the tests that have been carried out, it can be analyzed and concluded that when the pump on Android is 1 or the indicator is on, the pump is on (filling), if the pump is 0 or the indicator is off, the pump is dead. Often an error occurs on the indicator on or off the pump due to an unstable internet connection.
3.5. Android Application Testing
Testing tool on Android using the Cayenne application. Before testing the program must have been transferred first, so that no one experiences an error during data transfer and wait until the data transfer to Android is successful.There are several steps that must be known, as a reminder to make sure the program has been transferred successfully without any errors, for the test step can be explained as follows:
1. Make sure the program has been transferred to the Cayenne application.
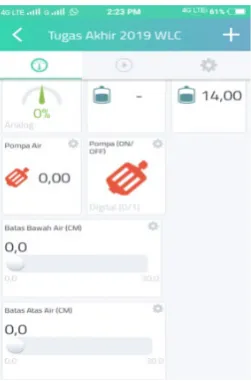
2. Water discharge in reservoirs and water presentations can be monitored on Cayenne, explained as follows:
Figure 17. Discharge Display and Water Percentage From Figure 17.it is explained that there are animated water reservoirs on Android. The animation of the reservoir is used as an indicator of the level or percentage
of water content in the reservoir. Indicator values can vary in height according to the water content in the reservoir. 3. At the circuit work we can adjust the water pump on
and off as you wish by sliding the numeric data slider on Android, explained in the picture as follows :
Figure 18. Pump Setpoint ON and OFF In figure 18. explained for the lower limit of water setpoint means that in the series we enter the lowest water data in units of cm in the reservoir so that the pump can fill and for the setpoint for the upper limit of water means entering the water data in units of cm in the highest reservoir for the water pump to stop filling.
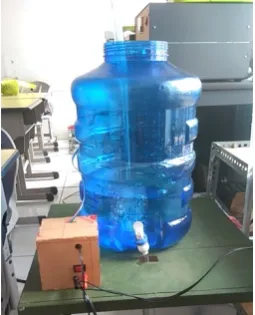
3.6. Overall Testing Tool
Testing this overall tool as well as finishing in the manufacture of this tool. The following are the steps for installing tools and materials used in the tool :
1. Place the reservoir in accordance with the place that was made before.
2. Install and chain the water pipes in accordance with the paths on the pump.
3. Place the HC SR-04 Ultrasonic Sensor on the top of the reservoir.
4. Fill the water at the bottom (as a source of water) and put the pump on that part.
5. Enter the voltage source on the device to test the device.
Figure 19. Overall Tool Testing Testing is done with 2 setpoints as follows:
a. Test with Setpoint upper limit of 10 cm and lower limit of 5 cm
lower limit of the water that is 6 cm, the pump will start with the following test results:
Figure 20. Display of Android during the first test
Figure 21. Setpoint Testing upper limit of 10cm
Figure 22. Setpoint testing the lower limit of 5cm b. Test with setpoint upper limit 15 cm and lower limit 6
cm
The second test is when the water level reaches 15 cm, the pump will die and when the water level has reached the bottom limit of water, which is 5 cm, the pump will turn on.
Figure 23. Android display during the second test
Figure 24. Setpoint Testing upper limit of 15cm
Figure 25. Setpoint testing the lower limit of 6cm From the tests that have been done, it can be analyzed and concluded that when the water level is below the lower limit of the setpoint, the pump will start and when the water level reaches the upper limit, the pump will die. On the results of monitoring tools often occur reading delay on Android HMI due to an unstable internet connection.
Microcontroller and Android HMI" there are conclusions as follows:
1. The working system of this tool is that the whole program is controlled by NodeMCU ESP8266 and uses an ultrasonic sensor used to measure water levels. 2. For monitoring including input set point for water level, pump ON / OFF indicator and water level values in percent (%) and centimeter (cm) units displayed on the Cayenne application.
3. For control, it is used to automatically turn on and turn off 1 phase water pump which is ordered from the Microcontroller program by using the relay module. 4. Internet connection speed is very influential when
testing tools.
References
[1] Tempo.co, “Indonesia di Ambang Krisis Air,” Tempo Media Group, 2015. [Online]. Available: https://nasional.tempo.co/read/1250490/pemerinta h-segera-hapus-imb-demi-mempercepat-investasi. [2] United Nations Development Program (UNDP), “Redefining Security: The Human Dimension,” Curr. Hist., vol. 94, h. 229.
[3] S. M. M. R. S.M. Khaled Reza, S. Ahsanuzzaman, “Microcontroller Based Automated Water Level Sensing and Controlling: Design and Implementation Issue,” in Proceedings of the World Congress on Engineering and Computer Science (WCECS), 2010.
[4] O. O. F. Ejiofor V.E., “Microcontroller based Automatic Water Level Control System,” Int. J. Innov. Res. Comput. Commun. Eng., vol. 1, no. 6, 2013.
[5] D. E. J. S. Nur Asyik Hidayatullah, “Desain Dan Aplikasi Internet of Thing (IOT) untuk Smart Grid Power System,” J. Ilm. Pendidik. Tek. Elektro, vol. 2, no. 1, pp. 35–44, 2017.
[6] Z. J. M. Asaad Ahmed M.E., “Automatic Water Level Control System”,” Int. J. Sci. Res., vol. 4, no. 12, 2015.
[7] et al Ayob Johari, “Tank Water Level Monitoring System using GSM Network,” Int. J. Comput. Sci. Inf. Technol., vol. 2, no. 3, 2011.
[8] N. W. A. dan A. Z. Ya, “Design of Electronic Load Controller By Using Combination Method for Micro-Hydro Power Plant And Its Control and Monitoring Program Simulation “, Internasional Journal of Electrical Electronics and Data Communication,” Int. J. Electr. Electron. Data Commun., vol. 3, no. 6 June, 2015.
[9] dan S. J. C. Kathirvel, K.Porkumaran, “Design and Implementation of Improved Electronic Load Controller for Self Excited Induction Generator for Rural Electrification,” Sci. World J. Hindawi Publ. Corp., 2015.
[10] D. Setiawan, “Rancang Bangun Robot Mobil Kontrol Sederhana menggunakan Arduino Berbasis Android System,” J. Sains, Teknol. dan Ind., vol. 14, no. 1, pp. 101–107, 2016.