CH. Naveen Kumar et al., J. Sci. Res. Phar. 2015, 4(1), 19-32
Journal of
Scientific
Research in
Pharmacy
Research Article
Available online through
ISSN: 2277-9469
www.jsrponl
ine.com
Stress Degradation studies and Develpoment of Validated Stability Indicating Assay Method by RP-HPLC
for Simultaneous Estimation of Naltrexone and Bupropion in the presence of degradation products as per
ICH Guidelines
CH. Naveen Kumara, b*, N. Kannappanb, Mahendra Kumar CBc *aBright Labs, Kothapet, Dilshuknagar, Hyderabad, Telangana, INDIA.
bDepartment of Pharmacy, Faculty of Engineering and Technology, Annamalainagar, Annamalai University, Chidambaram, Tamilnadu, INDIA.
cDepartment of Pharmacy, St. Mary’s College of Pharmacy, Secunderabad, Telangana, INDIA.
Received on: 23-12-2014; Revised and Accepted on: 02-02-2015
ABSTRACT
T
he aim of the present study was to establish the inherent stability and stability indicating assay method for simultaneous determination of naltrexone and bupropion after being subjected to International conference on harmonization stress conditions, such as hydrolysis, oxidation, heat, and photolysis. The quantification was carried out using Waters symmetry C18 (150x4.6 ID) 3.5 μm column at an Room temp (20-250c) and mobile phase comprised of Potassium dihydrogen phosphate buffer pH - 4.5: Acetonitrile in the proportion ratio of (30:70 v/v)in Isocratic mode. The flow rate was 1.0 ml/min and the effluent detection was performed and monitored at 228 nm using photodiode array (PDA) detector. The retention time of naltrexone and bupropion were 2.539 & 5.346 mins respectively. The method was validated in terms of linearity, precision, accuracy, and specificity, limit of detection and limit of quantitation. The method calibration curves were found to be linear over the concentration range of 5-25µg/ml for naltrexone drug, 56.25-281.25µg/ml for bupropion drug respectively and the range and correlation coefficient was found to be (r2= 0.9998). The percentage recoveries of both the drugs were 98.95-101.22%and 98.46-100.98% for naltrexone and
bupropion respectively from the tablet formulation.Limit of detection(LOD)were 0.387 & 1.297μg/mL and limits of quantification (LOQ) were 1.292 and 4.326μg/mL.Degradation products resulting from the stress conditions did not interfere with the detection of naltrexone and bupropion so The proposed method is suitable for simultaneous determination of naltrexone and bupropion in pharmaceutical dosage form and bulk drugs.
Keywords: Naltrexone, Bupropion, Stability Indicating, Forced Degradation studies, RP-HPLC, Method Validation.
INTRODUCTION
T
he multidrug therapy is a well-known technique for administration of two more active drug components in a single dosage form; it has better patient acceptability due to reduced number of dosage forms to be taken at a time. There are many Analytical methods are extensively available for single drug formulations but due to complexity in multicomponent formulations, stability Indicating method development for multiple drugs formulation is a challenge and scope for new developments. The present research work is focused to develop a proper solvent system and method development by Reverse Phase High Performance Liquid Chromatography (RP-HPLC) for the analysis of multi-drug combination including naltrexone and bupropion and to validate the developed process as per the ICH guidelines[1].The stress testing of the new drug substance is carried out according to stability test guideline Q1A (R2) issued by ICH for establishing its inherent stability characteristics and for supporting the suitability of the proposed analytical procedure[2-4].
Naltrexone (NTX) is chemically
(5α)-17-(cyclopropylmethyl)-4,5-epoxy-3,14-dihydroxymorphinan-6-one hydrochloride (Fig. 1).The main use of naltrexone is for the treatment of alcohol dependence[4-6]. NTX is used in the treatment of alcoholism.Naltrexone was approved by the U.S. Food and Drug Administration (FDA) for the treatment of alcohol dependence in 1994, following publication of the first two randomized, controlled trials in 1992. Since then a number of studies have confirmed its efficacy in reducing frequency and severity of relapse to drinking[7]. The multi-centre combine study showed the usefulness of in a primary care setting without adjunct psychotherapy [8].BUP is chemically, (±)-2-(tert-butylamino)-1-(3-chlorophenyl)
propan-1-*Corresponding author:
CH. Naveen Kumar
one(Fig. 2),an atypical antidepressant and smoking cessation aid. It acts as a norepinephrine and dopamine reuptake inhibitor as well as α3 β4 nicotinic receptor antagonist[9-11]. Presently, combination of these two drugs as a controlled release tablet is under clinical trials for the treatment of obesity Literature survey reveals that a very few physico-chemical methods appeared in the literature for the determination of NTX in pharmaceutical formulations. The methods so far reported include. A LC electro spray Tandem MS method for the analysis of NTX in canine plasma employing a molecular model to demonstrate the absence of internal standard deuterium isotope effects [12]. Nano level detection of NTX in its pharmaceutical preparation at Au microelectrode in flowing solutions by fast fourier transforms continuous cyclic voltammetry as a novel detector[13-15]. However, there were only few validated HPLC-UV/PDA methods reported so far for the simultaneous estimation of NTX and BUP in combination but there are no reported stability indicating methods for NTX and BUP. Hence, the main objective of the present study was to develop a validated stability indicating RP-HPLC-PDA method for the simultaneous estimation of NTX and BUP in bulk and pharmaceutical dosage forms.
1. Experimental:
1.1. Materials and methods:
Pure sample of Naltrexone (NTX) and Bupropion (BUP) was obtained from KDPL Pharmaceuticals and other reagents such as Acetonitrile,methanol,ortho phosphoric acid, Potassium dihydrogen Phosphate and water used were of HPLC and milli-Q grade. All other chemicals used were of AR grade. Bupropion and Naltrexone(Contrave) Tablets were purchased from local pharmacy.
1.2 . Instrumentation:
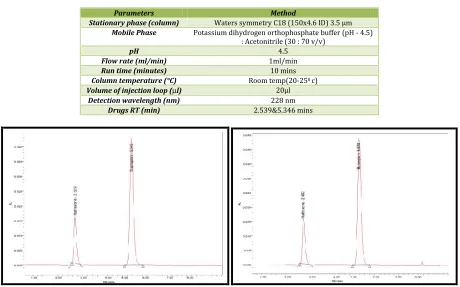
The analysis was performed using waters-2695(Model alliance) High Performance liquid chromatography waters auto sampler–PDA detector by using, Empower-software version-2, analytical balance (MettlerToledo) UV/Visible-Detector (Standard cell) and data handling system (Autochrome-3000), pH meter (lab India), Sonicator. The column used is Waters symmetry C18 (150x4.6 ID) 3.5 μm withthe flow rate 0.5ml/min (isocratic).
1.3.Preparation of Buffer solution (pH 4.5):
About1.36 g of Potassiumdihydrogen orthophosphate was accurately weighed and taken into 250 ml volumetric flask.Then add 150 ml of HPLC water, dissolve completely to get a clear solution.Make up the volume up to the mark with water. The pH was adjusted to 4.5 with Orthophosphoric acid and filtered through 0.45 μm membrane filter Sonicate for 15 min.
1.4. Diluent( Mobile phase ) Preparation:
Combination of Potassium dihydrogen orthophosphate buffer (pH-4.5) and Acetonitrile was mixed in the ratio of 30:70(pH was adjusted to 4.5 with Orthophosphoric acid and filtered through 0.45 μm membrane filter). This prepared solution was used as mobile phase. This solution was also used for specificity blank solution.
1.5. Preparation of blank solution:
Combination of Potassium dihydrogen orthophosphate buffer (pH-4.5) and Acetonitrile was mixed in the ratio of 30:70. This prepared solution was used as mobile phase. This solution was also used for specificity blank solution
1.6. Preparation of Placebo Solution:
The placebo Solution was prepared by Dissolving the Specified amount Excipients in diluent(in house made).
1.7. Preparation of STD stock solution:
Standard solution of Naltrexone and Bupropion were prepared by dissolving 10 mg of each drug into 10 mL volumetric flask separately. Then dilution was made by adding 10 mL of the Diluent solution to 10 mL standard flask and making up the volume with the Diluent. The final concentration of each drug was found to be 1000µg/ml.
1.8. Preparation of STD solution:
From the Prepared individual Standard Stock Solution of Naltrexone and Bupropion take 0.1 ml of Naltrexone and 1.125ml Bupropion into a 10ml of standard flak to this add 3ml of diluent. Finally make up the solution upto the mark with diluent. The Final concentration of the Naltrexone was 10 µg/ml and Bupropion 112.5 µg/ml respectively.
1.9. Preparation of Test solution:
The test solution was prepared by taking an equivalent amount of Bupropion and Naltrexone tablet powder (In house made) into a 10ml of volumetric flask make up with diluent,from
maintained at Room temp(20-250c),volume of injection loop was 20µl.detection was monitored at 228 nm.(Table 1).
1.11. Method validation:
The method validation was done according to the ICH guidelines. The following validation characteristic parameters areaccuracy, precision, linearity, and specificity, LOD, LOQ and robustness.
1.11.1. Linearity and range:
Linearity of the method was studied by the injecting the mixed standard solutions with the concentration ranges from of 5-25µg/mL for naltrexone drug, 56.25-281.5-25µg/mL for bupropion drug levels of target concentrations were prepared and injected six times into the HPLCsystem keeping the constant injection volume. The peak areas were plotted against the concentrations to obtain the linearity graphs.
1.11.2. Precision:
The precision of the optimized method was evaluated by carrying out six independent assays of test sample. %RSD of six assay values was calculated. Intermediate precision was carried out the samples by using another instrument and with different analyst.
1.11.3. Limit of Detection and Quantification:
The LOD and LOQ procedures were performed on samples contain very lower concentrations of analytes under the ICH guidelines. By applying the visual evaluation method, LOD was expressed by establishing the lowest concentration at which the analyte can be detected. LOQ was considered as the lowest concentration of analytes that can be detected and quantified, with acceptable accuracy and precision.
1.11.4. Robustness:
Robustness was studied by evaluating the effect of small variations in the chromatographic conditions. The conditions studied were flow rate altered by ±0.1ml/min, mobile phase composition with methanol ±5ml. These chromatographic variations are evaluated for resolution between NTX and BUP.
1.11.5. System suitability:
The system suitability parameters with respect of tailing factor, theoretical plates, repeatability and resolution between NTX and BUP peaks were defined.
1.11.6. Specificity:
The specificity of the analytical method is the ability of the method to estimate the analyte response in the presence of additional components such as impurities, degradation products and matrix. The peak purity of NTX and BUP were assessed by comparing the Retention time of standard NTX and BUP good correlation was obtained between the Retention time of standard and sample of NTX and BUP.The specificity method was also evaluated to ensure that there were no interference products resulting from forced degradation studies.
1.11.7. Forced degradation study:
Forced degradation or Stress testing of a drug substance will help to identify the degradation products, which can help to establish the intrinsic stability of the molecule .All stress decomposition studies were performed at an initial drug concentration 200µg/mL of NTX and 20µg/mL of BUP.
CH. Naveen Kumar et al., J. Sci. Res. Phar. 2015, 4(1), 19-32
and analyzed in the HPLC. It expressed there is no additional peaksat the retention time of NTX and BUP in the chromatograph it indicates that there is no placebo interference.
Acid Degradation:
Sample was treated with 3ml of 1N hydrochloric acid and kept for 10hrs. After 10hrs the solution was neutralized with 3ml of 1N sodium hydroxide, made the volume upto the mark with mobile phase and analyzed using HPLC.
Alkali Degradation:
Sample was treated with 3ml of 1N sodium hydroxide and kept for 10hr. After 10hr the solution was neutralized with 3ml of 1N hydrochloric acid, made the volume up to the mark with mobile phase and analyzed using HPLC.
Oxidative Degradation:
NTX and BUP solutions of 200 and 20μg/ml were mixed with 3mL of 30%v/v aqueous hydrogen peroxide solution and kept for 10hrs. After 10hrs made the volume up to the mark with mobile phase and analyzed using HPLC.
Photolytic Degradation:
The samples were kept under UV light for different time intervals (15mins – 7days) and made the volume upto the mark with mobile phase and analyzed using HPLC. Thermal Degradation: Samples were heated at 800 C for 15mins -60mins and 2200 C for 2‐5mins and analyzed.
1.11.8. Accuracy:
Accuracy was carried out by applying the method to drug sample (NTX and BUP combination of tablets) to which known amounts of NTX and BUP. Standard powder corresponding to 50,100 and 150% of label claim was added, mixed and the powder was extracted and determined by the system in optimized mobile phase. The experiment was performed in triplicate and percentage recovery, % RSD was calculated.
1.11.9. Analysis of marketed formulation:
The marketed formulation was assayed by above description. The peak areas were monitored at 262nm and determination of sample concentrations were using by multilevel calibration developed on the same HPLC system under the same conditions using linear regression analyzed for NTX and BUP in the same way as described above.
RESULTS AND DISCUSSIONS
T
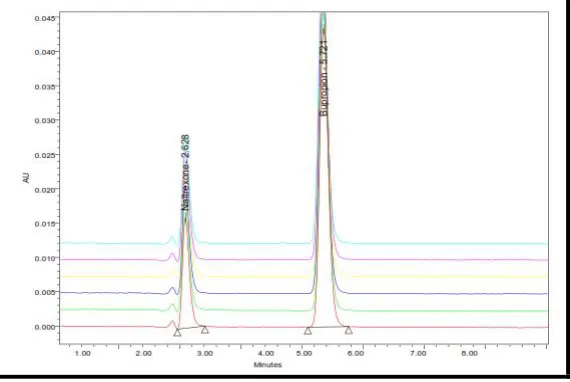
he simultaneous estimation of NTX and BUP was doneby RP-HPLC and in the optimized method the mobile phase consists of buffer Potassium dihydrogen phosphate buffer pH -4.5) :Acetonitrile (30:70 v/v)and the pH was adjusted to be 4.5. Then finally filtered using 0.45µ membrane filter paper and degassed in sonicator for 15minutes. The detection is carried out using PDA detector at 228nm.The solutions are following at the constant flow rate of 1.0 ml/min.The retention time for NTX and BUP was 2.539 & 5.346 minutes respectively. Linearity ranges for NTX and BUP were linear over the concentration range of 5-25µg/ml for naltrexone drug, 56.25-281.5-25µg/ml for bupropion drug respectively and the range and correlation coefficient was found to be (r2= 0.9998). The percentage recoveries of both the drugs were 98.95-101.22%and 98.46-100.98% for NTX and BUP respectively from the tablet formulation.Limit of detection (LOD) were 0.387 & 1.297μg/mL and limits of quantification (LOQ) were 1.292 and 4.326μg/mL. All The parameters value of RSD is less than 2.0% indicating the accuracy and precision of the method.1. Method Development and Optimization:
The HPLC procedure was optimized with a view to develop a suitable LC method for the analysis of NTX and BUP infixed dose for bulk and combined dosage form. It was found that mobile phase consists of buffer Potassium dihydrogen orthophosphate buffer pH - 4.5) :Acetonitrile (30:70 v/v) gave acceptable retention time (2.539& 5.346 minutes for NTX and BUP) , the theoretical plates, and good resolution for NTX and BUP at the flow rate of 1.0ml/min(Table. 1; Fig. 2, 3 & 3.1).
Table No. 1: Optimized Chromatographic Conditions
Parameters Method
Stationary phase (column) Waters symmetry C18 (150x4.6 ID) 3.5 μm Mobile Phase Potassium dihydrogen orthophosphate buffer (pH - 4.5)
: Acetonitrile (30 : 70 v/v)
pH 4.5
Flow rate (ml/min) 1ml/min
Run time (minutes) 10 mins
Column temperature (°C) Room temp(20-250c)
Volume of injection loop (l) 20µl
Detection wavelength (nm) 228 nm
Drugs RT (min) 2.539&5.346 mins
1. Standard 2. Sample 3.Blank
Fig. 3.1: 3D Chromatogram plots for NTX and BUP by PDA detector
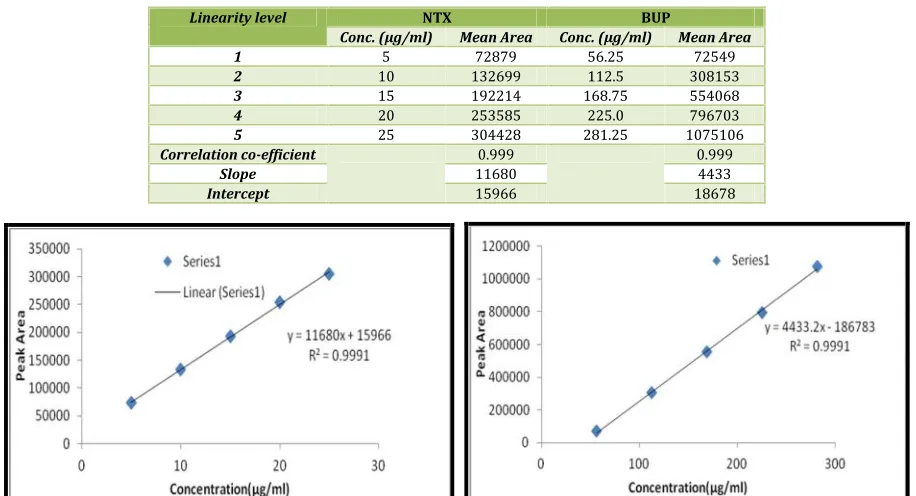
2. Validation of Developed Method: 2.1. Linearity:
The linearity five levels of concentrations with correlation regression curves are obtained the conc. range of 5-25µg/mL for NTX, 56.25-281.25µg/mL BUP. The reports of drug were found to be linear in prepared concn range & a correlation regression equation
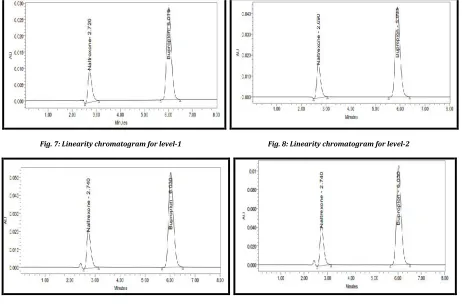
of NTX was y = 11680x+15966 with correlation coefficient 0.9994 (Fig. 4) and for BUP was y = 4433x+18678with correlation coefficient 0.9991(Fig. 5).Where X was the conc of the drug in µg/ml & Y was area of the peak in the absorbance unit. The chromatograms were obtained during the linearity were shown in theFig. 6-11 & Table 2.
Table No. 2: Linearity study of NTX and BUP
Linearity level NTX BUP
Conc. (µg/ml) Mean Area Conc. (µg/ml) Mean Area
1 5 72879 56.25 72549
2 10 132699 112.5 308153
3 15 192214 168.75 554068
4 20 253585 225.0 796703
5 25 304428 281.25 1075106
Correlation co-efficient 0.999 0.999
Slope 11680 4433
Intercept 15966 18678
Fig. 4: Linearity curve for standard NTX Fig. 5: Linearity curve for standard BUP
CH. Naveen Kumar et al., J. Sci. Res. Phar. 2015, 4(1), 19-32
Fig. 7: Linearity chromatogram for level-1 Fig. 8: Linearity chromatogram for level-2
Fig. 9: Linearity chromatogram for level-3 Fig. 10: Linearity chromatogram for level-4
Fig. 11: Linearity chromatogram for level-5
2.2. Precision:
Precision of this analysis, as the intraday precision was evaluated by performing five individual test samples prepared & calculated the % RSD. Interday precision of this method was analyzed by the performing same the procedure with the various
days by the person with the same developed environment. The % RSD values of the intra-day precision & interday precision study was < 2.0% for NTX and BUP. This is confirmed that method was precise and overlain chromatogram (Fig. 12) and Resulting data of precision was given in the(Table 3).
Table No. 3: Precision study of NTX and BUP
Replicate Area of NTX Area of BUP
Intra-day
precision Inter-dayprecision Intra-dayprecision Inter-dayprecision
1 439095 436949 127305 132443
2 435462 435877 128143 130445
3 435350 431699 126372 128713
4 436814 432385 128904 128211
5 436839 433739 127376 132105
Mean 436712 434129.8 127620 130383.4
St. dev. 1510.19585 2242.01008 953.736075 1918.28121
Figure 12: Overlay precision Chromatogram for NTX and BUP
2.3. LOD and LOQ:
Limit of detection (LOD) & the limit of quantifications (LOQ) are evaluated by the serial dilutions of NTX and BUP stock solutions in the ordered to be obtaining the signal to the noise ratio
3:1 for the LOD & 10:1 for the LOQ. Then the LOD value for NTX and BUP were found to be 0.387 & 1.297μg/mL & the LOQ value 1.292 and 4.326μg/mL respectively. The chromatogram of the LOD and LOQ were shown in the(Figure 13 & 14).
Fig. 13: Chromatogram of LOD study of NTX and BUP Fig. 14: Chromatogram of LOQ study of NTX and BUP
2.4. Specificity:
The specificity is a method for drug establishing by the verifying for the interferences with drug quantification from degradation products are formed during forced degradation study
and peak purity for NTX and BUP was found better under the various conditions. There were no other interferences of any other peaks degradated product with the drug peaks.
Table No. 4: System suitability parameters for NTX and BUP
System suitability parameters NTX BUP
Retention time (min) 2.539 5.346
Repeatability of retention time;
%R.S.D (n=5) 0.01 0.05
Repeatability of peak area;
%R.S.D= (S.D./Mean)×100 0.7 0.4
Resolution (Rs) - 9.37
Tailing factor (asymmetric factor) 1.32 1.18
USP plate count 2624 4635
LOD (μg/mL) 0.387 1.297
LOQ (μg/mL) 1.292 4.326
2.5. Robustness:
The robustness is studied by the evaluating effects of small but the deliberate differences in method condition. The condition is Flow rate (± 0.1/min) and MP composition (altered by ± 5% organic solvent using 40:60 and 20:80v/v buffer: methanol). The results of robustness for developed methods were started in the
CH. Naveen Kumar et al., J. Sci. Res. Phar. 2015, 4(1), 19-32
Table No. 5: Evaluation data of Robustness study of NTX and BUPParameters Adjusted to Mean Areaa Mean RT SD % RSD
NTX Flow Rate As per method
1.0ml/min 0.9 ml/min1.1ml/min 196780119315 3.0151.982 3685.62183.7 1.870.92 Mobile Phase (30:70)
(Buffer:Methanol) 40:6020:80 144800154856 2.5842.568 2557.81206.9 1.170.77 BUP Flow Rate As per method
1.0ml/min 0.9 ml/min1.1ml/min 628876407065 6.6074.027 4623.64072 0.731.1 Mobile Phase (30:70)
(Buffer:Methanol) 40:6020:80 519570553765 6.5863.962 8296.37714.3 1.521.13
a= 5Replicates;aeach of the value was indicates for mean of 3 injections
Fig. 15: Chromatogram of NTX and BUP (0.9 ml/min flow rate) Fig. 16: Chromatogram of NTX and BUP (1.1 ml/min flow rate)
Fig. 17: Chromatogram of NTX and BUP Fig. 18: Chromatogram of NTX and BUP
[Buffer: Methanol (40:60v/v)] [Buffer: Methanol (20:80v/v) ]
2.6. Ruggedness:
The ruggedness was studied by evaluating by different analysts but in the same chromatographic conditions. The results of ruggedness of developed method are started in the(Table 6).The results are shown during by different analysts but in the same
chromatographic condition of the test solution wasn’t affected & in the accordance with the actual. The suitability parameters are also been found good; hence this method was concluded as rugged. Chromatograms are obtained during ruggedness was shown in the (Fig. 19-24).
Table No. 6: Evaluation data of Ruggedness study of NTX and BUP
ID Precisions No. of Injections NALTREXONE DRUG BUPROPION DRUG
Peak Area RT Peak Area RT
ID Precision – 1 12 132443130445 2.0922.093 436949435877 4.3274.33
3 128713 2.094 431699 4.331
ID Precision – 2 12 128211132105 2.0942.095 432385433739 4.3324.333
3 126517 2.096 435272 4.333
MEAN 129738.9 2.094 434319.9 4.331
STDEV 2331.2 0.0014 2058.8 0.00228
Fig. 19: Chromatogram of NTX and BUP [ID Precision-1 (Inj - 1)] Fig. 20: Chromatogram of NTX and BUP [ID Precision-1 (Inj - 2)]
Fig. 21: Chromatogram of NTX and BUP [ID Precision-1 (Inj - 3)] Fig. 22: Chromatogram of NTX and BUP [ID Precision-2 (Inj - 1)]
Fig. 23: Chromatogram of NTX and BUP [ID Precision-2 (Inj - 2)] Fig. 24: Chromatogram of NTX and BUP [ID Precision-2 (Inj - 3)]
2.7.Solution stability study:
Sample Stability was evaluated by shorting at the ambient temp & analysis was done in initial time, after 3hrs, 6 hrs, 12 hrs and 24 hrs. The analysis of the reports from all aged solutions was compared with those of from the freshly prepared solution (initial
solution). (Table 7 & 8)shows results are obtained the stability of solution study at various intervals for a test preparations and it was conformed that the test solutions were stable upto the 24hrs at the ambient temp, because difference in the measured & the original values were < 2.0 %.
Table No. 7: Evaluation of solution stability for NTX
Replicate Initial Area Area After 3 hrs Area After 6 hrs Area After 12 hrs Area After 24 hrs
1 127651 126947 125987 125364 124568
2 127376 126846 125469 124869 124376
3 128904 126742 125684 124963 124904
4 126372 126372 125368 124853 124372
5 128143 125876 125567 124962 124143
Mean 127689.2 126556.6 125615 125002.2 124472.6
St. dev. 937.58237 438.1299 238.6284 208.5994 284.2953
CH. Naveen Kumar et al., J. Sci. Res. Phar. 2015, 4(1), 19-32
Table No. 8: Evaluation data of solution stability for BUPReplicate Initial Area Area After 3 hrs Area After 6 hrs Area After 12 hrs Area After 24 hrs
1 434309 414256 414327 395478 384309
2 436839 422834 416659 395697 376839
3 436814 423643 426746 386452 376814
4 435350 425357 421467 384685 375350
5 435462 425654 420269 390245 375462
Mean 435754.8 422348.8 419893.6 390511.4 377754.8
St. dev. 1076.72267 4673.794 4770.261 5051.094 3732.336
% RSD 0.247 1.106 1.136 1.293 0.988
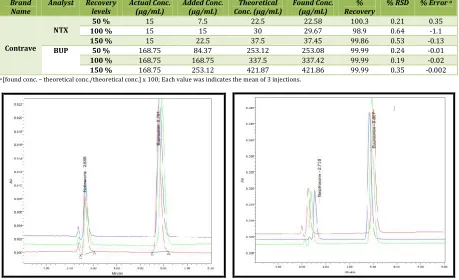
2.8. Recovery Studies (Accuracy):
The recovery of NTX and BUP was determined by the 3 various conc. levels. % recovery was found to be 99.86-100.30% for
NTX and 99.99-99.99% for BUP(Table 9). The results are indicating that this method was accurate. Chromatograms obtained during the study of accuracy were shown in(Fig. 25-27).
Table No. 9: Accuracy study of NTX and BUP
Brand
Name Analyst Recoverylevels Actual Conc.(μg/mL) Added Conc.(μg/mL) Conc. (μg/mL)Theoretical Found Conc.(μg/mL) Recovery% % RSD % Error
a
Contrave
NTX 100 %50 % 1515 7.515 22.530 22.5829.67 100.398.9 0.640.21 0.35-1.1
150 % 15 22.5 37.5 37.45 99.86 0.53 -0.13
BUP 50 % 168.75 84.37 253.12 253.08 99.99 0.24 -0.01
100 % 168.75 168.75 337.5 337.42 99.99 0.19 -0.02
150 % 168.75 253.12 421.87 421.86 99.99 0.35 -0.002
a[found conc. – theoretical conc./theoretical conc.] x 100; Each value was indicates the mean of 3 injections.
Fig. 25: Accuracy chromatogram for NTX and BUP level-1 (50%) Fig. 26: Accuracy chromatogram for NTX and BUP level-2 (100%)
the tablet powder was equivalent to the weight of each tablet was
Fig. 28: Chromatogram of acidic forced degradation of NTX and BUP
Fig. 29: Purity Plots for NTX and BUP in acidic forced degradation
Fig. 30: Spectrum index for NTX and BUP in acidic forced degradation
Alkaline degradation:
The Alkaline degradation was done by sample was treated with 3ml of 1N sodium hydroxide and kept the sample for 10hr. After 10hr solution was neutralized to add 3ml of 1N
CH. Naveen Kumar et al., J. Sci. Res. Phar. 2015, 4(1), 19-32
Fig. 31: Chromatogram of alkali forced degradation of NTX and BUP
Fig. 32: Purity Plots for NTX and BUP in alkali forced degradation
Fig. 33: Spectrum index for NTX and BUP in alkali forced degradation
Oxidative degradation:
The oxidative degradation was done by sample was mixed with 3mL of 30%v/v aqueous hydrogen peroxide solution and kept for 10hrs. After 10hrs made the volume upto the mark with
Fig. 35: Purity Plots for NTX and BUP in oxidative forced degradation
Fig. 36: Spectrum index for NTX and BUP in oxidative forced degradation
Photolytic degradation:
The photolytic degradation was done by exposing of drug content under the UV light for 15mins to 7days. There is 6.47% of
the drug degradation observed in the above specific photolytic degradation condition(Fig. 37-39 & Table 10 & 11).
Figure 37: Chromatogram of UV-light degradation of NTX and BUP
CH. Naveen Kumar et al., J. Sci. Res. Phar. 2015, 4(1), 19-32
Fig. 39: Spectrum index for NTX and BUP in Photolytic forced degradation
Thermal degradation:
The Thermal degradation is to be performing by the exposing the solid drug at the 80°C for 15mins to 60mins and at 220°C for 2-5mins. Resultant chromatogram of thermal degradation
study(Fig. 40-42 & Table 10 & 11)was indicates that the drug was found to be slightly stable under thermal condition. It was only 11.20% of the drug content were degraded.
Fig. 40: Chromatogram of thermal degradation of NTX and BUP
NTX Sample AreaStd Area 125406 124771 124134129406 125482 120115
% of Degradation 3.09% 3.58% 4.07% 3.03% 7.17%
BUP Sample AreaStd Area 424229 426382 424012435754 405744 400594
% of Degradation 2.64% 2.60% 2.69% 6.88% 8.06%
Average of % Degradation 4.41% 4.48% 5.41% 6.47% 11.20%
CONCLUSION
A
new RP-HPLC stability indicating method was described in this manuscript provides a simple, convenient and reproducible approach for the simultaneous estimation and quantification of Naltrexone (NTX) and Bupropion (BUP) in routine quality control analysisREFERENCES:
1. ICH,stability testing of new drugs substances and products, International conference on harmonization, IFPMA, Geneva, 2003.
2. ICH Topic Q 2 (R1) validation of Analytical Procedures: Textand methodology, note for guidance on validation of analytical procedures: text and methodology (CPMP/ICH/381/95), June1995.
3. International Conference on Harmonization; Draft Guidanceon specifications: Test Procedures and Acceptance Criteriafor New Drug Substances and Products: Chemical Substances, Federal Register (Notices), 2000; 65(251): 83041-83063.
4. FDA, Analytical Procedures and methods
validation:Chemistry, manufacturing, and Controls, Federal Register (Notices),2000; 65(169): 52776-52777.
5. Neil M.J.O. “The Merck Index - An Encyclopedia of Chemicals, Drug, Biological” Merck & Co. Inc,2007; 14th Edn. 1101. 6. Katzung B. G., Basic and Clinical Pharmacology, Mc. Graw
Hill, singapore,2005; 9th Edn, 375-7, 512-4
7. Sweetman SC, “Martindale - The complete drug reference,” Pharmaceutical press, London (UK),2007; 35th Edn. 1310. 8. The United State Pharmacopeial Convection United State
Pharmacopoeia. NF, asian edn.2007; 3: 2703-4.
9. Cantwell DP. ADHD through the life span: the role of bupropion in treatment, Journal of Clinical Psychiatry,1998; 59(4): 92-94.
10. Lief HI. Bupropion treatment of depression to assist smoking cessation,. American Journal of Psychiatry,1996; 153: 442-442.
11. The United State Pharmacopoeia, 26th Revision, Rockville MD: US Pharmacopoeial Convention Inc.,2004; 1277. 12. The Merck Index: An encyclopedia of chemicals, drugs, and
biological. 13th Edition, Merck research laboratories,2001; 1141.
13. The United State Pharmacopoeia, 26th Revision, Rockville MD: US Pharmacopoeial Convention Inc.,2004; 279. 14. Indian Pharmacopoeia, Vol - I,2010; 1748.
15. M Sabine; SW Toennes; F Gerold; W Jakel. J. Pharm. Biomed. Anal.,2004; 35: 169-176.
How to cite this article:
CH. Naveen Kumar et al.,: Stress Degradation studies and Develpoment of Validated Stability Indicating Assay Method by RP-HPLC for Simultaneous Estimation of Naltrexone and Bupropion in the presence of degradation products as per ICH Guidelines, J. Sci. Res. Phar., 2015; 4(1): 19-32.


![Fig. 19: Chromatogram of NTX and BUP [ID Precision-1 (Inj - 1)]Fig. 20: Chromatogram of NTX and BUP [ID Precision-1 (Inj - 2)]](https://thumb-us.123doks.com/thumbv2/123dok_us/8400275.1686387/8.612.77.537.35.176/fig-chromatogram-ntx-bup-precision-inj-chromatogram-precision.webp)