Effect of Nb and Ti Addition on Microstructure
and Hardness of Dual Two-Phase Intermetallic Alloys
Based on Ni
3Al-Ni
3V Pseudo-Binary Alloy System
K. Kawahara
1, T. Moronaga
1, Y. Kaneno
1, A. Kakitsuji
2and T. Takasugi
1;*1Department of Materials Science, Osaka Prefecture University, Sakai 599-8531, Japan 2Technology Research Institute of Osaka Prefecture, Izumi 594-1157, Japan
The microstructures and hardness property of dual two-phase intermetallic alloys that are composed of various kind of volume fractions of geometrically closed packed (GCP) Ni3Al(L12) and Ni3V(D022) phases was studied. Higher volume fraction of primary Ni3Al precipitates was
observed in the Ti and Nb added alloys when keeping Al content the same. Also, the microstructures in the eutectoid (channel) region consisting of Ni3Al+Ni3V were sensitive to alloying addition. The hardness of dual two-phase intermetallic alloys was basically explained by mixture rule
in hardness between primary Ni3Al precipitates and eutectoid region. Nb and Ti addition raised hardness of dual two-phase intermetallic alloys
by solid solution hardening in the constituent phases. This hardening was more significant in Nb addition than in Ti addition. In addition to hardness owing to the mixture rule, additional hardening arising from interfacial area between primary Ni3Al precipitates and eutectoid region
was found. With increasing Ni3Al/channel (eutectoid) interfacial area, the additional hardening increased. As temperature increases, the
additional hardening monotonously decreased for the base and Nb added alloys but little decreased for the Ti added alloys. [doi:10.2320/matertrans.M2010097]
(Received March 15, 2010; Accepted May 6, 2010; Published June 23, 2010)
Keywords: intermetallics, microstructure, hardness test, scanning electron microscopy, interfaces
1. Introduction
Ni3X intermetallics with geometrically closed packed
(GCP) structure1–3)possess very attractive properties as high temperature structural materials, for example, strength anomaly,4)high phase stability at high temperature and low
density. Among these Ni3X intermetallics, boron-doped
Ni3Al (L12) displays better ductility than other intermetallics
owing to sufficient number of slip systems activated in the grains and enhanced grain boundary cohesion.5) Expecting
superior mechanical property to mono-phase Ni3X
interme-tallics, multi-phase intermetallic alloys composed of Ni3X
intermetallics have been studied.6–14) Among so far studied
multi-phase intermetallic alloys, dual two-phase intermetallic alloys composed of Ni3Al and Ni3V (D022) have been
reported to display good mechanical and chemical properties, and therefore are promising as a next generation type of high temperature structural materials.8–14)
The dual-two phase intermetallic alloys are composed of ‘‘upper two-phase microstructure’’ with a micron scale and ‘‘lower two-phase microstructure’’ with a sub micron scale. According to the observed phase diagrams,7,12)the ‘‘upper
two-phase microstructure’’ composed of primary Ni3Al
precipitates and Ni solid solution (A1 phase) is formed at high temperature via A1 mono-phase microstructure after solidification. Then, prior A1 phase is decomposed into Ni3Al+Ni3V (so called ‘‘lower two-phase microstructure’’)
at low temperature by an eutectoid reaction, eventually resulting in dual two-phase microstructure.7,12) Such dual two-phase microstructures were shown to exhibit good crystallographic coherency among the constituent phases not only at a micron scale but also at a sub micron scale,
and therefore high phase and microstructure stability. Furthermore, preferable high-temperature tensile and creep strength exceeding many conventional super alloys15) were observed in the dual two-phase intermetallic alloys contain-ing Nb or Ti.8,10,12)
To furthermore improve mechanical property of the dual two-phase intermetallic alloys, several compositional and microstructural factors should be taken into consideration. In the previous study, some correlations between microstruc-tural factor and mechanical property were evaluated in the dual two phase intermetallic alloys based on Ni3Al-Ni3V
pseudo binary system containing 2.5 at% Nb.14)The volume
fraction of primary Ni3Al precipitates was found to be the
prime microstructural parameter controlling hardness of the dual two-phase intermetallic alloys. As the volume fraction of primary Ni3Al precipitates increases the hardness
de-creases, regardless of test temperature. Also, the interfacial
area between primary Ni3Al precipitates and channel
(eutectoid) region was found to be the sub microstructural parameter controlling the hardness of the dual two-phase intermetallic alloys.14)Furthermore, the effect of the lower
two-phase microstructure on the high-temperature tensile properties was evaluated, and shown to be less sensitive to aging time up to 1000 h at temperatures below the eutectoid temperature.13)
In the present study, high temperature Vickers hardness of the dual two-phase intermetallic alloys composed of Ni3Al
and Ni3V phases was evaluated in terms of the hardening due
to two constituents (i.e., owing to mixture rule) and the interfacial hardening due to interfaces between primary Ni3Al precipitates and channel region. Also, it was
inves-tigated how Nb and Ti addition to the dual two-phase intermetallic alloys affects two hardening mechanisms as a function of temperature.
*Corresponding author, E-mail: [email protected]
2. Experimental
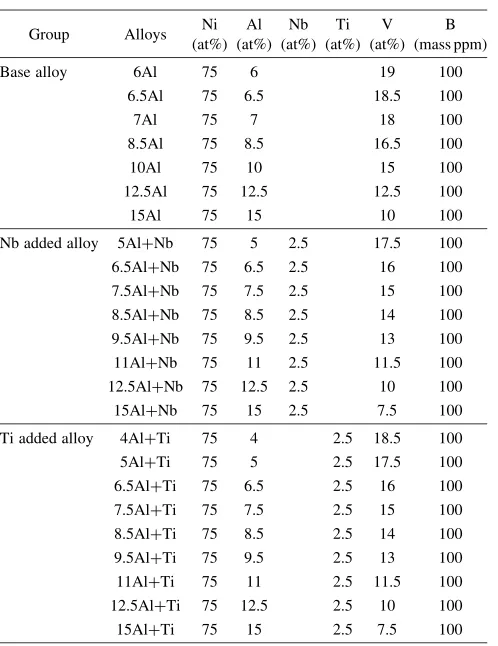
Base alloy compositions used in this study are expressed by Ni75AlXV25X(at%) and shown in Table 1. Contents of Al
(or V) were largely changed from 6 at% to 15 at% to prepare widely different upper two-phase microstructures in which the volume fraction of primary Ni3Al precipitates varies from
0% to 100% according to the reported phase diagrams.7,12,16)
In addition, two groups of alloy compositions, i.e., Nb added alloys (Ni75AlXNb2:5V22:5X) and Ti added alloys
(Ni75AlXTi2:5V22:5X) (Table 1) were prepared. Hereafter,
the alloys will be referred to as 6Al, 5Al+Nb and 4Al+Ti as listed in Table 1. Nb and Ti were substituted for the V sites in the base alloy compositions. Each alloy was doped with 100 mass ppm boron (B). The base, Nb added and Ti added alloy compositions prepared in this study are also plotted on the pseudo-binary phase diagrams of Ni3V-Ni3Al,16)Ni3
V-Ni3Al at 2.5 at% Nb content12)and Ni3V-Ni3Al at 2.5 at%Ti
content7)(Fig. 1).
Alloys used in this study were prepared from starting raw materials of 99.9 mass% Ni, 99.99 mass% Al, 99.9 mass% Nb, 99.9 mass% Ti, 99.9 mass% V and 99.9 mass% B. The alloy buttons with a diameter of 50 mm were prepared by arc melting in argon gas atmosphere using tungsten electrode and copper hearth. Each specimen for micro-structural observation and for hardness test was cut from arc melted buttons using an electro-discharge machine (EDM). The cut specimens were solution treated in a dynamic vacuum at 1573 K for 5 h, annealed at 1348 K for 1 h (resulting in upper two-phase microstructure), and then
simply cooled in furnace to room temperature (resulting in lower two-phase microstructure even without an intended aging treatment12,13)).
Microstructural observation of the dual two-phase inter-metallic alloys was carried out by a scanning electron microscope (SEM) and a transmission electron microscope (TEM). The heat-treated specimens were mechanically abraded on SiC paper and then electronically polished in a
Group Alloys Ni (at%)
Al (at%)
Nb (at%)
Ti (at%)
V (at%)
B (mass ppm)
Base alloy 6Al 75 6 19 100
6.5Al 75 6.5 18.5 100
7Al 75 7 18 100
8.5Al 75 8.5 16.5 100
10Al 75 10 15 100
12.5Al 75 12.5 12.5 100
15Al 75 15 10 100
Nb added alloy 5Al+Nb 75 5 2.5 17.5 100 6.5Al+Nb 75 6.5 2.5 16 100 7.5Al+Nb 75 7.5 2.5 15 100 8.5Al+Nb 75 8.5 2.5 14 100 9.5Al+Nb 75 9.5 2.5 13 100 11Al+Nb 75 11 2.5 11.5 100 12.5Al+Nb 75 12.5 2.5 10 100 15Al+Nb 75 15 2.5 7.5 100
Ti added alloy 4Al+Ti 75 4 2.5 18.5 100 5Al+Ti 75 5 2.5 17.5 100 6.5Al+Ti 75 6.5 2.5 16 100 7.5Al+Ti 75 7.5 2.5 15 100 8.5Al+Ti 75 8.5 2.5 14 100 9.5Al+Ti 75 9.5 2.5 13 100 11Al+Ti 75 11 2.5 11.5 100 12.5Al+Ti 75 12.5 2.5 10 100 15Al+Ti 75 15 2.5 7.5 100
1700
1400
1300
1200 1600
1500
T
e
mperature (K)
0 5 10 15 20 25
1100
L12+D022
A1
L12
1281K 1318K
D022
Ni3Al
Ni3V Al content (at.%)
Ni3Al(Nb=2.5) Ni3V(Nb=2.5) Al content (at.%)
L
A1
L12+A1
L12 L12+D022+A1
L12+D022 D022+A1
D022
1700
1400
1300
1200 1600
1500
T
emperature (K)
0 5 10 15 2022.5
1100
(b)
1700
1400
1300
1200 1600
1500
T
emperature (K)
0 10 15 20 22.5
A1
A1+L12
L12
L12+D022 D022
Ni3Al(Ti=2.5)
Ni3V(Ti=2.5) Al content (at.%)
(c)
5
Fig. 1 Pseudo-binary phase diagrams of (a) Ni3V-Ni3Al,16) (b) Ni3
V-Ni3Al containing 2.5 at% Nb,12)and (c) Ni3V-Ni3Al containing 2.5 at%
Ti7)on which alloy compositions used in this study are plotted by dotted
[image:2.595.318.533.76.608.2] [image:2.595.47.296.80.403.2]mixed solution of 15 ml H2SO4 + 85 ml CH3OH at 243 K.
TEM foils cut from the heat treated specimens were mechanically thinned to about 0.1 mm and finally jet polished in a mixed solution of 15 ml H2SO4 + 85 ml CH3OH at
253 K. TEM observation was carried out using a JEM-2000FX operating at 200 kV. As one of the microstructural characterization, the volume fraction of primary Ni3Al
precipitates (inversely, that of the eutectoid region) was measured enhancing color contrast of images between the primary Ni3Al precipitates and the channel region, with a
help of computer simulation. Also, the interfacial area,Sinterf.
between the primary Ni3Al precipitates and the channel
region was calculated, based on the expression, Sinterf.¼
4dN, where d is the side length of primary Ni3Al
precipitates andN is the number density of primary Ni3Al
precipitates. The size and number density of primary Ni3Al
precipitates were measured by a graphical method. These data were taken from several grains in which cube planes of primary Ni3Al precipitates are sectioned in parallel to
exposed plane (i.e., free surface), and then averaged in each alloy composition and heat treatment condition.
For Vickers hardness test, cylindrical specimens with a
dimension of 105mm were cut from the arc melted
button by EDM. In temperature range between room temper-ature and 1173 K, the Vickers hardness test was conducted in atmosphere of argon gas 90% + H210% in conditions of
a holding time of 20 s and a load of 1 kg. Hardness data points more than ten were collected and averaged in each experimental condition.
3. Results
3.1 Microstructure
The alloy buttons prepared in this study exhibited large columnar grains with a grain size of several hundred mm
which elongated along solidification direction. In the alloys at low Al content (the alloys 6Al, 5Al+Nb and 4Al+Ti), featureless microstructures were observed regardless of alloying addition. The featureless microstructures are wholly composed of the eutectoid region consisting of Ni3Al and
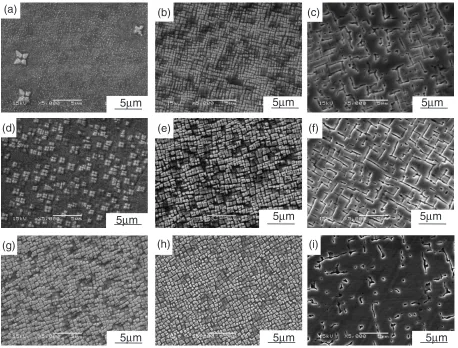
Ni3V phases. In the alloys at higher Al contents, the upper
two-phase microstructures are certainly composed of the primary Ni3Al precipitates and the channel (eutectoid)
region, as shown in Fig. 2. In the alloys in Al content range below 11 at%, isolated cuboidal primary Ni3Al precipitates
were observed regardless of Nb or Ti addition, while in the alloys at 12.5 Al content, the primary Ni3Al precipitates
coalesced each other regardless of Nb or Ti addition. In the alloys at 15 at% Al content, the microstructures were commonly prevailed by single phase Ni3Al. These results
were basically consistent with the reported Ni3Al-Ni3V
pseudo-binary phase diagrams (Fig. 1).7,12,16) However, if
5
µ
m
5
µ
m
5
µ
m
5
µ
m
5
µ
m
5
µ
m
5
µ
m
5
µ
m
5
µ
m
(a)
(b)
(c)
(d)
(e)
(f)
(g)
(h)
(i)
[image:3.595.70.528.71.419.2]comparing the microstructures at the same Al content, the
volume fraction of the primary Ni3Al precipitates was
apparently different among the three groups of alloys, that is, higher in the Nb and Ti added alloys than in the base alloys. This result will be again described later.
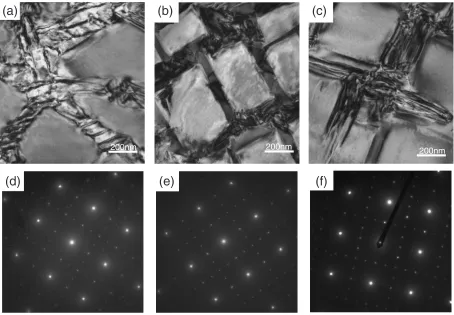
To investigate the lower two-phase microstructures, TEM analysis was performed on the alloys, 8.5Al, 8.5Al+Nb and 8.5Al+Ti (Fig. 3). Irrespective of the Nb and Ti addition, selected area diffraction patterns (SADP) taken from the channel area show coexistence of superlattice reflections due to L12structure of Ni3Al and D022variant structures of Ni3V.
In the alloys, 8.5Al and 8.5Al+Ti, well grown-up lamellar-like microstructures were observed. On the other hand, the alloy 8.5Al+Nb exhibited very fine microstructure, suggest-ing that phase separation to Ni3Al and Ni3V is not well
developed.
Figure 4 shows the relation between Al content and volume fraction of primary Ni3Al precipitates. The volume
fraction of the primary Ni3Al precipitates increases steadily
with increasing Al content. The volume fraction of the
primary Ni3Al precipitates also depended on alloying
elements, especially in low Al content region. The Ti and Nb addition raised the volume fraction of the primary Ni3Al
precipitates at the same Al content. Figure 5 shows the correlation between Al content and Ni3Al/channel interfacial
area,Sinterf.. It is noted that the base, Nb added and Ti added
alloys draw the peak ofSinterf. at 8.5 at% Al, 9.5 at% Al and
7.5 at% Al, respectively.
3.2 Hardness property
Vickers hardness data obtained at room temperature are plotted in Fig. 6 as a function of the volume fraction of the primary Ni3Al precipitates. Almost same curves were
drawn in the base, Nb added, and Ti added alloys although their levels were different. The highest hardness values were observed at 0 vol% of the primary Ni3Al precipitates
for three groups of alloys, in other words, in the alloys which the whole microstructure is dominated by the eutectoid region. The highest value remained up to about
200nm 200nm
(a)
(b)
(c)
(d)
(e)
(f)
200nm
Fig. 3 TEM bright field images of microstructures (a), (b), (c) and SADPs (d), (e), (f) from the eutectoid (channel) area in the alloys, 8.5Al (a), (d), 8.5Al+Nb (b), (e), and 8.5Al+Ti (c), (f), respectively. The alloys were solution treated at 1573 K for 5 h, annealed at 1348 K for 1 h, and then simply cooled in furnace to room temperature.
4 6 8 10 12 14 0
20 40 60 80 100
Al contents (at.%)
Volume fraction of primary L1
2
precipitates (%) Base alloy Nb addition Ti addition
[image:4.595.71.525.71.386.2] [image:4.595.321.533.456.609.2]50 vol% of the primary Ni3Al precipitates, and then the
hardness decreased with increasing volume fraction of the primary Ni3Al precipitates. The lowest hardness values
were eventually observed at 100 vol% of Ni3Al phase.
The addition of Nb and Ti raised the hardness of the alloys in a whole range of volume fraction of the primary Ni3Al precipitates although the hardness enhancement by
the Nb addition was more significant than that by the Ti addition.
The curves of hardness vs. volume fraction of the primary Ni3Al precipitates for the base, Nb added, and Ti added
alloys were measured at various temperatures and shown in Fig. 7. In all of three groups of alloys, the curves behaved in similar way for the temperature dependency: the hardness levels little decreased up to 873 K with increasing temper-ature but apparently decreased at tempertemper-atures beyond 873 K. Here, it is noted that the hardness decease at temperatures beyond 873 K was especially apparent in the Ti added alloys
4
6
8
10
12
14
0
2
4
6
8
Al contents (at.%)
Interfacial area, S
interf
(
×
10
6 m/m
2 )
Base alloy Nb addition Ti addition
Fig. 5 The correlation between Al content and L12/channel interfacial
area,Sinter.for the base, Nb added, and Ti added alloys.
0 20 40 60 80 100 200
300 400 500 600
Volume fraction of primary L12 (%) Vickers hardness (Hv) Base alloyNb addition
Ti addition
Fig. 6 Variation of Vickers hardness with the volume fraction of the primary Ni3Al precipitates for the base, Nb added, and Ti added alloys.
Data obtained at room temperature are plotted.
0 20 40 60 80 100 200
300 400 500 600
Volume fraction of primary L12(%)
V
ickers Hardness (Hv)
R.T. 573K 773K 873K 1073K 1173K
(a)
Base alloy
0 20 40 60 80 100 200
300 400 500 600
Volume fraction of prior L1
2(%)
V
ickers Hardness (Hv)
R.T. 573K 773K 873K 1073K 1173K
(b)
Nb addition
0 20 40 60 80 100 200
300 400 500 600
Volume fraction of primary L1
2(%)
V
ickers Hardness (HV)
R.T. 573K 773K 873K 1073K 1173K
(c)
Ti addition
Fig. 7 Variation of Vickers hardness with the volume fraction of the primary Ni3Al precipitates for the (a) base, (b) Nb added, and (c) Ti
[image:5.595.64.275.71.235.2] [image:5.595.321.530.77.229.2] [image:5.595.84.509.287.632.2]with a small volume fraction of the primary Ni3Al
precip-itates. However, it is very surprising that the hardness reduction from room temperature to the highest temperature tested (1173 K) was mostly less than15% for all of three groups of alloys. Regarding the curves of hardness vs. volume fraction of the primary Ni3Al precipitates, it should
be emphasized that the hardness of the Ti added alloys showed broad peaks at around2040% volume fraction of
the primary Ni3Al precipitates when those alloys were
measured at high temperatures beyond 773 K (Fig. 7(c)) while the hardness of the base and Nb added alloys showed mild peaks in low volume fraction range and then monot-onously decreased up to 100% volume fraction (Figs. 7(a) and 7(b)).
The hardness of the dual two-phase intermetallic alloys composed of primary Ni3Al precipitates and the eutectoid
(channel) region can be explained by the mixture rule of the volume fraction of each constituent, i.e.,H¼HaVaþHbVb
where H is hardness, V is volume fraction of each
[image:6.595.74.262.73.208.2]constituent, and subscripts a and b mean two constituents, respectively. In Fig. 8, the line according to the mixture rule for the room temperature hardness observed in the Nb added alloys is as example drawn. The discrepancy between experimental data and mixture rule, i.e., extra hardening Hv was recognized in each alloy and at each temperature.
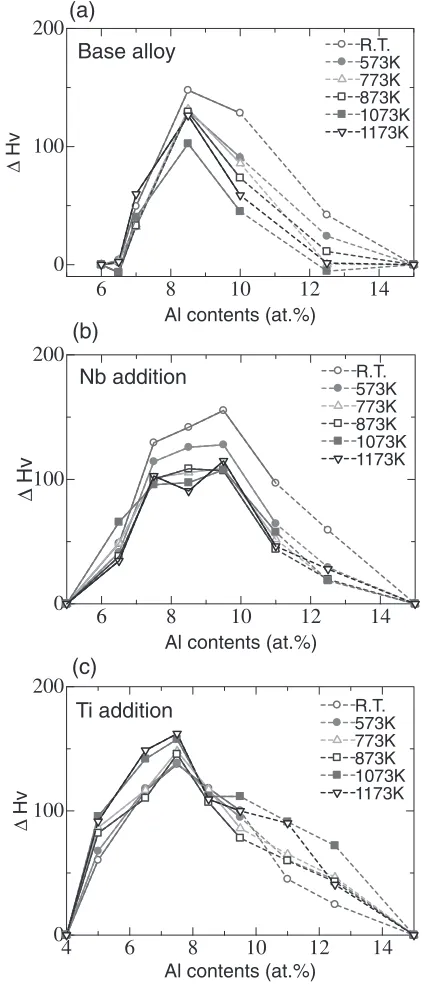
Figure 9 shows extra hardening Hv as a function of Al
content for the base, Nb added, and Ti added alloys which were measured at room temperature to 1173 K. The base, Nb added, and Ti added alloys exhibited a peak of extra hardening at 8.5, 9.5 and 7.5 at% Al contents, respectively. The Al contents showing the peaks appear to be less sensitive to temperature regardless of alloys. Since theseHv vs. Al
content curves are very similar to the curves of the L12/
channel interfacial areaSinterf.vs. Al content, both parameters
Hv and Sinterf. was correlated and shown in Fig. 10.
Consequently, well defined linear correlations between two parameters were recognized for three groups of the alloys and also at all test temperatures. With increasingSinterf., the extra
hardening Hv linearly increased. Therefore, it is
demon-strated that the extra hardening arises from the interface between the primary L12precipitates and the channel region,
and consequently may be called as interfacial hardening. Here, the powers of the interfacial hardening can be evaluated from the slopes in the linear Hv-Sinterf. relation,
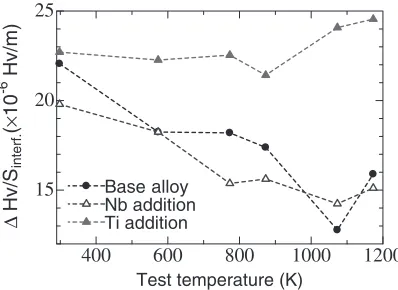
and are shown in Fig. 11. Interestingly, the slopes at room temperature were not so much different among the base, Nb added, and Ti added alloys. However, as test temperature increases the slopes for the base and Nb added alloys decreased while those for the Ti added alloys little decreased. Thus, it is demonstrated that the interfacial hardening in the Ti added alloys is larger than those in the base and Nb added alloys, and does not decrease with increasing temper-ature. In all of three groups of the alloys, the interfacial hardening tended to again increase at temperature beyond 1000 K with further increasing temperature. Probably, this result suggests that interfacial hardening mechanism differ-ent from that in lower temperature region was operated in higher temperature region.
∆ Hv
0 20 40 60 80 100 300
400 500
Volume fraction of primary L12precipitates (%)
Vickers Hardness (Hv)
Fig. 8 Variation of Vickers hardness with the volume fraction of the primary Ni3Al precipitates. Data obtained at room temperature are plotted.
6 8 10 12 14 0
100 200
R.T. 573K 773K 873K 1073K 1173K
Al contents (at.%)
∆
Hv
(a)
Base alloy
4 6 8 10 12 14 0
100 200
∆
Hv
Al contents (at.%)
R.T. 573K 773K 873K 1073K 1173K
(c)
Ti addition
(b)
6 8 10 12 14 0
100 200
R.T. 573K 773K 873K 1073K 1173K
Al contents (at.%)
∆
Hv
Nb addition
Fig. 9 Variation of extra hardening Hv with Al content at various
[image:6.595.321.532.75.568.2]4. Discussion
4.1 The effect of Nb and Ti addition on microstructure
As shown in the section of result, the dual two-phase microstructures were affected by the Nb and Ti addition. The addition of Ti resulted in higher volume fraction of the primary Ni3Al precipitates than that of Nb addition as shown
in Fig. 4. The recent study in the alloying effect on Ni-Al-V ternary phase diagram revealed that Ti addition stabilizes Ni3Al (L12) phase more than Ni3V (D022) phase occupying
the Al sites in Ni3Al, and extends the L12phase field toward
low Al content region,17) thus consistent with the present result. On the other hand, it was shown that the addition of Nb equally stabilizes Ni3Al (L12) and Ni3V (D022) phases
occupying the Al site and the V sites, respectively,18) and
therefore, does not so much change of the volume fraction of both phases.
TEM observation showed that the lower two-phase micro-structure of the dual two-phase intermetallic alloys was also affected by the Nb and Ti addition. The morphology of lamellar-like structures observed in the base and Ti added alloys resembled the reported lower two-phase microstruc-tures coarsened by aging at 1273 K for 35 day while those observed in the Nb added alloys resembled the reported lower two-phase microstructure with no aging.10) An interesting feature observed for the base, Nb added and Ti added alloys is that in the Nb added alloys, the lamellar-like micro-structures (composed of L12+D022) were ambiguous and
finer than those in the base and Ti added alloys. Comparing the diffusivity of the alloying elements Nb, Ti and V in
Ni3Al, the diffusion coefficients of Ti and V have been
reported to be almost the same but that of Nb to be approximately smaller by an order of magnitude than those of Ti and V.19) Therefore, it is easily understood from these
diffusion data that the phase separation and the subsequent growth of the lamellar-like structures were decelerated in the Nb added alloys. To obtain reliable explanation responsible for the present feature, diffusion data in Ni3V (D022) phase
and related microstructural evolution by aging are also required. The microstructures and their evolution in the eutectoid region of three groups of the alloys are currently undertaken by using TEM.
4.2 The effect of Nb and Ti addition on hardness property
In this study, the hardness of the dual two-phase intermetallic alloys was explained in terms of two factors: the first is the hardening depending on the volume fraction of the primary Ni3Al precipitates, i.e., the hardening governed
by the mixture rule in the hardness of two constituent region. The second is the additional hardening (i.e. interfacial hardening) due to interfacial area between the primary Ni3Al
precipitates and the channel region. Let me first discuss the first hardening, the hardness levels in the curves of hardness vs. volume fraction of the primary Ni3Al precipitates was
ranked as Nb added alloys>Ti added alloys>base alloys in a wide range of test temperatures (Fig. 7). In Ni3Al, solid
solution hardening by several transition elements has been studied, and it has been found that the potency of the solid solution strengthening due to Nb atoms is much higher than that due to Ti atoms.20) However, solid solution hardening
behavior by transition metals in Ni3V has not been reported
so far although Ni3V can be strengthened by refinement of
variant structures in D022 phase.21) These hardness levels
may also be affected by the microstructure in another constituent, i.e., the channel region. The highest hardness level observed in the Nb-added alloys may be associated with ill-developed and fine lamellar structures. Therefore, to fully understand the hardening governed by the mixture rule is necessary to study the solid solution hardening behavior in Ni3V phase as well as Ni3Al phase, and also the
micro-structural feature in the channel (eutectoid) region.22–24) Considerable importance of the =0 interfacial disloca-tions in determining the mechanical properties of
conven-(a)
(b)
(c)
0 2 4 6 8
0 50 100 150
Interfacial area, Sinterf. (x106 m/m2)
∆
Hv
Base alloy Nb addition Ti addition
0 2 4 6 8
0 50 100 150
Interfacial area, Sinterf. (x106 m/m2)
∆
Hv
Base alloy Nb addition Ti addition
0 2 4 6 8
0 50 100 150
Interfacial area, Sinterf. (x106 m/m2)
∆
Hv
Base alloy Nb addition Ti addition
[image:7.595.76.524.69.181.2]R.T. 873 K 1173 K
Fig. 10 Relation between extra hardeningHvand Ni3Al/channel interfacial area,Sinterf.for the base, Nb added, and Ti added alloys
measured at (a)R.T., (b) 873 K, and (c) 1173 K, respectively.
400 600 800 1000 1200
15 20 25
∆
Hv/S
interf.
(
×
10
-6 Hv/m)
Test temperature (K) Base alloy
Nb addition Ti addition
Fig. 11 Variation of extra hardening Hv per area of Ni3Al/channel
interface,Hv=Sinterf. with temperature for the base, Nb added, and Ti
[image:7.595.69.268.237.382.2]and roles of these interfacial dislocations have been exten-sively studied by many researchers.25–35)For an example, it
was reported that as the density (or spacing) of the intrinsic interfacial dislocations increases the creep strength increas-es.34) In the dual two-phase intermetallic microstructures,
there are several kinds of interfaces: primary Ni3Al
precip-itate/eutectoid region, which is sub divided to (1) primary Ni3Al precipitate/decomposed Ni3Al in eutectoid region and
(2) primary Ni3Al precipitate/decomposed Ni3V in eutectoid
region, and interfaces in eutectoid region, which are sub divided to (3) decomposed Ni3Al/decomposed Ni3V and (4)
variant interfaces between Ni3V phases composed of the
lamellar structures. Ni3Al with L12 structure has a lattice
parameter of a¼0:3572nm.36) Ni3V with D022 structure
is a tetragonal structure and has a lattice parameter of
a¼0:3542nm and c¼0:7212nm.37) Consequently, lattice
misfits are present between two different crystal structures (phases). These interface structures may be accommodated either by elastic strain or by the introduction of intrinsic interfacial dislocations. Such interfacial structures may result in the additional strengthening against moving dislocations. Ni3Al can be deformed by activating 1=2h110if111g slip
system4) while Ni
3V can be deformed by activating
h112if111g slip system in a wide temperature range.21)
Assuming that dislocations initiated in the primary L12
precipitates propagate into the eutectoid region, extrinsic interface dislocations will be left at interfaces, or intrinsic interfacial dislocations may block the propagating disloca-tions, by which additional strengthening can be expected. At present, which kind of interface (L12/L12 or L12/D022)
or which kind of dislocation (intrinsic or extrinsic) plays important roles in the additional strengthening are not specified. Detailed discussion about this subject is impossible until initial and deformed microstructures of the dual two-phase intermetallic alloys have been clarified, e.g., by using TEM.
Large discrepancy was observed in the temperature dependence of the interfacial hardening among three groups of the alloys, as shown in Fig. 11. A striking result here is that the interfacial strengthening in the Ti added alloys is not declined, but rather tends to increase with increasing temperature, in contrast to those in the base and Nb added
alloys. In conventional =0 superalloys, it has been
reported that =0 interfacial strengthening observed in
tensile test markedly depended upon =0 lattice parameter misfit.35) In the same study, it was also mentioned that
=0 lattice parameter misfit was affected by thermal
expansion coefficient of each phase.35) As one possibility,
the observed difference in temperature dependence of the interfacial hardening may be attributed to different behavior in thermal expansion coefficient of each phase by the Nb and Ti addition, and consequently to different temperature dependence of lattice misfits in each phase by the Nb and Ti addition. Definitely, much more study for X-ray diffraction and TEM observation by which lattice param-eter misfits and interfacial structures among several components (phases or variants) can be evaluated is needed to obtain a reliable explanation responsible for the present behavior.
The influence of the Nb and Ti addition on microstructure and high-temperature hardness property of the dual two-phase intermetallic alloys that are composed of various kinds of volume fractions of geometrically closed packed (GCP) Ni3Al (L12) and Ni3V (D022) phases was studied. The
following results were obtained from the present study. (1) The volume fractions of the primary Ni3Al precipitates
at the same Al content were raised by the Ti and Nb addition. Higher volume fraction of the primary Ni3Al
precipitates was observed in the Ti added alloys. Also, the microstructures in the eutectoid region consisting of Ni3Al+Ni3V were composed of well-developed
lamel-lar structures for the base and Ti added alloys but ill-developed lamellar structures for the Nb added alloys. (2) The hardness of the dual two-phase intermetallic alloys
basically depended on mixture rule in hardness between soft phase of the primary Ni3Al precipitates and hard
phase of the eutectoid region.
(3) In addition to the hardness owing to the mixture rule, the additional hardening which arises from interfacial area between the primary Ni3Al precipitates and the
eutectoid region was found. With increasing interfacial area, the additional hardening increased.
(4) It was suggested that the Nb and Ti addition raised the hardness of the dual two-phase intermetallic alloys by the solid solution hardening in the constituent phases, and this hardening was more significant in Nb addition than in Ti addition.
(5) As temperature increases, the additional interfacial hardening monotonously decreased for the base and Nb added alloys but little decreased for the Ti added alloys.
Acknowledgement
This work was supported in part by Grant-in-aid for Scientific Research (S) for the Ministry of Education, Culture, Sports, Science and Technology.
REFERENCES
1) J. H. N. van Vucht: Less-Common Met.11(1966) 308–322. 2) A. K. Sinha: Trans. Met. Soc. AIME245(1969) 911–917. 3) A. K. Sinha: Prog. Mater. Sci. Part 215(1972) 81–185. 4) D. P. Pope and S. S. Ezz: Int. Mater. Rev.29(1984) 136–167. 5) K. Aoki and O. Izumi: J. Japan Inst. Metals43(1979) 1190–1196. 6) M. Fujita, Y. Kaneno and T. Takasugi: Mat. Sci. Eng. A476(2008)
112–119.
7) Y. Nunomura, Y. Kaneno, H. Tsuda and T. Takasugi: Acta Mater.54 (2006) 851–860.
8) S. Shibuya, Y. Kaneno, M. Yoshida and T. Takasugi: Acta Mater.54 (2006) 861–870.
9) S. Shibuya, Y. Kaneno, H. Tsuda and T. Takasugi: Intermetallics15 (2007) 338–348.
10) S. Shibuya, Y. Kaneno, M. Yoshida, T. Shishido and T. Takasugi: Intermetallics15(2007) 119–127.
11) W. Soga, Y. Kaneno and T. Takasugi: Intermetallics14(2006) 170– 179.
12) W. Soga, Y. Kaneno and T. Takasugi: Mat. Sci. Eng. A473(2008) 180–188.
14) K. Kawahara, Y. Kaneno, A. Kakitsuji and T. Takasugi: Intermetallics 17(2009) 938–944.
15) T. Takasugi and Y. Kaneno: MRS Proc. Publ.1128(2009) 351–356. 16) T. M. Hong, Y. Mishima and T. Suzuki: MRS Proc. Publ.133(1988)
429–440.
17) E. Hayashi, S. Kobayashi, K. Sato, T. J. Konno, Y. Kaneno and T. Takasugi: Tetsu to Hagane (in Japanese)96(2010) 386–391. 18) E. Hayashi, S. Kobayashi, K. Sato, T. J. Konno, Y. Kaneno and T.
Takasugi: Mater. Sci. Eng. A, submitted.
19) S. V. Divinski, S. T. Frank, U. So¨dervall and C. H. R. Herzig: Acta Mater.46(1998) 4369–4380.
20) Y. Mishima, S. Ochiai, N. Hamao, M. Yodogawa and T. Suzuki: Trans. J. Japan Inst. Metals27(1986) 648–655.
21) K. Hagihara, T. Tanaka, T. Nakano and Y. Umakoshi: Acta Mater.53 (2005) 5051–5059.
22) M. Takeyama and M. Kikuchi: Intermetallics6(1998) 573–578. 23) A. Suzuki and M. Takeyama: J. Mater. Res.21(2006) 21–26. 24) A. Suzukiet al.: Superalloys 2004, (TMS, 2004) pp. 115–124. 25) A. Lasalmonie and J. L. Strudel: Phil. Mag.32(1975) 937–949. 26) T. Link and M. Feller-Kniepmeier: Z. Metallkd.79(1988) 381–387.
27) T. P. Gabb, S. L. Draper, D. R. Hull, R. A. Mackay and M. V. Nathal: Mater. Sci. Eng. A118(1989) 59–69.
28) T. M. Pollock and A. S. Argon: Acta Metall. Mater.40(1992) 1–30. 29) R. R. Keller, H. J. Maier and H. Mughrabi: Scr. Metall. Mater.28
(1993) 23–28.
30) R. Volkl, U. Glatzel and M. Feller-Kniepmeier: Scr. Metall. Mater.31 (1994) 1481–1486.
31) V. Sass and M. Feller-Kniepmeier: Mater. Sci. Eng. A245(1998) 19– 28.
32) M. Kolbe, A. Dlouhy and G. Eggeler: Mater. Sci. Eng. A246(1998) 133–142.
33) S. Tian, H. Zhou, J. Zhang, H. Yang, Y. Xu and Z. Hu: Mater. Sci. Eng. A279(2000) 160–165.
34) J. X. Zhang, T. Murakumo, Y. Koizumi, T. Kobayashi, H. Harada and S. Masaki: Metall. Mater. Trans. A33(2002) 3741–3746.
35) D. A. Grose and S. Ansell: Met. Trans. A12(1981) 1631–1645. 36) W. B. Pearson:A handbook of lattice spacing and structures of metals
and alloys, (Pergamon press, 1958) p. 378.