https://doi.org/10.5194/se-8-721-2017
© Author(s) 2017. This work is distributed under the Creative Commons Attribution 3.0 License.
Soil erosion evolution and spatial correlation analysis in a typical
karst geomorphology using RUSLE with GIS
Cheng Zeng1,2,3, Shijie Wang1,3, Xiaoyong Bai1,3, Yangbing Li2, Yichao Tian1,3, Yue Li4, Luhua Wu1,3, and Guangjie Luo3,5
1State Key Laboratory of Environmental Geochemistry, Institute of Geochemistry, Chinese Academy of Sciences, 99 Lincheng West Road, Guiyang 550081, Guizhou Province, PR China
2School of Geographyical and Environmental Sciences, Guizhou Normal University, Guiyang 550001, China 3Puding Karst Ecosystem Observation and Research Station, Chinese Academy of Sciences, Puding 562100, Guizhou Province, PR China
4Key Laboratory of State Forestry Administration on Soil and Water Conservation, Beijing Forestry University, Beijing 100083, China
5Institute of Agricultural Ecology and Rural Development, Guizhou Normal College, Guiyang 550018, China Correspondence to:Xiaoyong Bai ([email protected])
Received: 6 January 2017 – Discussion started: 16 January 2017
Revised: 27 May 2017 – Accepted: 30 May 2017 – Published: 3 July 2017
Abstract.Although some scholars have studied soil erosion in karst landforms, analyses of the spatial and temporal evo-lution of soil erosion and correlation analyses with spatial elements have been insufficient. The lack of research has led to an inaccurate assessment of environmental effects, espe-cially in the mountainous area of Wuling in China. Soil ero-sion and rocky desertification in this area influence the sur-vival and sustainability of a population of 0.22 billion peo-ple. This paper analyzes the spatiotemporal evolution of soil erosion and explores its relationship with rocky desertifica-tion using GIS technology and the revised universal soil loss equation (RUSLE). Furthermore, this paper analyzes the re-lationship between soil erosion and major natural elements in southern China. The results are as follows: (1) from 2000 to 2013, the proportion of the area experiencing micro-erosion and mild erosion was at increasing risk in contrast to areas where moderate and high erosion are decreasing. The area changes in this time sequence reflect moderate to high lev-els of erosion tending to convert into micro-erosion and mild erosion. (2) The soil erosion area on the slope, at 15–35◦, ac-counted for 60.59 % of the total erosion area, and the corre-sponding soil erosion accounted for 40.44 %. (3) The annual erosion rate in the karst region decreased much faster than in the non-karst region. Soil erosion in all of the rock outcrop areas indicates an improving trend, and dynamic changes in
soil erosion significantly differ among the various lithologi-cal distribution belts. (4) The soil erosion rate decreased in the rocky desertification regions, to below moderate levels, but increased in the severe rocky desertification areas. The temporal and spatial variations in soil erosion gradually de-creased in the study area. Differences in the spatial distribu-tion between lithology and rocky desertificadistribu-tion induced ex-tensive soil loss. As rocky desertification became worse, the erosion modulus decreased and the decreasing rate of annual erosion slowed.
1 Introduction
particular, soil erosion threatens ecological security patterns at regional and even global scales.
Many factors affect the evolution of soil erosion in karst areas (Karamesouti et al., 2016; Krklec et al., 2016; Y. B. Li et al., 2016; Wang et al., 2016; Wu et al., 2016) because of the complicated natural conditions (Bai et al., 2013a, b; Tian et al., 2016). Therefore, it is necessary for ecology and soil erosion research in karst areas to explore the spatial evolu-tion characteristics of soil erosion and their influencing fac-tors in a karst area. In the context of global soil erosion and land degradation, traditional methods, such as runoff plots and watershed hydrological stations, are inapplicable for the study of soil erosion in karsts. This has caused fundamental research on soil erosion to lag behind that on soil and water conservation in karst areas.
China possesses the most concentrated, widely distributed, and complex areas of karst landforms worldwide. Guizhou Province is in the center of the karst landform, which is a typical representation of southern China. Due to the slow soil formation rate, mismatched water and soil space, specific geological and hydrological background, and underground structure (Wang and Li, 2007) in the karst zone, soil ero-sion in the area is more complex and unique than in the non-karst zone. Soil erosion in the non-karst area exhibits a complex relationship with topography, lithology, and rocky desertifi-cation. In addition to surface soil loss, underground leakage has been observed in the area. The karst area has minimal environmental capacity and low restorability of the ecologi-cal system (Wallbrink et al., 2002). As such, soil erosion in the area leads to serious consequences that may restrict the sustainable development of the local economy in the region. Many scholars have studied soil erosion and determined its causes and spatial evolution. Erosion force (Bai and Wan, 1998; Feng et al., 2011), erosion processes (Edgington et al., 1991; Cao et al., 2012), soil degradation (M. Feng et al., 2016; Gao et al., 2015; Guo et al., 2015), and erosion mechanisms (Hancock et al., 2014) have also been explored. Studies on soil erosion have been mainly concentrated in non-karst areas or basins (Fernández and Vega, 2016; Park et al., 2011), whereas few studies have investigated the frag-ile ecological–geological environment within the karst zone. Some scholars have also conducted preliminary studies on soil erosion in the karst landform areas. For example, Y. Li et al. (2016) evaluated soil erosion in a typical karst basin by using the RUSLE model and explored the influence of slope on the temporal and spatial evolution laws of soil sion in a karst area. The results indicated that the main ero-sion on the slope section in the basin was within 8–25◦. Yang et al. (2014) analyzed soil erosion in Chaotiangong County in Guilin using an analytic hierarchy and fuzzy model; they found that the risk of soil erosion was very high in the southeastern study area but relatively low in the northwest. Biswas and Pani (2015) studied soil erosion in the Barakar River basin in eastern India using the RUSLE model com-bined with GIS technology; the soil erosion rate is more than
100 t km−2a−1, which accounts for only 0.08 % of the to-tal study area. T. Feng et al. (2016) compared the soil ero-sion rate between two karst peak-cluster depresero-sion basins in northwestern Guangxi, China, using137Cs and RUSLE mod-els. Runoff discontinuity and underground seepage on the karst slope are significant factors to consider in the RUSLE model because they reduce the effect of slope length. How-ever, previous research exhibits some deficiencies and limita-tions. Most studies are conducted in karst basins or mountain areas (Shi et al., 2004; Terranova et al., 2009) and analyze the effect of terrain, rainfall, vegetation cover, and other factors on soil erosion (M. Feng et al., 2016; Ganasri and Ramesh, 2016; Liu et al., 2016). The effects of soil erosion on rocky desertification and lithology have been ignored. Few schol-ars have analyzed the soil erosion evolution in a kschol-arst valley area on a long time sequence or determined the effect of spa-tial factors on evolution. Therefore, the available data on the correlation between soil erosion evolution and spatial factors in the karst zone are limited, particularly for the mountain-ous area of Wuling, China. This lack of knowledge leads to an inaccurate assessment of the environmental effects in the region; soil erosion and rocky desertification in this area in-fluence the survival and development of 0.22 billion people. Studying the evolution of the temporal and spatial distribu-tion of soil erosion in the karst area and analyzing its corre-lation with spatial factors remains challenging. Studies have rarely been conducted worldwide because of a lack of sup-porting data, insufficient experience, and lack of applicable technical methods.
This paper evaluated typical karst areas in southern China and combined current surveys on soil types with calcula-tion results from a soil erodibility test. Soil erosion was an-alyzed in different periods using a revised universal soil loss equation (RUSLE) model. The specific aims of this study were as follows: (1) to identify the evolution of the tempo-ral and spatial distribution of soil erosion in typical karst areas in southern China; (2) to explore the relationship be-tween soil erosion and rocky desertification; and (3) to deter-mine the correlation between soil erosion and major natural elements and evaluate their ecological effect. This study im-proved upon existing research methods and proposes sugges-tions for additional research. It provides a basis for macro-decision-making by government policy makers and environ-mental managers as well as relevant data on methodology and references for research into soil erosion in karst land-form areas.
2 Study area
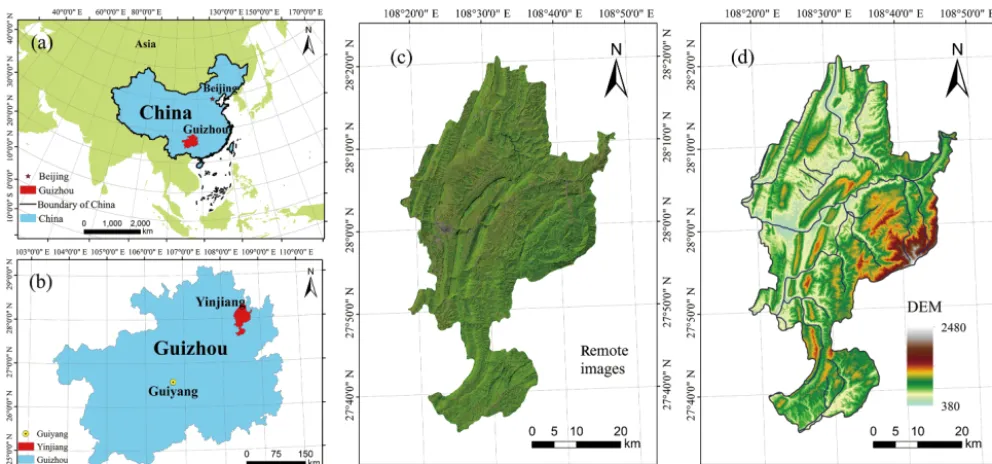
topogra-Figure 1.Study area in Guizhou, China(a, b). Study area remote images(c)and topography(d).
phy is such that the east is at a high elevation and the west is at a low elevation, sloping from southeast to northwest. Yinjiang County has a relative elevation difference of 2000 m and an average altitude of 2480 m (Fig. 1). The study area has a subtropical monsoonal climate with annual precipitation of 1100 mm. Rainfall occurs mainly between April and August. The temperature in this area ranges from −3.1 to 29.8◦C with an annual average of 16.8◦C. The highest monthly tem-perature occurs in July, and the lowest occurs in January. The vegetation is primarily composed of evergreen broad-leaved forest, coniferous forest, evergreen deciduous broad-leaved mixed forest, and temperate coniferous mixed forest. The vegetation coverage increased from 49.1 to 58.5 % during the study period.
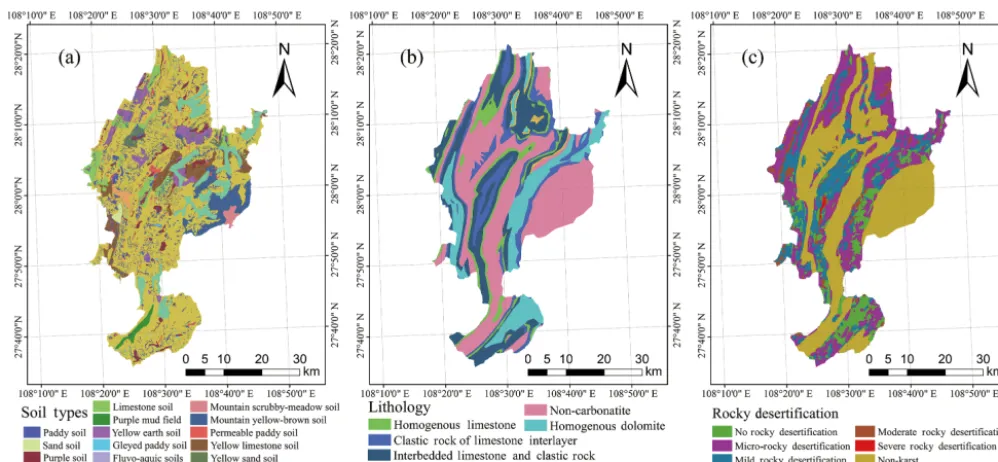
Carbonate rocks are widely distributed in Yinjiang County, accounting for 60.06 % of the total area (Fig. 2b). During karst activity, the mantle rock is discontinuous with under-ground fissures and karst development. Widely distributed soil erosion led to a thin soil layer in the study area and a frag-ile ecology. Yinjiang County has suffered from different de-grees of rocky desertification, accounting for 57.69 % of the total area of the whole county (Fig. 2c). Rocky desertification has been mainly caused by soil erosion due to unsustainable land use. According to the classification of soil zonality, the zonal soil is yellow soil in the study area, but a large area is distributed with lime soil. Moreover, based on the site survey, mountain shrub meadow soil, soil mud, a purple mud field, a tidal sand mud field, and other soil types are distributed in Yinjiang (Fig. 1a). All of these factors are dominant in a typical karst area.
3 Materials and methods 3.1 Data sources
The related data collected based on the RUSLE model mainly include the following: (1) monthly rainfall data in the study area for 2000, 2005, and 2013 from the Tongren Meteoro-logical Bureau (http://tongren04264.11467.com). (2) A soil database was established according to a current survey of soil types, particle size, and the content of organic substances in various soil types that are mainly based on Chinese soil records. (3) A digital elevation model (DEM) was obtained from a Chinese remote-sensing satellite ground station at the Chinese Academy of Sciences (http://www.cas.cn), with a spatial resolution of 30 m. (4) ArcGIS 10.0 was used to deter-mine the three study periods of the NDVI data from the Chi-nese geospatial data cloud platform (http://www.gscloud.cn). (5) Landsat 7 OLI and Landsat 8 OLI remote sensing images (P126, R40 and P126, R41) were synthesized in ArcGIS 10.0 for stitching and cutting using the data from the Chinese geospatial data cloud platform, with a spatial resolution of 30 m; based on these data, a land-use map was drawn in Ar-cGIS 10.0 software. The Albers equal-area conic projection was used for a geographic coordinate system.
3.2 RUSLE model
The RUSLE model (Renard et al., 1997) is an empirical model revised from the USLE model for predicting soil ero-sion. The calculation is as follows:
Figure 2.Study area geological background: soil map(a), lithology(b), and rocky desertification(c).
whereA [US unit t km−2a−1] refers to the amount of soil loss per unit area in time and space and depends on theKand Runits.R[MJ mm (hm2h a)−1] refers to the rainfall erosiv-ity factor in consideration of the erosion of snowmelt runoff. K[t hm2h (hm2MJ mm)−1] refers to the soil erodibility fac-tor, which is the soil loss rate of specific soil rainfall erosiv-ity per unit measured in a standard plot.LandSrefer to the slope aspect factor.C refers to the coverage factor for veg-etation. P refers to the conservation measure factor, which includes engineering and tillage measure factors.
3.2.1 Rainfall erosivity factor (R)
Rainfall erosivity represents the potential ability of rainfall to induce erosion. Rainfall erosivity is the primary factor that should be considered in the soil loss equation and is related to rainfall, duration of rainfall, and rainfall energy. This factor reflects the effect of rainfall characteristics on soil erosion. Rainfall erosivity is difficult to directly mea-sure. Most studies use rainfall parameters, including rain-fall intensity and precipitation, to estimate rainrain-fall erosivity. Given the relatively fragmented surface, concentrated precip-itation, and strong water erosion in the study area, this paper adopts a simple monthly rainfall formula developed by Zhou et al. (1995) to estimate rainfall erosivity (R)in Yinjiang by comparing various algorithms and determining the accuracy of the acquired climate data. The formula is as follows:
R= 12 X
i=1
(−1.5527+0.7297Pi) , (2)
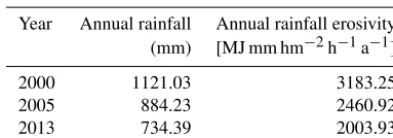
wherePi refers to the rainfall in monthi(mm). The unit of the calculatedR is 100 ft t in ac−1h−1a−1. IfR is changed to the international unit MJ mm hm−2h−1a−1, then a coeffi-cient of 17.02 should be the multiplier (Table 1).
3.2.2 Soil erodibility factor (K)
Soil erodibility is an important indicator that reflects the rain-fall infiltration capacity of soil and the sensitivity of soil to rainfall and runoff erosion. This internal factor affects soil loss. The size ofK is related to the soil texture and organic material content. In this paper, soil erodibility and soil me-chanical composition are used to form a calculation and are closely related to the organic carbon content (Sharpley and Williams, 1990):
K=
0.2+0.3 exp
−0.0256SAN
1−SIL 100
×
SIL
CLA−SIL 0.3
×
1− 0.7SN1
SN1+exp(−5.51+22.9SN1)
, (3)
where K refers to the soil erodibility
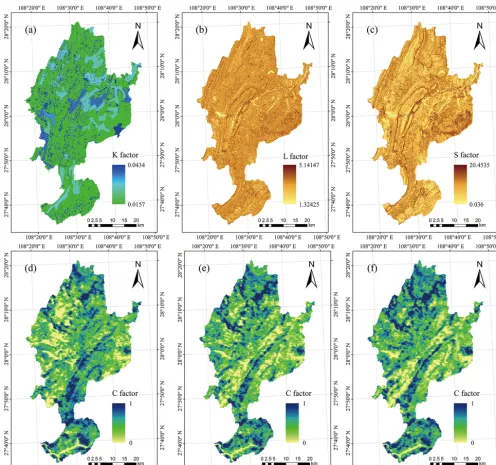
Figure 3.Soil erodibility map(a), slope length factor map(b), slope gradient factor map(c), 2000 vegetation cover factor map(d), 2005 vegetation cover factor map(e), and 2013 vegetation cover factor map(f).
3.2.3 Topographic factor (L)(S)
Slope length is a basic terrain factor that influences soil ero-sion. In this paper, the formula developed by Liu et al. (2000) is used to calculate slope length in Yinjiang County. The cal-culation is as follows:
S=
10.8 sinθ+0.03 θC5◦ 16.8 sinθ−0.05 5◦≤θC10◦ 21.9 sinθ−0.96 θ≥10◦,
(4)
L=(λ/22.13)m, (5)
whereSrefers to the slope factor,θrefers to the slope value (◦),L refers to the slope length factor, andλ refers to the slope length (m). To determine the slope and length, 30 m DEM data from ArcGIS are used and then placed in the for-mula to calculateL,S(Fig. 3b and c).
3.2.4 Vegetation cover factor (C)
Table 1. The rainfall erosivity factor (R)in Yinjiang during the study period.
Year Annual rainfall Annual rainfall erosivity (mm) [MJ mm hm−2h−1a−1]
2000 1121.03 3183.25
2005 884.23 2460.92
2013 734.39 2003.93
al. (2000). The vegetation coverage rate is also determined using the algorithm established by Tan et al. (2005) with the following equations:
C=
1 fc=0
0.6508−0.3436 lgfc 0CfcC0.783
0 fc=0.783
, (6)
fc=(NDVI−NDVIsoil) / NDVIveg−NDVIsoil, (7) NDVI=(ρNIR−ρR) / (ρNIR+ρR) , (8) whereCrefers to the vegetation coverage factor,fcrefers to the vegetation coverage (%), and NDVI refers to the normal-ized differential vegetation index. In this paper, the cumu-lative percentages of 5 and 95 % are used as the confidence intervals to determine the corresponding pixel values and the effective NDVIsoiland NDVIvegin the study area.ρNIRrefers to the near-infrared band, andρRrefers to the red band. The above formula is used to calculate the vegetation coverage distribution map in different periods (Fig. 3d, e, f).
3.2.5 Conservation practice factor (P )
The soil and water conservation factor P refers to the per-centage of soil loss to planting down the slope after adopting soil and water conservation measures. The obtained value is within 0–1. If the value is 0, then the area is not affected by soil erosion; if the value is 1, the area has not been subjected to any soil or water conservation measures (Table 2). 3.3 Calculation of the soil erosion and evaluation
methods
The above factor layers are converted into raster layers in 30×30 m equal coordinates with ArcGIS 10.0 software. All of the layers are multiplied to obtain the spatial distribu-tion of the soil erosion modulus in the study area. Reference SL190-2007 criteria are used for the classification and grad-ing of soil erosion intensity relative to water erosion gradgrad-ing standards for Yinjiang County (Fig. 4). On this basis, the spa-tial and temporal evolution of soil erosion in the study area was analyzed and evaluated.
4 Results
4.1 Evolution of soil erosion
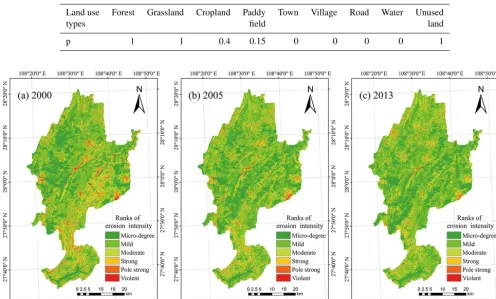
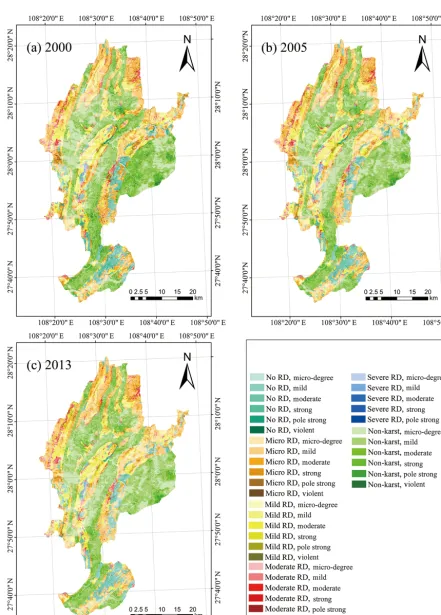
From 2000 to 2013, the total amount of soil erosion in Yin-jiang decreased from 477.48×10⁴t a−1in 2000 to 366.56× 10⁴t a−1in 2005 and 314.64×10⁴t a−1in 2013, with a total reduction of 34.11 % (Table 3).
The area of micro-erosion accounts for 28.97, 30.27, and 34.21 % of the total erosion area in the three study periods, with a total increase of 5.24 %. The area of mild erosion ac-counts for 39.99, 43.90, and 44.29 % of the total erosion area; the area decreased by 1860 hm2overall within the study pe-riod, but mild erosion conversion led to an increase of 4.30 %. The total of micro-erosion and mild erosion in the three pe-riods was more than 65 %, and the moderate to higher levels for 2000 to 2013 are declining. The decreased amplitudes of moderate erosion areas, strong erosion areas, pole strong erosion areas, and violent erosion areas were 24, 49, 63, and 89 %, respectively. Yinjiang County exhibited a transforma-tion from moderate erosion, strong erosion, pole strong ero-sion, and violent erosion to micro-erosion and mild erosion.
The percentages of micro-erosion, mild erosion, and mod-erate erosion to the total erosion amount increased during the study period. Mild and moderate erosion amounts con-tributed to the total erosion amount in Yinjiang County. The total percentage of erosion increased from 57.14 % in 2000 to 71.63 % in 2013, whereas the percentages of strong, pole strong, and violent erosion significantly decreased. The total percentage of strong and pole strong erosion decreased from 36.15 to 24.33 %.
In summary, Yinjiang County was mainly affected by mild and moderate erosion. The total percentage of soil erosion increased by 12.57 % from 2000 to 2013. In the entirety of Yinjiang County, a large portion of land experienced micro-erosion and mild micro-erosion in 2000, 2005, and 2013. The total erosion was more than 65 %. The corresponding soil erosion accounted for 28.21, 34.66, and 40.78 % of the total ero-sion. Although the total area affected by erosion increased to 2374 hm2, the areas with more than micro-erosion levels decreased. The erosion amount decreased yearly, and the ero-sion level significantly changed from high to low over a large area.
4.2 Grade shifting of soil erosion intensity
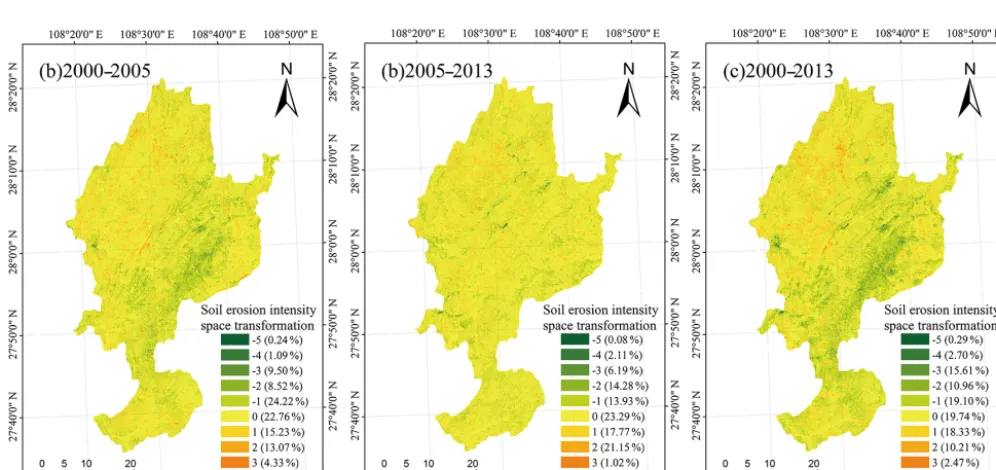
From 2000 to 2005, the percentages of areas with unchanged soil erosion intensity, increased soil erosion intensity, and de-creased erosion intensity were 22.76, 33.68, and 43.56 %, respectively. Hence, the soil erosion level was transformed from moderate and high levels to low levels during the study period (Fig. 5).
Table 2.Soil and water conservation factors in Yinjiang County.
Land use Forest Grassland Cropland Paddy Town Village Road Water Unused
types field land
p 1 1 0.4 0.15 0 0 0 0 1
Figure 4.Spatial distribution of soil erosion in Yinjiang in different periods.
with increased and decreased soil erosion intensity slightly increased and attained values of 40.2 % and 36.59 %, respec-tively.
From 2000 to 2013, the percentages of the total area with increased and decreased erosion intensity were 31.6 and 48.66 %, respectively. This finding reveals that soil erosion intensity has an improving trend.
4.3 Spatial variation in soil erosion 4.3.1 Different slope zones
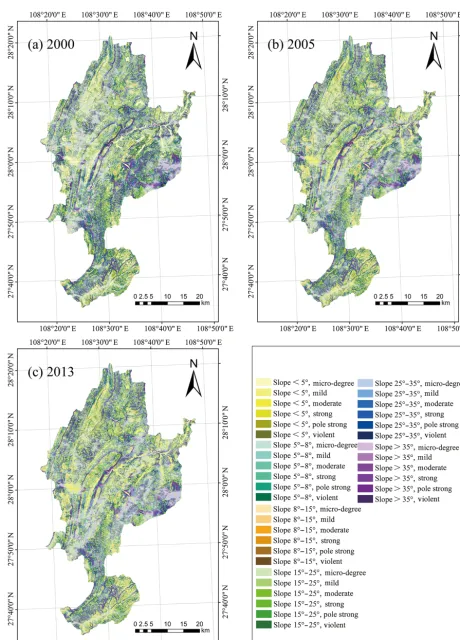
Slope is the most important terrain factor that influences soil erosion, and it is related to the soil erosion modulus; the mod-ulus in Yinjiang County gradually increased with increasing slope. Hence, slope exhibits a significantly positive correla-tion with the soil erosion modulus. High-slope areas possess a high mean soil erosion modulus but a small erosion area and erosion amount (Fig. 6).
The soil erosion area of 33.31 % represents the largest area within 15–25◦slope bands, followed by 25–35◦slope bands (area of 27.28 %). The 25–35, 15–25, 8–15, and 5–8◦slope bands account for 20.71, 19.68, 18.09, and 17.32 % of the to-tal erosion. The band with a slope < 5◦represents the lowest erosion amount, accounting for 10.85 % (Table 4). All of the
slope bands exhibit a slight erosion level in terms of the mean erosion modulus.
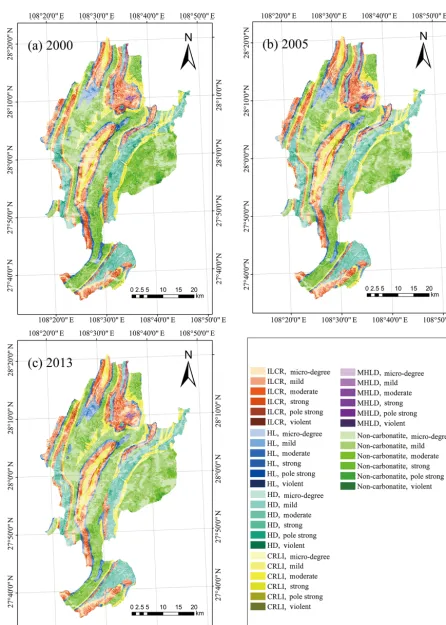
4.3.2 Outcrop area of different rocks
The karst surface is broken and contains peak clusters, nee-dle karst, and isolated peaks. The area with carbonate rock distribution accounts for 60.06 % of the total study area. From 2000 to 2013, the annual erosion rate decreased by 8.22 t (hm2a)−1 with a decreased amplitude of 30.82 %. In non-carbonate rock areas, the annual erosion rate from 2000 to 2013 decreased by 6.19 t (hm2a)−1with a decreased am-plitude of 24.29 %, which is smaller than in carbonate rock areas (Fig. 7).
Table 3.The soil erosion estimates for different periods in Yinjiang.
Erosion rating Erosion area Total soil loss Average modulus Area ratio Erosion ratio (hm2) (×104t) (t hm−2a−1) (%) (%)
2000 Micro-degree 36 187 8.47 2.30 28.97 1.77
Mild 87 470 126.25 126 39.99 26.44
Moderate 40 506 146.58 36.11 19.27 30.70
Strong 15 719 98.88 62.88 7.78 20.71
Pole strong 7153 73.73 103.30 3.46 15.44
Violent 1244 23.57 184.80 0.54 4.94
2005 Micro-degree 56 529 9.74 2.35 30.27 2.66
Mild 84 898 117.30 13.92 43.90 32.00
Moderate 34 362 120.91 35.23 17.76 32.99
Strong 10 929 67.95 62.17 5.65 18.54
Pole strong 4352 44.67 102.70 2.25 12.19
Violent 338 5.99 177.59 0.17 1.64
2013 Micro-degree 63 544 10.57 2.32 34.21 3.36
Mild 85 610 117.63 13.83 44.29 37.42
Moderate 30 801 107.54 34.97 15.92 34.21
Strong 8010 49.73 62.11 4.14 15.82
Pole strong 2663 26.76 100.52 1.38 8.51
Violent 125 2.11 168.55 0.06 0.67
Figure 5.The intensity variation map of the soil erosion in Yinjiang. Note: 0 refers to unchanged soil erosion intensity; 1 refers to the soil erosion intensity increasing by one level; 2 refers to the soil erosion intensity increasing by two levels; 3 refers to the soil erosion intensity increasing by three levels; 4 refers to the soil erosion intensity increasing by four levels; 5 refers to the soil erosion intensity increasing by five levels;−1 refers to the soil erosion intensity decreasing by one level;−2 refers to the soil erosion intensity decreasing by two levels;
Table 4.Soil erosion conditions on different slope grades.
Slope Average modulus Area ratio Erosion ratio (t hm−2a−1) (%) (%)
< 5◦ 15.32 9.68 10.85
5–8◦ 13.31 4.76 17.32
8–15◦ 15.33 12.94 18.09
15–25◦ 17.56 33.31 19.68
25–35◦ 18.54 27.28 20.72
> 35◦ 20.15 12.03 13.33
(CRLI; soil loss tolerance in the areaT =100), and it was reduced by 4.31 t (hm2a)−1 with a decreased amplitude of 17.07 % in the interbedded area of limestone and clastic rock (ILCR; soil loss tolerance in the areaT =250) (Table 5).
The relationship of the changes in the decreased amplitude in the study period was as follows: homogenous dolomite (T =20) > clastic rock of limestone interlayer (T =100) > interbedded of limestone and clastic rock (T =250) > ho-mogenous limestone > mixture of hoho-mogenous limestone and dolomite.
4.3.3 Different grades of rocky desertification
Different degrees of rocky desertification are distributed in approximately 57.69 % of the study area. In the karst area, interference and destruction from invasive social and eco-nomic activities caused severe soil erosion, leading to soil particle loss, a thin soil layer, and outcropped base rock in the desertification area (Fig. 8).
From 2000 to 2013, the annual erosion rate in Yin-jiang County exhibited the following trend: erosion was re-duced by 11.99 t (hm2a)−1 with a decreased amplitude of 39.36 % in the non-rocky desertification area. It was re-duced by 6.23 t (hm2a)−1 with a decreased amplitude of 24.53 % in the micro-rocky desertification area. It was re-duced by 3.2 t (hm2a)−1 with a decreased amplitude of 14.90 % in the mild rocky desertification area. It was reduced by 1.68 t (hm2a)−1 with a decreased amplitude of 9.06 % in the moderate rocky desertification area. It increased by 1.86 t (hm2a)−1 with an increased amplitude of 19.16 % in the severe rocky desertification area, and it was reduced by 7.42 t (hm2a)−1with a decreased amplitude of 28.62 % in the non-rocky desertification area (Table 6).
The relationship of the decreasing amplitude of erosion rates in karst areas during the study period was as follows: non-rocky desertification area > micro-rocky desertification area > mild rocky desertification area > moderate rocky de-sertification area > severe rocky dede-sertification area. The soil erosion amounts decreased in the non-rocky desertification area, micro-rocky desertification area, mild rocky desertifi-cation area, and moderate rocky desertifidesertifi-cation area; they in-creased in the severe rocky desertification area. The micro-rocky desertification zone occupied the largest soil erosion
area (47.55 % of the total area) and had the highest erosion amount (48.86 % of the total erosion amount). The mean ero-sion modulus was a mild level of eroero-sion.
5 Discussion
5.1 Spatiotemporal evolution characteristics of soil erosion
The overall soil erosion conditions in Yinjiang County im-proved annually. The erosion area and erosion amount were distinguished by conversion from strong, pole strong, and vi-olent erosion to moderate and lower levels of erosion. This phenomenon occurred because rainfall and vegetation cover-age mainly affect the dynamic changes in soil erosion in Yin-jiang County. On the one hand, rainfall decreased yearly from 1121.03 mm in 2000 to 734.39 mm in 2013 in the study pe-riod, which led to a weakening of rainfall erosion (Mohamadi and Kavian, 2015). On the other hand, Yinjiang County has a wide range of farmland returning to forests and closed forest projects, so vegetation management and soil and wa-ter conservation measures in the study area correspondingly changed. The improved vegetation coverage plays a role in the prevention and control of soil and water erosion. Soil and water conservation measures have a large-scale active effect and cause significant results.
Slope determines the speed of surface runoff. If other fac-tors remain unchanged, the surface runoff impacts on soil in an area with a slope below 35◦become stronger and the soil erosion amount increases with increasing slope. When the slope reaches 35◦, the erosion amount decreases and is weakly influenced by the increasing slope. The band with a slope of 15–35◦accounts for 60.59 % of the total erosion area and 40.44 % of the total erosion amount. This band is the main erosion slope section in the study area. This phe-nomenon is the result of artificial reclamation in the slope area. Based on the current results, as has been reported in previous studies (Xu et al., 2008; Chen et al., 2012), the slope is about 25◦in areas prone to soil erosion. The 15–35◦slope area in Yinjiang County must have enhanced prevention and control measures for soil erosion.
5.2 Influence of spatial factors on soil erosion 5.2.1 Influence of lithology on soil erosion
weath-Table 5.Annual erosion rates in different rock outcrop areas.
Average soil erosion rate (t hm−2a−1)
Non-carbonatite carbonatite HD HL MHLD CRLI ILCR
2000 26.67 25.48 30.30 23.77 24.34 21.78 25.25 2005 21.79 21.82 22.26 21.86 27.44 19.10 23.03 2013 18.45 19.29 18.06 19.97 23.06 17.40 20.94
Table 6.Annual erosion rates in different rocky desertification grades.
Average soil erosion rate (t hm−2a−1)
No RD Micro RD Mild RD Moderate RD Severe RD Non-karst
2000 30.46 25.40 21.48 18.54 9.71 25.93 2005 22.17 21.79 20.09 18.57 8.98 21.74 2013 18.47 19.17 18.28 16.86 11.56 18.51
ering, 630–7880 ka of carbonate is required to form a 1 m thick soil layer. The soil-forming rate is 10–40 times slower than in the general non-karst area (Chen, 1997). Moreover, the soil-forming rate and soil thickness are higher in non-carbonate areas than in non-carbonate areas. The formation time of runoff is short after rainfall, and the surface water storage capacity is low in the karst area. Rainfall forms underground runoff; hence, underground soil loss is high and the vegeta-tion coverage is lower than in the non-karst area.
In the study period, only 10–22.37 % of the areas are within the allowable loss amount. These areas are mainly dis-tributed in the valley zone, with low altitudes in the south of Yinjiang and the smooth zone in the southwestern and Fan-jingshan areas. These areas are mostly located in non-karst zones with a wide distribution of non-carbonates. The soil formation is rapid, the underground soil loss is low, and the vegetation coverage is high.
Soil erosion exhibited an improving trend in different out-crop areas. However, the dynamic changes in soil erosion in various lithological distribution belts were significant. The decreasing amplitude of the annual erosion rate in homoge-nous dolomite, limestone intercalated with clastic rock, and the interbedded region of limestone and clastic rock gradu-ally decreased with decreasing carbonate content. This phe-nomenon occurred because of the mineral composition and chemical characteristics of the parent rock, which directly affect the speed and direction of soil formation. The weath-ering degree of different lithologies, the speed and direction of soil formation, and the erosion type, intensity, and rate are also different. If the carbonate content is high, then the soil formation rate is slow and the soil layer is shallow. Therefore, the decreasing amplitude of the annual erosion rate is low. The homogenous limestone region and the mixed region of homogenous dolomite and limestone are mainly distributed in an area of low altitude with a slope of less than 8◦. There is
therefore a specific soil thickness, resulting in a large erosion model and small decreasing amplitude of the annual erosion rate. Moreover, the lithology controls the spatial distribution and development of soil erosion. Li et al. (2006) reported that the allowable soil loss is 6.75 t (km2a)−1 in the carbonate area and 7.08 t (km2a)−1in the homogenous limestone area and homogenous dolomite area. The rank of allowable loss amounts is as follows: homogenous dolomite composition distribution area > homogenous limestone composition dis-tribution area. In the present study, the rank of calculated loss amounts (homogenous dolomite area > homogenous lime-stone area) is consistent with a previous study. The allow-able soil loss amounts are 45.40 t (km2a)−1in limestone in-tercalated with clastic rock and 103. 38 t (km2a)−1in the in-terbedded region of limestone and clastic rock. The relation-ship of the allowable loss amount is as follows: interbedded region of limestone and clastic rock > limestone intercalated with clastic rock. The allowable loss is positively correlated with the amount of loss calculated in areas ofT =100 (lime-stone intercalated with clastic rock) andT =250 (interbed-ded layer of limestone and clastic rock).
Table 7.Soil erosion data obtained in previous studies in typical karst areas.
Reference Study area Timescale Average modulus Total soil loss (t hm−2a−1) (×104t)
Zeng et al. (2014) Hongfeng Lake watershed 1960–1986 38.35 610.53
1987–1997 52.80 839.90
1998–2004 40.24 640.18
Xu and Peng (2008) Maotiao River watershed 2002 28.70 875.65 Y. Wang et al. (2014) Wujiang River basin 1980–1989 26.78 133.36
1990–1999 23.13 115.18
This paper Yinjiang County 2000 25.09 477.49
2005 21.53 366.56
2013 18.84 314.64
increasing and the loss intensity is large; however, they were not obvious in general (the total amount of soil erosion is small and very low). As these areas, which are concentrated in the Langxi valley, are small areas with poor conditions for growing vegetation, are in a soil accumulation environment, or are on negative terrain, there are specific soil thicknesses causing high erosion rates.
The decrease in the erosion rate in other rocky cation bands reveals that soil erosion in the rocky desertifi-cation area improved during the study period. The soil loss in the karst rocky desertification areas could be due to the particular geology (wide distribution of carbonate rocks), to-pography (presence of underground space), vegetation, and climate conditions, which lead to a low soil formation rate and shallow soil layer in the study area. Abundant rainfall in the study area provides a dynamic potential for soil and wa-ter loss. Furthermore, underground pores, cracks, and pipes are widely distributed in the karst area. In addition to surface loss, soil loss also occurs through karst caves, underground rivers, and other means (Peng and Wang, 2012; J. Wang et al., 2014).
The current study method exhibits certain limitations in a typical karst area. In future studies, underground soil and wa-ter loss in the karst area should be calculated. The localiza-tion of the model calculalocaliza-tion factor in the karst area should also be considered for calculating soil erosion using the pro-posed model. Based on the specificity of soil erosion in the karst area, improving the method and exploring erosion in-dicators can improve and enrich the study of soil erosion in karst areas.
5.3 Modulus of different soil erosion statistics in karst areas
The RUSLE model is a classical model for evaluating soil erosion and is widely used in various countries and regions worldwide. Although the RUSLE model is a mature and clas-sical model, its application in karst areas is relatively scarce. Several scientists have conducted research on different parts of the karst areas in Guizhou Province. Different results have
been derived; thus, a simple control should be adopted. The results are given in Table 7.
6 Conclusions
The temporal and spatial variation in soil erosion gradually declined in the study area and exhibited a changing trend from moderate and higher levels to lower levels. Slope was the most important topographic factor that affected different spatial and temporal distributions of soil erosion. The band with a slope of 15–35◦was the main erosion slope section in the study area. The soil erosion in all rocky outcrop areas ex-hibited an improving trend, but the dynamic changes in soil erosion in each lithological distribution zone varied greatly. As rocky desertification worsens, the erosion modulus lowers and the decreasing rate of annual erosion will slow.
In karst areas, lithology and rocky desertification are the most important natural factors that cause different temporal and spatial variations in soil erosion. Lithology is the geolog-ical basis of soil erosion, and rocky desertification is widely distributed in karst valley areas. Different spatial distribu-tions of lithology and rocky desertification lead to a large area of soil loss. Lithological and rocky desertification fac-tors introduced in the soil erosion model can accurately re-flect and predict soil erosion conditions and spatial distribu-tion characteristics in karst areas. This finding will help pro-mote research into soil erosion in karst areas worldwide.
In karst areas, underground space is complicated and con-sists of multiple geological and geomorphological features. In addition to surface loss, soil loss occurs through karst caves, underground rivers, and other means, causing differ-ences between the measured soil loss and the calculated value in the model. Most of the time, soil erosion study methods and indicators that are used for non-karst areas cannot reflect the actual conditions of karst areas.
Competing interests. The authors declare that they have no conflict of interest.
Acknowledgements. This research was supported by the Na-tional Key Research Program of China (nos. 2016YFC0502300, 2016YFC0502102, 2013CB956700, and 2014BAB03B02), the UNESCO Research Center on Karst (no. U1612441), international cooperation research projects of the National Natural Science Fund Committee (nos. 41571130074 and 41571130042), the Science and Technology Plan of Guizhou Province of China (nos. 2012-6015, 2013-3190, and 2017-2966), and science and technology coopera-tion projects (no. 2014-3).
Edited by: Antonio Jordán
Reviewed by: four anonymous referees
References
Arnhold, S., Lindner, S., Lee, B., Martin, E., Ketter-ing, J., and Nguyen, T. T.: Conventional and organic farming: soil erosion and conservation potential for row crop cultivation, Geoderma, 219–220, 89–105, https://doi.org/10.1016/j.geoderma.2013.12.023, 2014.
Bai, X. Y., Zhang, X. B., Long, Y., Liu, X., and Zhang, S.: Use of 137cs and210pb ex, measurements on deposits in a karst
depres-sion to study the erodepres-sional response of a small karst catchment in southwest china to land-use change, Hydrol. Process., 27, 822– 829, https://doi.org/10.1002/hyp.9530, 2013a.
Bai, X. Y., Wang, S. J., and Xiong, K. N.: Assessing spatial-temporal evolution processes of karst rocky desertification land: indications for restoration strategies, Land Degrad. Dev., 24, 47– 56, https://doi.org/10.1002/ldr.1102, 2013b.
Bai, Z. G. and Wan, G. J.: Study on watershed erosion rate and its environmental effects in Guizhou Karst region, Journal of Soil Erosion and Soil and Water Conservation, 4, 1–7, 1998. Biswas, S. S. and Pani, P.: Estimation of soil erosion using rusle
and gis techniques: a case study of barakar river basin, jhark-hand, india, Modeling Earth Systems and Environment, 1, 1–13, https://doi.org/10.1007/s40808-015-0040-3, 2015.
Borrelli, P., Panagos, P., Märker, M., Modugno, S., and Schütt, B.: Assessment of the impacts of clear-cutting on soil loss by water erosion in italian forests: first comprehensive monitoring and modelling approach, Catena, 149, 770–781, https://doi.org/10.1016/j.catena.2016.02.017, 2016.
Cai, C. F., Ding, S. W., Shi, Z. H., Huang, L., and Zhang, G. Y.: Study of applying USLE and geographical information sys-tem IDRISI to predict soil erosion in small watershed, J. Soil Water Conserv., 14, 19–24, https://doi.org/10.3321/j.issn:1009-2242.2000.02.005, 2000.
Cai, G. Q. and Liu, J. G.: Evolution of soil erosion mod-els in China, Progress in Geography, 22, 242–250, https://doi.org/10.3969/j.issn.1007-6301.2003.03.003, 2003. Cao, J., Yuan, D., Groves, C., Huang, F., Hui, Y., and Qian, L. U.:
Carbon fluxes and sinks: the consumption of atmospheric and soil co2 by carbonate rock dissolution, Acta Geol. Sin.-Engl., 86, 963–972, https://doi.org/10.1111/j.1755-6724.2012.00720.x, 2012.
Chen, L., Xie, G. D., Zhang, C. S., Li, S. M., Fan, N., Zhang, C. X., Pei, S., and Ge, L. Q.: Spatial distribution characteristics of soil erosion in Lancang river basin, Resources Science, 34, 1240– 1247, 2012.
Chen, X. P.: Research on characteristics of soil erosion in Karst mountainous region environment, Journal of Soil Erosion and Soil and Water Conservation, 3, 31–36, 1997.
Edgington, D. N., Klump, J. V., Robbins, J. A., Kusner, Y. S., Pampura, V. D., and Sandimirov, I. V.: Sedimentation rates, res-idence times and radionuclide inventories in lake baikal from 137cs and 210pb in sediment cores, Nature, 350, 601–604, https://doi.org/10.1038/350601a0, 1991.
Fernández, C. and Vega, J. A.: Evaluation of rusle and pe-sera models for predicting soil erosion losses in the first year after wildfire in nw spain, Geoderma, 273, 64–72, https://doi.org/10.1016/j.geoderma.2016.03.016, 2016.
Feng, M., Wang, Q., Hao, Q., Yin, Y., Song, Z., Wang, H., and Liu, H.: Determinants of soil erosion during the last 1600 years in the forest–steppe ecotone in northern china reconstructed from lacustrine sediments, Palaeogeogr. Palaeocl., 449, 79–84, 2016. Feng, T., Chen, H. S., and Wang, K. G.: 137Cs profile
distribu-tion character and its implicadistribu-tion for soil erosion on Karst slopes of Northwest Guangxi, Chinese Journal of Applied Ecology, 22, 593–599, https://doi.org/10.13287/j.1001-9332.2011.0123, 2011.
Feng, T., Chen, H., Polyakov, V. O., Wang, K., Zhang, X., and Zhang, W.: Soil erosion rates in two karst peak-cluster depres-sion basins of northwest guangxi,china:comparison of the rusle model with 137cs measurements, Geomorphology, 253, 217– 224, https://doi.org/10.1016/j.geomorph.2015.10.013, 2016. Ganasri, B. P. and Ramesh, H.: Assessment of soil erosion by
RUSLE model using remote sensing and GIS-A case study of Nethravathi Basin, Geoscience Frontiers, 7, 953–961, 2016. Gao, X., Xie, Y., Liu, G., Liu, B., and Duan, X.: Effects of
soil erosion on soybean yield as estimated by simulating gradually eroded soil profiles, Soil Till. Res., 145, 126–134, https://doi.org/10.1016/j.still.2014.09.004, 2015.
Guo, Q., Hao, Y., and Liu, B.: Rates of soil erosion in china: a study based on runoff plot data, Catena, 124, 6–76, https://doi.org/10.1016/j.catena.2014.08.013, 2015.
Hancock, G. J., Wilkinson, S. N., Hawdon, A. A., and Keen, R. J.: Use of fallout tracers 7 be, 210 pb and 137 cs to distin-guish the form of sub-surface soil erosion delivering sediment to rivers in large catchments, Hydrol. Process, 28, 3855–3874, https://doi.org/10.1002/hyp.9926, 2014.
Higgitt, D.: Soil erosion and soil problems, Prog. Phys. Geog., 17, 461–472, 1993.
Karamesouti, M., Petropoulos, G. P., Papanikolaou, I. D., Kairis, O., and Kosmas, K.: Erosion rate predictions from pesera and rusle at a mediterranean site before and after a wild-fire: comparison and implications, Geoderma, 261, 44–58, https://doi.org/10.1016/j.geoderma.2015.06.025, 2016.
Krklec, K., Domínguez-Villar, D., Carrasco, R. M., and Pedraza, J.: Current denudation rates in dolostone karst from central spain: implications for the forma-tion of unroofed caves, Geomorphology, 264, 1–11, https://doi.org/10.1016/j.geomorph.2016.04.007, 2016. Li, Y., Bai, X. Y., Zhou, Y., Qin, L., Tian, X., Tian, Y., and Li, P.
moun-tainous karst basin in sw china, based on gis and rusle, Arab. J. Sci. Eng., 41, 1–13, https://doi.org/10.1007/s13369-015-1742-6, 2016.
Li, Y. B., Wang, S. J., Wei, C. F., and Long, J.: The spatial distribu-tion of soil loss tolerance in carbonate area in Guizhou province, Earth of Environment, 4, 36–40, 2006.
Li, Y. B., Li, Q. Y., Luo, G. J., Bai, X. Y., Wang, Y. Y., Wang, S. J., Xie, J., and Yang, G. B.: Discussing the genesis of karst rocky de-sertification research based on the correlations between cropland and settlements in typical peak-cluster depressions, Solid Earth, 7, 741–750, https://doi.org/10.5194/se-7-741-2016, 2016. Ligonja, P. J. and Shrestha, R. P.: Soil erosion assessment in kondoa
eroded area in tanzania using universal soil loss equation, geo-graphic information systems and socioeconomic approach, Land Degrad. Dev., 26, 367–379, https://doi.org/10.1002/ldr.2215, 2015.
Liu, B. Y., Nearing, M. A., Shi, P. J., and Jia, Z. W.: Slope length effects on soil loss for steep slopes, Soil Sci. Soc. Am. J., 64, 1759–1763, 2000.
Liu, Q. J., An, J., Zhang, G. H., and Wu, X. Y.: The effect of row grade and length on soil erosion from concentrated flow in fur-rows of contouring ridge system, Soil Till. Res., 160, 92–100, 2016.
Martínez-Casasnovas, J. A., Ramos, M. C., and Benites, G.: Soil and water assessment tool soil loss simulation at the sub-basin scale in the alt penedÈs–anoia vineyard region (ne spain) in the 2000s, Land Degrad. Dev., 27, 160–170, https://doi.org/10.1002/ldr.2240, 2016.
Mohamadi, M. A. and Kavian, A.: Effects of rainfall patterns on runoff and soil erosion in field plots, International Soil and Water Conservation Research, 3, 273–281, 2015.
Munodawafa, A.: Assessing nutrient losses with soil erosion un-der different tillage systems and their implications on wa-ter quality, Phys. Chem. Earth Pt. A/B/C, 32, 1135–1140, https://doi.org/10.1016/j.pce.2007.07.033, 2007.
Park, S., Oh, C., Jeon, S., Jung, H., and Choi, C.: Soil erosion risk in Korean watersheds, assessed using the re-vised universal soil loss equation, J. Hydrol., 399, 263–273, https://doi.org/10.1016/j.jhydrol.2011.01.004, 2011.
Peng, T. and Wang, S. J.: Effects of land use, land cover and rainfall regimes on the surface runoff and soil loss on karst slopes in southwest china, Catena, 90, 53–62, 2012.
Renard, K. G., Foster, G. R., Weesies, G. A., Mccool, D. K., and Yo-der, D. C.: Predicting soil erosion by water: a guide to conserva-tion planning with the revised universal soil loss equaconserva-tion (rusle), Agriculture Handbook, United States Department of Agriculture (USDA), USA, 1997.
Rickson, R. J.: Can control of soil erosion mitigate water pollu-tion by sediments?, Sci. Total Environ., 468–469, 1187–1197, https://doi.org/10.1016/j.scitotenv.2013.05.057, 2014.
Sharpley, A. N. and Williams, J. R.: Epic-erosion/productivity im-pact calculator: 1. model documentation, Technical Bulletin – United States Department of Agriculture, 4, 206–207, 1990. Shi, Z. H., Cai, C. F., Ding, S. W., Wang, T. W., and Chow, T.
L.: Soil conservation planning at the small watershed level us-ing RUSLE with GIS: a case study in the Three Gorge Area of China, Catena, 55, 33–48, 2004.
Tan, B. X., Li, Z. Y., Wang, Y. H., Yu, P. T., and Liu, L. B.: Esti-mation of vegetation coverage and analysis of soil erosion using remote sensing data for Guishuihe drainage basin, Remote Sens-ing Technology and Application, 20, 215–220, 2005.
Terranova, O., Antronico, L., Coscarelli, R., and Iaquinta, P.: Soil erosion risk scenarios in the Mediterranean environment using RUSLE and GIS: an application model for Calabria (southern Italy), Geomorphology, 112, 228–245, 2009.
Tian, Y., Wang, S., Bai, X., Luo, G., and Xu, Y.: Trade-offs among ecosystem services in a typical karst water-shed, sw china, Sci. Total Environ., 566–567, 1297–1308, https://doi.org/10.1016/j.scitotenv.2016.05.190, 2016.
Wallbrink, P. J., Roddy, B. P., and Olley, J. M.: A tracer bud-get quantifying soil redistribution on hillslopes after forest har-vesting, Catena, 47, 179–201, https://doi.org/10.1016/S0341-8162(01)00185-0, 2002.
Wang, J., Zou, B., Liu, Y., Tang, Y., Zhang, X., and Yang, P.: Erosion-creep-collapse mechanism of underground soil loss for the karst rocky desertification in chenqi village, puding county, guizhou, China, Environ. Earth Sci., 72, 2751–2764, 2014. Wang, S. J. and Li, Y. B.: Problems and development trends about
researches on karst rocky desertification, Adv. Earth Sci., 22, 573–582, 2007.
Wang, X., Zhao, X., Zhang, Z., Yi, L., Zuo, L., Wen, Q., Liu, F., Xu, J., Hu, S., and Liu, B.: Assessment of soil erosion change and its relationships with land use/cover change in china from the end of the 1980s to 2010, Catena, 137, 256–268, https://doi.org/10.1016/j.catena.2015.10.004, 2016.
Wang, Y., Cai, Y. L., and Pan, M.: Soil erosion simulation of the Wujiang River Basin in Guizhou Province Based on GIS, RUSLE and ANN, Geology in China, 41, 1735–1747, 2014.
Wu, L., Liu, X., and Ma, X.: Application of a modified distributed-dynamic erosion and sediment yield model in a typical watershed of a hilly and gully region, Chinese Loess Plateau, Solid Earth, 7, 1577–1590, https://doi.org/10.5194/se-7-1577-2016, 2016. Xu, Y. Q. and Peng, J.: Effects of simulated land use change on soil
erosion in the Maotiao River watershed of Guizhou Province, Resources Science, 30, 1218–1225, 2008.
Xu, Y. Q., Shao, X. M., Kong, X. B., Peng, J., and Cai, Y. L.: Adapt-ing the rusle and gis to model soil erosion risk in a mountains karst watershed, guizhou province, china, Environ. Monit. As-sess., 141, 275–286, https://doi.org/10.1007/s10661-007-9894-9, 2008.
Yang, Q., Xie, Y., Li, W., Jiang, Z., Li, H., and Qin, X.: Assessing soil erosion risk in karst area using fuzzy modeling and method of the analytical hierarchy process, Environ. Earth Sci., 71, 287– 292, https://doi.org/10.1007/s12665-013-2432-x, 2014. Zeng, L. Y., Wang, M. H., and Li, C. M.: Study on soil
ero-sion and its spatio-temporal change at Hongfeng Lake watershed based on RUSLE Model, Hydrogeology and Engineering Ge-ology, 38, 113–118, https://doi.org/10.16030/j.cnki.issn.1000-3665.2011.02.003, 2014.