www.atmos-meas-tech.net/6/3131/2013/ doi:10.5194/amt-6-3131-2013
© Author(s) 2013. CC Attribution 3.0 License.
Atmospheric
Measurement
Techniques
Quantitative single-particle analysis with the Aerodyne aerosol mass
spectrometer: development of a new classification algorithm and its
application to field data
F. Freutel1, F. Drewnick1, J. Schneider1, T. Klimach1, and S. Borrmann1,2 1Max Planck Institute for Chemistry, Mainz, Germany
2Institute of Atmospheric Physics, Johannes Gutenberg University Mainz, Mainz, Germany
Correspondence to: F. Freutel ([email protected]) and J. Schneider ([email protected])
Received: 3 May 2013 – Published in Atmos. Meas. Tech. Discuss.: 24 June 2013
Revised: 18 September 2013 – Accepted: 21 October 2013 – Published: 19 November 2013
Abstract. Single-particle mass spectrometry has proven a valuable tool for gaining information on the mixing state of aerosol particles. With the Aerodyne aerosol mass spec-trometer (AMS) equipped with a light-scattering probe, non-refractory components of submicron particles with diame-ters larger than about 300 nm can even be quantified on a single-particle basis. Here, we present a new method for the analysis of AMS single-particle mass spectra. The developed algorithm classifies the particles according to their compo-nents (e.g. sulphate, nitrate, different types of organics) and simultaneously provides quantitative information about the composition of the single particles. This classification algo-rithm was validated by applying it to data acquired in labo-ratory experiments with particles of known composition, and applied to field data acquired during the MEGAPOLI sum-mer campaign (July 2009) in Paris. As shown, it is not only possible to directly measure the mixing state of atmospheric particles, but also to directly observe repartitioning of semi-volatile species between gas and particle phase during the course of the day.
1 Introduction
A mixture of atmospheric aerosol particles can comprise sin-gle particles of vastly different chemical composition, size and properties, depending on the particles’ individual sources and atmospheric processing (Pöschl, 2005). Especially in or-der to gain direct information on the mixing state of these particles, the chemical composition of the individual
parti-cles needs to be analysed. Also particle types present only in low numbers might not be detected by analysis of the whole particle ensemble, but only by single-particle analy-sis. Though rare, they nonetheless could be of interest, e.g. because they are characteristic for a specific source.
optical detection typically here is on the order of about 300 nm particle diameter (Liu et al., 2013).
Like for single-particle mass spectra acquired with LDI instruments (Hinz and Spengler, 2007), the data analysis of single-particle mass spectra acquired with the AMS is not straightforward. Few attempts have been made so far to anal-yse AMS single-particle mass spectra from ambient air sam-pling (Cross et al., 2009; Liu et al., 2013). In both cases, the standard fragmentation pattern table (Allan et al., 2004), which was developed to deconvolute the mass spectral con-tribution of nitrate, sulphate, ammonium, chloride and organ-ics to ensemble AMS mass spectra, was applied to the single-particle mass spectra. By this means, the mass spectra of only the organic content of the individual particles were separated. This approach has certain drawbacks: the fragmentation pat-tern table was developed especially for an ensemble of am-bient particles; i.e. it assumes the measured ensemble to al-ways consist of the five aforementioned components, with time-varying relative contributions. While this is applicable in most cases to ensemble data, this cannot be expected per se from single particles, which may consist only of one or some of these constituents. Furthermore, with the fragmenta-tion pattern table the relative signal contribufragmenta-tion of different species at various mass-to-charge ratiosm/zare calculated from signal intensities at otherm/z(Allan et al., 2004). This is appropriate for ensemble mass spectra with good signal-to-noise ratio, but adds further uncertainty in the mass contribu-tions obtained for the single-particle mass spectra. Also the organic fragmentation pattern obtained by this means might be more or less disturbed. This can be problematic especially for particle mass spectra with very unusual fragmentation patterns, which thereby might be easily missed or misinter-preted.
To gain additional information on the organic mass frac-tion of individual particles, different methods were adopted in the aforementioned publications. Cross et al. (2009) ap-plied a method derived from principal component analysis (Zhang et al., 2005); Liu et al. (2013) used k-means clus-tering (Bishop, 2006) to classify different types of organic aerosol mass spectra. Both methods provided similar results, in that they separated OOA-like (oxygenated organic aerosol) and HOA-like (hydrocarbon-like organic aerosol) mass spec-tra. Liu et al. (2013) furthermore separated two subtypes of OOA that were interpreted to be more and less volatile due to slight differences in the cluster centroid mass spectra. Both methods, however, have the inherent problem of not yielding comparable results between different datasets. For example, an “HOA-like” cluster mass spectrum of one dataset might look different from an HOA-like cluster mass spectrum re-trieved for another dataset, and it is the subjective decision of the user to decide whether they are similar enough to com-prise the same type of organic matter. In addition, both meth-ods were not able to identify particles present only in a low number fraction. The method used by Cross et al. (2009) is only capable of identifying HOA and OOA content, and will
not provide information on any other particle type. With k-means clustering as applied by Liu et al. (2013), in principle it should be possible to identify also new, so far unknown particle types, as the clustering is not constrained to any spe-cific mass spectral patterns. However, if these particles are occurring only in a low number fraction (depending on the specific dataset), they might easily be mixed into the clusters dominated by other particle types, and thereby be missed. Furthermore, for our datasets presented here we found that this method is typically not able to separate particles with the same components but in different degrees of mixing, and therefore can only provide limited information about the par-ticles’ mixing state.
Here, we present a new method to reliably identify and also quantify components within single-particle mass spectra acquired with the AMS. The algorithm yields well-defined results, which are comparable between different datasets, and gives direct information on the quantitative composi-tion of the individual particles and their mixing state. Fur-thermore, the algorithm is able to recognize individual parti-cles of specific types within the dataset, and it can be easily adapted to identify new, so far unknown particle types. The algorithm was validated using mass spectra of laboratory-generated particles of known composition, and applied to single-particle mass spectra acquired during ambient mea-surements in Paris, France, in summer 20091.
2 Materials and methods
Instrument details: a C-ToF-AMS (Compact ToF-AMS,
Aerodyne, Inc.; Drewnick et al., 2005) equipped with an LSP as described in detail in Cross et al. (2007, 2009) and Liu et al. (2013) was used in this work. In short, the particle beam entering the instrument is chopped at its front end by a spin-ning wheel with two slits to determine the starting point of the measurement. The light-scattering probe is mounted at a distance of 0.265 m from the chopper. It consists of an unfo-cused continuous wave laser (CrystaLaser, model BCL-050-405, 405 nm, 50 mW) and an elliptic mirror, which focuses scattered light from particles passing the laser beam onto a photomultiplier tube. The vaporizer is situated at a distance of 0.395 m from the chopper. Here, non-refractory material is flash-vaporized and consecutively ionized by electron im-pact, and the resulting ions are orthogonally extracted into the ToF mass spectrometer. During measurement in light-scattering mode, time-resolved mass spectra are recorded (here: 250 per chopper cycle), and if a particle is detected during one chopper cycle at the photomultiplier tube of the LSP, the time-resolved mass spectra of the whole chopper cycle are saved along with the light-scattering signal.
To retrieve single-particle mass spectra from the measured raw data, the AMS single-particle data analysis software 1The content of this paper has, in different form, been published
Sparrow, version 1.04A (Sparrow, 2013), was used, modified and extended within this work. Sparrow as well as the clas-sification algorithm described in this work have been devel-oped within the framework of the scientific calculation soft-ware tool IGOR Pro, version 6.22A (Wavemetrics, Inc.).
For all measurements, single ion area (Jayne et al., 2000) was determined for the mass spectrometer on a regular ba-sis to be able to convert the raw measured signal into num-ber of ions. On-board AP240 thresholding (Kimmel et al., 2006) was used during all measurements with a threshold of 4–5 bits. During all measurements, the AMS was operated with a vaporizer temperature of∼600◦C; only during the first two weeks of the MEGAPOLI summer campaign (see below) was it set to∼800◦C. No indication was found from comparison to co-located instruments that this difference in vaporizer temperature caused any differences in fragmenta-tion patterns or mass concentrafragmenta-tion measurements (Freutel et al., 2013).
In all measurements the standard AMS aerodynamic lens was used, which has its lower and upper 50 % cut-off at par-ticle sizes of about 70 nm and 750 nm vacuum-aerodynamic diameter, respectively (Liu et al., 2007). For LSP detec-tion efficiency, the lower 50 % cut-off particle size was at ∼380 nm volume-equivalent diameter for the measurements within this work. The detection efficiency reached about 100 % for particles ≥400 nm. The measured number dis-tribution in this size range agreed well with that from co-located measurements of an optical particle counter during the MEGAPOLI 2009 campaign (see below). All conclu-sions drawn from AMS single-particle data in this work (e.g. on number concentrations or average mass per particle) are based on this size range.
Retrieval of particle mass spectra: each
single-particle dataset consists of the time-resolved light-scattering signal and the time-resolved mass spectra, both acquired dur-ing one individual chopper cycle. In order to extract the single-particle mass spectrum from these mass spectra, the method described by Cross et al. (2009) was slightly modi-fied: first, for each chopper cycle the temporal evolution of the total ion current (TIC), calculated as the sum of all sig-nificant signals butm/z18, 28, and 32, was determined (m/z 18, 28 and 32 were excluded due to high background signal from water, N2 and O2). “Significant” here means a maxi-mum intensity of more than three times the standard devia-tion of the background regions, i.e. the mass spectra at the beginning and the end of the chopper cycles. The time of detection of the particle in the mass spectrometer is identi-fied from the maximum in the TIC signal. As ions from this single-particle evaporation event are distributed over several mass spectra around this maximum, all these mass spectra need to be summed to obtain the overall mass spectrum of the single particle. To do so, the summation region is determined around the TIC maximum as all mass spectra that contain significant signal, including at most five data points in each direction. If this summation region contains at least two mass
spectra, allm/zbut 18, 28 and 32 are summed over the cor-responding consecutive mass spectra, and the corcor-responding background (average of mass spectra from the background regions) is subtracted. Ion duty cycle correction (Drewnick et al., 2005) and single ion area are applied to convert the signal of the resulting mass spectrum into ion-duty-cycle-corrected number of ions.
It was found that these integrated mass spectra on aver-age contain about 80 % of the total measured mass from the respective single-particle event. The remaining 20 % are con-tained within the tailing of the TIC peak (slow vaporization) and are not regarded in the determination of the summation region due to their insignificant signal.
Of all retrieved mass spectra, only those are used for the further analysis for which
– the flight time measured between chopper and detec-tion in the mass spectrometer fits within 20 % to the expected arrival time calculated from the flight time between chopper and detection of the light-scattering signal;
– the sum of (positive and negative) signals in the single-particle mass spectrum is at least 5 ions, and a mini-mum signal of 5 ions is found at least at onem/z be-tweenm/z18 and 200 (both without regarding signal atm/z18, 28, 32);
– in the light-scattering signal, no indication for coinci-dent particles is found (Liu et al., 2013).
Particle generation: for the laboratory measurements
(Ta-ble 1), an aqueous solution (emulsion in the case of oleic acid) of the respective substance or mixture of substances was nebulized (nebulizer model 3075, TSI Inc.). The aerosol was dried using two consecutive silica gel diffusion driers, and led through 1/4” stainless steel tubing to a differential mobility analyser (model 3080, TSI Inc.) for size selection. From there, the aerosol flow was split and led in parallel to a condensation particle counter (Grimm, model 5.401) and the C-ToF-AMS.
Source measurement: for the measurement of engine
Table 1. Measurements of reference single-particle mass spectra.
Substance Reagent grade and
manufacturer
Particle mobility diameter/nm
Number of single-particle mass spectra retrieved
Number of ions in single-particle mass
spectruma(average and standard deviation)
Markerm/z m/zin marker MS
Laboratory measurements (10 s/20 s/30 s in MSb/PToFc/LSdmode): NH4NO3 p.a.,
Labor-Service GmbH
400 180 nitrate: 123±46 30, 46e 30, 46
(NH4)2SO4 p.a., Merck 400 80 sulphate: 67±35 48, 64, 80, 81,
98e
48, 64, 80, 81, 98
internally mixed NH4NO3/ (NH4)2SO4
see pure substances
400 106 nitrate: 68±33 sulphate: 25±17
– –
glucose α−D-(+) -glucose monohydrate,
≥99.5 %, Roth
400 313 glucose: 347±181 31, 60f 29, 31, 43, 60, 73
internally mixed NH4NO3/
(NH4)2SO4/
glucose
see pure substances
400 864 nitrate: 42±21 sulphate: 17±13 glucose: 96±43
– –
oleic acid vegetable, extra pure, Merck
400 476 oleic
acid: 295±245
55f 41, 43, 55, 69, 83
succinic acid ≥99 %, Alfa Aesar
400 188 succinic acid: 101±72
– –
Source measurement (10 s/20 s/30 s in MS/PToF/LS mode): gasoline engine
exhaust
– polydisperse, (300±100)g
53 exhaust: 884±1785
57f 41, 55, 69, 83
Ambient measurement (20 s/20 s/20 s in MS/PToF/LS mode): OOA internally
mixed with ni-trate, sulphate
– polydisperse, (560±90)g
822 OOA: 104±56 nitrate: 43±58 sulphate: 36±33
44f 44, 55
am/z14–18, 28, 32 not regarded; sulphate, nitrate calculated as sum of all respective markerm/z.
bMS: mass spectra mode. Yields the ensemble mass concentrations of organics, nitrate, sulphate, ammonium, and chloride. See e.g. Canagaratna et al. (2007). cPToF: particle time of flight mode. Yields the ensemble mass size distributions for the species listed underb. See e.g. Canagaratna et al. (2007).
dLS: light-scattering mode. Yields the single-particle mass spectral data as described e.g. in Cross et al. (2009). eSum of signal at all markerm/zneeds to be≥5 ions for positive detection (see Fig. 2).
fSignal at each markerm/zneeds to be≥1 ion for positive detection (see Fig. 2).
during this source measurement was compared to ensem-ble mass spectra obtained from diesel exhaust measurements (Canagaratna et al., 2004; Schneider et al., 2006), and found to agree very well (values of the squared Pearson’s correla-tion coefficientR2were 0.96 and 0.92, respectively).
Field measurements: particles from ambient air were
mea-sured in a north-eastern suburb of Paris, France, during the MEGAPOLI summer campaign (1–31 July 2009). Details about this campaign, the sampling of the C-ToF-AMS, and comparison to co-located measurements can be found in Freutel et al. (2013). As presented in Freutel et al. (2013), both total mass concentration time series and average ensem-ble volume size distributions measured by the AMS agree within about 10–20 % with respective measurements of co-located instruments. For this dataset, from 107 734 single-particle events, 26 123 single-single-particle mass spectra could be retrieved after applying the criteria described above. The ma-jor reason (in about 90 % of all cases) for particle events to be excluded was low ion signal.
It was found that the shape of the number size distribu-tion of those particles for which mass spectra were retrieved was very similar to that of all particles detected by the LSP. Only the largest particles were slightly underestimated, likely due to increasing bounce-off from the vaporizer, as also found e.g. for impactors (Hinds, 1999). For a comparison of mass size distributions, the time-resolved TIC of all single-particle events was used. The summed time-resolved TIC of all single-particle events, after applying the necessary con-version factors, was in agreement with ensemble size distri-bution measurements in the range of optimum LSP detection efficiency. Also the sum of the time-resolved TIC of all single particles was compared to that of only the particles for which mass spectra were retrieved. This comparison showed that only about 20 % of the total measured mass was not included within the particle events used for the further analysis. All in all, the time-resolved TIC from all particles was comparable to that of only the particles used in the analysis. Only for the largest particle sizes was a slight underestimation found of the retrieved particle mass compared to the whole measured mass, due to delayed vaporization events which are not in-cluded in the analysis (see above). From these comparisons, it therefore is assumed that the analysed subset of data is rep-resentative of the whole particle population, and that the ma-jority of particles not included in the analysis due to missing mass spectra are of comparable composition to the ones in-vestigated.
In order to obtain typical single-particle mass spectra of OOA, from all single-particle mass spectra sampled those resembling internal mixtures of OOA, nitrate and/or sulphate were extracted as follows: for each single-particle mass spec-trum, the signal atm/z 30 and 46 was summed as a proxy for the nitrate content, and the signal at m/z 48, 64, 80, 81, and 98 as a proxy for the sulphate content. The signal at the remainingm/z(withoutm/z16, 17, 18, 28, and 32) was summed as a proxy for the content of organics. A
po-tential interference of chloride with this calculated organic content was considered insignificant as its average mass con-centration was negligible during this campaign (Freutel et al., 2013). From these values, for each single-particle mass spec-trum the relative contribution of organics to the total ion sig-nal was calculated. All single-particle mass spectra contain-ing similar organic contributions were averaged. Inspection of these average single-particle mass spectra showed that for particles with less than 80 % organic content (by ion num-ber), the average mass spectrum resembled that of an inter-nal mixture of OOA and inorganics. For particles with higher organic content, the average mass spectrum resembled pure hydrocarbon-like organic aerosol (examples of mass spectra from both types of organic aerosol can be found e.g. in Zhang et al., 2011). Therefore, all particles with less than 80 % or-ganic content were classified as “OOA-containing”. Out of those, 10 % were randomly chosen for the development and testing of the classification algorithm described in Sect. 3.1. To ensure sufficient signal-to-noise ratio, only mass spectra with absolute organic signal of at least 50 ions were used, which resulted in a total of 822 single-particle mass spectra used for the further analysis described in Sect. 3.1.
3 Results and discussion
3.1 Development and validation of a classification algorithm
3.1.1 Working principle of the classification algorithm
From the single-particle measurements listed in Table 1, av-erage reference single-particle mass spectra of ammonium nitrate and sulphate, glucose, oleic acid, engine exhaust, and OOA (internally mixed with ammonium nitrate and sulphate) were determined. Ammonium nitrate and sulphate are com-monly found in atmospheric aerosol, as well as engine ex-haust organic aerosol and OOA (Zhang et al., 2007). Glu-cose, the building element of cellulose, is used here as a proxy for cellulose-derived sugars and anhydrosugars orig-inating from biomass or biomass burning organic aerosol particles (Simoneit, 2002). This was validated by a compari-son of the ensemble mass spectrum of glucose with those of levoglucosan (R2of 0.86), glycogen (R2of 0.70) (all from Schneider et al., 2011) and the average mass spectrum of biomass burning organic aerosol obtained via positive ma-trix factorization from different datasets (R2of 0.50) (Ng et al., 2010). Oleic acid is used as a proxy for cooking-related organic aerosol particles (Allan et al., 2010).
Fig. 1. Example for the application of the algorithm on one
single-particle mass spectrum containing OOA, sulphate and nitrate. MS: mass spectrum.
single-particle mass spectrum via linear correlation to the reference mass spectra and additionally checks for the pres-ence of signal at specific markerm/z (Table 1). If a com-pound is unambiguously detected by both methods, the ref-erence mass spectrum is scaled accordingly and subtracted from the single-particle mass spectrum (Fig. 1). The needed scaling factor (SMS−retrieval) for doing so is determined by fitting a linear regression line (with intercept=0) to the scat-ter plot of the so-called “marker MS” of the measured and reference single-particle mass spectra. These marker MS do not include allm/z, but only some characteristic and signal-intensivem/zof the respective substance (Table 1). Note that them/zused for the marker MS are not necessarily identi-cal to the markerm/zused for identification of the substance (see Table 1).
As shown in Fig. 2, the algorithm first only checks for the presence of the inorganic compounds nitrate and sulphate, before organic compounds are tested. This order was selected because if inorganic compounds are present, they usually dominate the single-particle mass spectrum, so they need to be removed first in order to be able to reliably identify the ganic components. For the subsequent correlation of the or-ganic compounds, depending on the number of components
Fig. 2. Schematics of the developed classification algorithm. SO4:
sulphate; NO3: nitrate; Org: organics; MS: mass spectrum; &&:
logical AND. For further information on the different steps, refer to Sect. 3.1.1.
already subtracted from the single-particle mass spectrum, different thresholds of the squared Pearson’s correlation co-efficientR2are used as an indication for positive detection of the substances (Fig. 2). This is supposed to enable the de-tection of minor components in a mixture, without causing too many erroneous detections. TheR2threshold values are based on typicalR2values obtained for correlation of mass spectra from single particles containing the respective sub-stance with the reference mass spectra. For the lowering of the threshold with each subtraction, an arbitrary value was chosen. TheseR2values might still be optimized by valida-tion with more laboratory datasets.
For each component identified, the corresponding num-ber of ions subtracted from the mass spectrum (excluding m/z 14–17 to avoid influence of ammonium and water) is saved as quantitative information regarding the contribu-tion of this substance to the total mass spectrum measured (Fig. 1). Compounds are only considered detected if their quantitative contribution exceeds a number of at least five ions, such that the relative counting statistics uncertainty is below 50 %. At the end of this procedure, if no further com-ponent is detected, the remaining signal is saved as residual mass spectrum.
Calculation of mass per particle: similar to the calculation
of AMS ensemble mass concentrations from the measured number of ions as described e.g. in Jimenez et al. (2003), the retrieved number of ionsIions of the different components can be converted into the mass per particle of these species (Mspecies)using the equation
Mspecies=
Iions·Sions,species·MWNitrate NA·RIEspecies·IE
. (1)
the ionization efficiency of nitrate which is determined rou-tinely in laboratory calibrations using ammonium nitrate. Sions,speciesis a scaling factor for the respective species which accounts for the fact thatm/z14–18, 28, and 32 are not in-cluded for the calculation of Iions from the single-particle mass spectra due to the influence of high background sig-nal at thesem/z. Using the average reference mass spectra, the fractional contribution of mass spectral signal at the ne-glectedm/zcan be calculated. From this, the resulting scal-ing factorsSions,species were found to be 1 for nitrate, and 1.1 for sulphate and for organic species. The latter was cal-culated as the average scaling factor from those derived for oleic acid and glucose. For the calculation of Sions,glucose, the signal atm/z 16, 17 and 18 in the glucose mass spec-trum was calculated from the mass spectral signal atm/z44 (analogous to the ensemble fragmentation pattern table) to account for the presence of water of crystallization. A con-servative estimate of the uncertainty ofSions,species(1scaling) is 10 %, determined from the variation observed for the or-ganic substances investigated. To further reduce this uncer-tainty,Sions,organics should be determined for a larger variety of different organic substances.
RIEspeciesare the relative ionization efficiencies also used for the calculation of ensemble mass concentrations of ni-trate, sulphate and organics (standard RIEspeciesvalues: 1.1, 1.2, and 1.4, respectively; Canagaratna et al., 2007). For the specific instrument employed in this work, an RIEsulphateof 0.76 and an RIEorganics of 1 was used. These values were derived from calibration measurements using NH4NO3 and (NH4)2SO4in the case of sulphate, and from the comparison to a co-located AMS during two measurement campaigns in the case of organics (Freutel et al., 2013; Crippa et al., 2013). RIEorganics therefore in this case is associated with a higher uncertainty (1RIE). This uncertainty is estimated to be 20 % from the range of values of RIEorganicsobserved, instead of 10 % as for RIEnitrateand RIEsulphate. If the RIEspeciesvalue of a certain species is not known, RIEspeciesis set to 1, and a nitrate-equivalent mass of this species is obtained.
Uncertainty estimate of calculated mass per particle: the
uncertainty1massof the different substances’ relative mass contributions to the single-particle mass spectrum can be es-timated as
1mass=
q
12scaling+12MS−retrieval+12RIE, (2) with 1MS−retrieval the relative uncertainty for the subtrac-tion of the reference mass spectra from the single-particle mass spectra (i.e. the uncertainty in the determination of SMS−retrieval). This uncertainty is dominated by counting statistics, i.e. random, while both1scalingand1RIE are sys-tematic errors.1MS−retrieval can be estimated from the stan-dard deviation of average residuals after the subtraction of the reference mass spectra from the single-particle mass spectra of pure substances (ammonium nitrate, ammonium sulphate, glucose, and oleic acid) as about 20 % for a
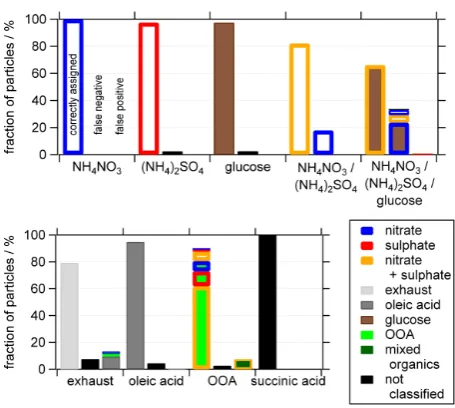
single-Fig. 3. Qualitative validation of the algorithm. On thexaxis the dif-ferent particle types of known composition (compare Table 1) are shown. For each particle type, the left bar shows the fraction of cor-rectly assigned particle mass spectra, the middle bar the fraction of false negatives, and the bar on the right-hand side the fraction of false positives. The border colour of the bars represents the identi-fied inorganic content, the fill colour the identiidenti-fied organic content. Particles in which no component was identified are shown in black. For the particles of the OOA type, the exact content of nitrate, sul-phate and OOA is not known; therefore, all particle mass spectra have been regarded as correctly assigned where at least one of these components was detected.
particle mass spectrum. For a larger number of single-particle mass spectran,1MS−retrievalscales with 1
√ n.
Note that1mass is the overall uncertainty of the relative mass contribution.1mass can be estimated using Eq. (2) to be 25 % for inorganics and 30 % for organics. For a larger number of mass spectra, the uncertainty is reduced to about 15 % for inorganics and 25 % for organics. The absolute mass concentration is subject to additional uncertainties (e.g. the uncertainty of IE).
3.1.2 Application to laboratory-generated mass spectra
Validation of classification: for validation purposes, the
For pure substances (particles with 400 nm mobility diam-eter) and particles from a single source, generally more than 90 % of all particle mass spectra were correctly assigned; the number of false positive detections typically was very low (< 1 %). The only exception were the engine exhaust mass spectra, for which only about 80 % of all mass spectra were correctly assigned; the remaining mass spectra were to a large extent incorrectly assigned as “oleic acid”. This is due to the fact that both oleic acid and engine exhaust unit mass resolution spectra exhibit typical patterns of hydrocarbon-like organic aerosol (R2 for correlation of reference mass spectra is 0.76), so a distinction between these two species is difficult.
For mixtures of different substances, the fraction of com-pletely correctly assigned particle mass spectra was decreas-ing with an increasdecreas-ing number of components: for mixtures of nitrate and sulphate, about 80 %, and for mixtures of ni-trate, sulphate and glucose, about 60 % of all mass spec-tra were correctly assigned to all components. The remain-ing fraction of particles for the most part consisted of false negatives. For all laboratory measurements, particles of the same size (400 nm mobility diameter) have been used. There-fore, an increasing number of components in the particles led to a decreasing absolute signal for the individual compo-nents, which complicates their detection. This demonstrates the limitation of detection due to counting statistics, since the retrieved number of ions in AMS measurements scales linearly with the number of molecules per particle (Jayne et al., 2000). Further work is needed to determine estimates of the limits of detection for the different compounds.
For the particles consisting of a mixture of OOA, am-monium nitrate and sulphate, the exact composition is not known as they are retrieved from ambient aerosol sampling (see Sect. 2). Therefore, all particles were classified as as-signed correctly for which at least one of these components was identified by the algorithm, which is the case for about 90 % of all particles (Fig. 3). In about 60 % of all particle mass spectra, all three components were detected. Only for a small fraction of particles (< 8%) were components found other than OOA, nitrate and sulphate; these are (short of knowing the exact composition) considered false positives in Fig. 3.
Pure succinic acid particles were also tested. This particle type was not integrated into the classification algorithm, and is used here as an example of an “unknown” particle type which should not be classified by the algorithm. Indeed, no false positives are found for this “alien” particle type, demon-strating the ability of the algorithm to also separate hitherto unknown particle types.
Validation of quantification: the correctness of
quantifi-cation was investigated through the comparison of single-particle and ensemble measurements. For this, the measure-ments of laboratory-generated, internally mixed particles of ammonium nitrate and sulphate, and of ammonium nitrate, ammonium sulphate and glucose were used. At the
investi-gated particle size of 400 nm mobility diameter, all particles of the same type can reasonably be assumed to have the same relative composition. For both measurements, the average relative composition was retrieved from the single-particle mass spectra using the described algorithm and compared to the composition measured simultaneously in ensemble mode (Table 2). Since ensemble and single-particle measurements are not directly comparable, different methods for the cal-culation of the relative composition obtained from single-particle measurements were evaluated:
– ratio of averages,
– average ratios, and
– Gaussian fit to the distribution of ratios observed.
For the ratio of averages, averages were determined
– for only a subset of particles sampled – namely only for particles in which both substances were identified whose ratio is calculated (termed “identified” in Ta-ble 2) – and
– for all particles of the respective dataset (termed “all” in Table 2). In this case, if a substance was not detected within a particle, the content is assumed to be zero. These two methods give slightly different results. Compared to the results for only the identified particles, when including all particles, the average content is underestimated strongly for sulphate and slightly for glucose. This is due to the fact that all particles with content below a threshold of 5 ions are assumed to contain none of the respective substance (com-pare Figs. 2 and 3). This lowers the calculated ratio of sul-phate to nitrate and of sulsul-phate to glucose, and increases the ratio of nitrate to glucose (Table 2). This demonstrates the limitation of quantification on a single-particle basis due to the threshold of minimum number of ions for positive detec-tion. Further work is needed to determine the limits of quan-tification for the different substances in detail.
Also the average ratio and Gaussian fit to the distribution of ratios yield slightly different results (for both methods, only particles were used in which both respective substances were identified): due to the fact that the distribution of ratios is not symmetrical, the value obtained from the Gaussian fit is typically smaller than the average ratio (Table 2).
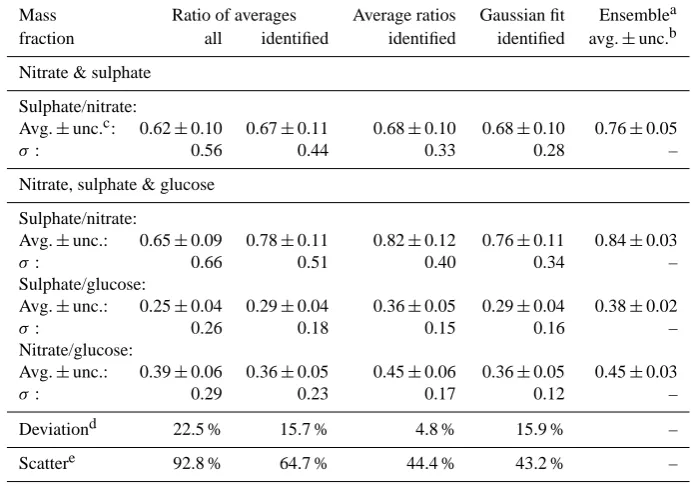
Table 2. Comparison of relative composition from single-particle and ensemble measurements of internally mixed particles of nitrate and
sulphate, and of nitrate, sulphate and glucose. In the case of ensemble measurements, ratios of average mass concentrations are given. For the single-particle measurements, the average ratios and standard deviations (σ) were determined using three different methods: ratio of the averages, average ratios, and a Gaussian fit to the distribution of ratios observed. All: all particles of this type; identified: only for particles of this type in which both respective substances were identified; avg.: average; unc.: uncertainty.
Mass Ratio of averages Average ratios Gaussian fit Ensemblea fraction all identified identified identified avg.±unc.b Nitrate & sulphate
Sulphate/nitrate:
Avg.±unc.c: 0.62±0.10 0.67±0.11 0.68±0.10 0.68±0.10 0.76±0.05
σ: 0.56 0.44 0.33 0.28 –
Nitrate, sulphate & glucose Sulphate/nitrate:
Avg.±unc.: 0.65±0.09 0.78±0.11 0.82±0.12 0.76±0.11 0.84±0.03
σ: 0.66 0.51 0.40 0.34 –
Sulphate/glucose:
Avg.±unc.: 0.25±0.04 0.29±0.04 0.36±0.05 0.29±0.04 0.38±0.02
σ: 0.26 0.18 0.15 0.16 –
Nitrate/glucose:
Avg.±unc.: 0.39±0.06 0.36±0.05 0.45±0.06 0.36±0.05 0.45±0.03
σ: 0.29 0.23 0.17 0.12 –
Deviationd 22.5 % 15.7 % 4.8 % 15.9 % – Scattere 92.8 % 64.7 % 44.4 % 43.2 % –
aEnsemble mass concentrations are calculated using a slightly modified organic fragmentation pattern table
(frag_organics[30]=1.49*frag_organics[44]. frag_organics[39]=39; frag_organics[41]=41) inferred from the average ensemble mass spectrum of pure glucose.
bThe uncertainty range is estimated from the standard deviation of the average, and from additional uncertainties of 1 %
and 4 % for the mass concentrations of nitrate and glucose, respectively, conservatively estimated from the range of values derived with and without changes in the fragmentation pattern table (changes in the organic pattern described undera, and changes due to corrections from measurements of particulate-free air).
cThe statistical uncertainty of the average (Gaussian fit: obtained from the fitting procedure; otherwise: standard deviation
of the average) and1scaling(10 %) of sulphate, nitrate and glucose are considered in the uncertainty range given.1RIE was not regarded as it affects results from single-particle and ensemble measurements in the same way.
dAverage deviation from ensemble average relative to the ensemble average. eAverage relative standard deviation.
only identified particles) it seems like the sulphate-to-nitrate ratio is well represented within the uncertainties, while the sulphate-to-glucose and nitrate-to-glucose ratios show some larger, systematic deviations. These seem to indicate a slight overestimation of the glucose content within the particles. This could possibly be due to an additional systematic error in the determination of the scaling factor for the reference mass spectrum,SMS−retrieval (see Sect. 3.1.1), which is not included in the statistical error calculated for1MS−retrieval. In further work, this potential source of error should be in-vestigated in more detail and, if possible, quantified.
Also the average standard deviation (an indication for the scatter of values observed for the single particles around the average value; as a measure of precision) shows systematic differences between the different methods. While the stan-dard deviation obtained from the width of the Gaussian fit is smallest, the standard deviation of the average ratios is slightly larger, since also the largest ratios which do not
influ-ence the standard deviation from the Gaussian fit are included here. These standard deviations of about 45 % reflect the un-certainty for the ratio obtained from one single-particle mass spectrum. This uncertainty is somewhat larger than what can be estimated from Eq. (2), and therefore likewise points to the fact that not all uncertainties (especially of1MS−retrieval) might be identified yet. The standard deviation from the ratio of averages is even larger, since here not only the distribution of the ratios plays a role, but also the distribution of the par-ticle sizes (even though monodisperse parpar-ticles were inves-tigated, these show a distribution around the average value). Finally, the average standard deviation is largest when in-cluding all values for the ratio of averages, since here also the most extreme values (0 ions detected) are included.
measurements presented in Table 2 shows that quantitative information regarding the average content of the individ-ual particles can be obtained using the described algorithm. The uncertainty of this average content is mostly due to 1RIE, 1scaling and likely an additional systematic error in 1MS−retrieval, which needs to be investigated in more detail. 3.2 Single-particle measurements in the field
3.2.1 Application of the algorithm to field data
In Sect. 3.1.2, we have shown that the developed classifica-tion algorithm is capable of providing qualitative and quanti-tative information about the composition of single particles. For an application to single-particle mass spectra acquired from measurements of ambient air, the fact also has to be ac-counted for that particle types might exist in the atmosphere which the algorithm is not able to recognize. Therefore, the following approach for the analysis of single-particle mass spectra acquired in field measurements is suggested: first, the classification algorithm is applied to the whole dataset of single-particle mass spectra, after which ideally all spec-tra of unknown particle types remain unclassified. In a sec-ond step, all mass spectra which could not be classified by the algorithm are clustered either manually, or by using clus-tering algorithms likek-means (Bishop, 2006) or fuzzy c-means clustering (Bezdek et al., 1984). If by this procedure new particle types or components are found, the classifica-tion algorithm can be adapted accordingly, in order to detect these as well. The modified algorithm then is applied again to the whole dataset, and this is repeated until no new particle types can be found in the particle mass spectra not classified by the algorithm. Using this approach it is possible to detect not only known particle components, but also new, foreign particle types, even if they are present only in low numbers.
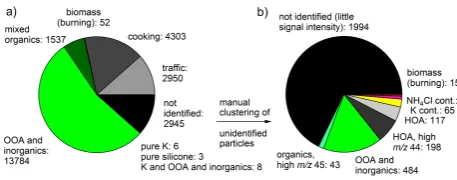
This approach was tested on a dataset acquired during measurements of ambient air in Paris during the MEGAPOLI summer 2009 campaign (see Sect. 2). When applying the original classification algorithm on the whole dataset of 26 123 single-particle mass spectra, 86.4 % of all mass spec-tra were classified into one of the following groups:
– “cooking” (only oleic acid detected),
– “traffic” (only engine exhaust detected),
– “biomass (burning)” (only glucose detected),
– “OOA and inorganics” (OOA and/or sulphate and/or nitrate detected), and
– “mixed organics” (organics other than OOA mixed with inorganics and/or another type of organics de-tected).
The mass spectra not identified by the algorithm were clus-tered using the fuzzy c-means algorithm. Two new parti-cle types were found by this means: partiparti-cles containing
Fig. 4. Application of the classification algorithm on an ambient
dataset. Cont.: containing.
potassium (i.e. mass spectra dominated by m/z 39; these are present during the fireworks around 14 July), and parti-cles dominated by contaminations of silicone (m/z73, 147; Schneider et al., 2006). The algorithm was adapted to iden-tify these particle types as well. Furthermore, 535 mass spec-tra were identified which were dominated by electronic noise within the instrument. These mass spectra were removed from the dataset.
On the remaining 25 588 mass spectra, the modified al-gorithm was applied again. The resulting classification is shown in Fig. 4a. The 2945 unidentified particle mass spec-tra were manually sorted (Fig. 4b). About two thirds of these particle mass spectra contained too little signal to al-low any identification also by manual sorting. The manu-ally identified mass spectra mostly were classified as OOA and inorganics or HOA (which could be both, due to cook-ing or engine exhaust). Several more mass spectra with un-usual fragmentation pattern (high signal at m/z 45; HOA with high signal atm/z44) were found. Also several mass spectra with high signal at m/z 60 and 73 were found; these were classified as biomass (burning) organic aerosol (Alfarra et al., 2007; Schneider et al., 2006). Furthermore several more potassium-containing mass spectra and addi-tionally ammonium-chloride-containing mass spectra were found, which both occurred during the fireworks around 14 July.
Calculation of particle number concentrations: to
calcu-late hourly particle number concentrations of a particle type i(Cnumber,i), Eq. (3) was applied:
Cnumber,i=
#MSi
Q·t·DC·Seff·f#MS,i
. (3)
one-hour saving cycle: Seff=
#Psaved #Pdetected
. (4)
WhileQ,t and DC remain constant, both #MSi as well as Seffvary with time, as both depend on the actual number con-centration of particles present.
f#MS,iis defined as the ratio of total number of mass spec-tra of particle typeiused in the analysis (#MSi)to the num-ber of all particles of this type for which mass spectral data were saved (#Psaved,i):
f#MS,i= #MSi #Psaved,i
∼
= #MS
#Psaved
. (5)
Since #Psaved,i is not known, it is assumed here thatf#MS,iis comparable to the ratio of all mass spectra used in the analy-sis (#MS, the sum of all #MSi)to the total number of parti-cles for which mass spectral data were saved (#Psaved, Eq. 5). This yields an estimate forf#MS,i of 0.22 for this dataset. The underlying assumption is only valid if refractory parti-cles contribute only little to the whole number of partiparti-cles for which data were saved, and if different particle typesido not show significant differences in their degree of bouncing off the vaporizer. Especially the latter is only a rough approxima-tion (see e.g. Matthew et al., 2008). However, asf#MS,iis a constant factor, the uncertainty of its determination will only affect the absolute number concentration obtained, not the relative courses of diurnal cycles as discussed in Sect. 3.2.2. 3.2.2 Results from single-particle analysis
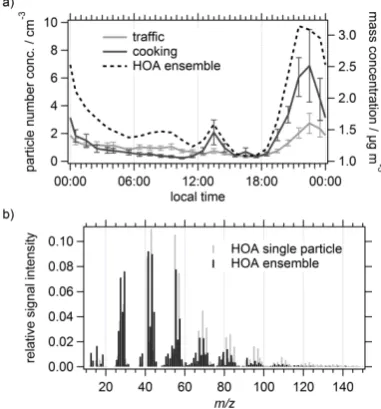
Cooking- and traffic-related HOA: average diurnal cycles of
the measured number concentrations of particles classified as cooking and traffic are shown in Fig. 5a. Also shown is the diurnal cycle of “HOA ensemble”, which was retrieved from ensemble organic mass spectra using positive matrix factorization (Freutel et al., 2013). This HOA ensemble is assumed to contain both traffic- and cooking-related HOA, as suggested by its mass spectral pattern and diurnal cycle. The derived mass spectrum of ensemble HOA compares well with the average mass spectrum of all cooking and traffic particles (Pearson’sR2of 0.80) (Fig. 5b). Comparison of the mass spectra furthermore reveals that in the average single-particle mass spectrum, more signal at higherm/zis found. This most likely is due to the fact that in single-particle anal-ysis, especially the larger HOA-type particles are measured. For the smaller particles, since the overall signal intensity is lower, AP240 thresholding (see Sect. 2.1) is more likely to affect the signal intensity at largerm/z, as their signal inten-sity more often will be below the given threshold and trun-cated. For larger particles, signal intensity at higherm/zis often still large enough to not be influenced by the thresh-olding. This influence of on-board thresholding should be in-vestigated in more detail in future work. Also the time series of ensemble and single-particle HOA agree reasonably well
Fig. 5. (a) Average diurnal cycles of number concentrations of
par-ticles classified as cooking and traffic (left axis), and of the mass concentration of the HOA factor (right axis) retrieved via positive matrix factorization of ensemble organic mass spectra (Freutel et al., 2013). Error bars represent the standard deviations of the aver-ages; error bars for HOA ensemble (relative uncertainty of 20 % from PMF analysis; Freutel et al., 2013) are omitted for clarity.
(b) Comparison of HOA ensemble mass spectrum with the
aver-age HOA single-particle mass spectrum (averaver-age mass spectrum of all single-particle mass spectra classified as cooking or traffic).
(R2of 0.65), despite differences in measurement techniques (e.g. mass vs. number concentration, different measurement size ranges).
These results for the first time give direct evidence of the presence of externally mixed particles consisting of differ-ent types of HOA in an urban surrounding from measure-ments with the AMS. Although from AMS ensemble mea-surements it is possible to distinguish between cooking- and traffic-related HOA by positive matrix factorization of en-semble mass spectra (e.g. Allan et al., 2010), those results are not completely unambiguous, and depend partially on sub-jective decisions by the operator. From single-particle anal-ysis with the algorithm presented here, much more definite results are obtained.
Mixed nitrate/sulphate/OOA: the average mass spectrum
of the organic content of all single-particle mass spectra clas-sified as OOA and inorganics shows no obvious differences to the OOA mass spectrum derived via positive matrix factor-ization from ensemble measurements (Pearson’sR2of 0.98). Despite differences in measurement techniques (see above), also the time series agree reasonably well (R2of 0.68).
Two very distinct air masses were sampled during the field campaign: during the first three days, air masses from the north-east were advected (“central Europe” air masses), while for the remaining time, air masses originated from the Atlantic Ocean (“Atlantic” air masses) (Freutel et al., 2013). For these two types of air masses, average diurnal cycles of number concentrations of particles classified as OOA and in-organics were calculated individually (Fig. 6a). Furthermore, for both types of air masses, the diurnal cycles of average mass per particle of OOA, nitrate and sulphate within the particles classified as OOA and inorganics are shown (Fig. 6b and c).
For both types of air masses, maximum number concentra-tions are observed during the later morning hours. Average number concentrations are much higher for central Europe air masses than for Atlantic air masses, consistent with en-hanced mass concentrations of OOA, nitrate and sulphate ob-served from ensemble mode AMS measurements during the sampling of central Europe air masses (Freutel et al., 2013).
The diurnal cycles of mass per particle of OOA, nitrate and sulphate within the particles classified as OOA and inor-ganics for both air masses show an increase of nitrate and a decrease of OOA and sulphate in the morning hours. During Atlantic air masses (Fig. 6c), the average nitrate content of the particles is comparably low during the whole day, with an increase during the morning hours (nitrate content varies from less than 5 % to about 20 % during the day). In con-trast, during the central Europe air masses, a large increase of nitrate content during the morning hours is observed, lead-ing to a diurnal variation of nitrate content from less than 5 % to about 60 %. At such nitrate mass fractions of more than 50 %, an increased AMS collection efficiency should be expected (Matthew et al., 2008), which however could not be confirmed from ensemble mode measurements (Freutel et al., 2013). From ensemble mode measurements, a maxi-mum nitrate content of about 35 % was observed during cen-tral Europe air masses (for all particles, not just OOA and
Fig. 6. Average diurnal cycle of the number concentration of
parti-cles classified as OOA and inorganics, separated for central Europe and Atlantic air masses (a). Standard deviations of the average val-ues are shown as light shaded areas. Average diurnal cycles of mass per particle of nitrate, sulphate, and OOA within the particles clas-sified as OOA and inorganics for central Europe (b) and Atlantic air masses (c). Error bars shown are calculated according to Eq. (2).
inorganics), so possibly the absolute fraction of these nitrate-dominated particles was not large enough to alter the overall AMS collection efficiency significantly.
The aforementioned relative compositions retrieved from the results of the classification algorithm were validated by comparison with the relative compositions derived using an independent method. For all particles classified as OOA and inorganics, the diurnal cycles of average mass spectra were calculated separately for Atlantic and central Europe air masses. The diurnal cycles of nitrate, sulphate and organic content were calculated from these average mass spectra by using only typical markerm/z for nitrate (m/z 30 and 46) and sulphate (m/z 48, 64, 80, 81, and 98) and by calculat-ing organics as sum of allm/zwithout nitrate, sulphate, and m/z14–18, 28, and 32. The fractions obtained by this means were found to agree within 10 % with the results given above, which further validates the procedure for retrieval of quanti-tative information using the described algorithm.
measurements gives direct evidence of nitrate partitioning to the particle phase, caused by the lower temperature dur-ing the night and less dilution of the emitted nitrate precur-sor gases due to reduced boundary layer height. Addition-ally, the number concentration of OOA and inorganic parti-cles measured in single-particle mode increases during night-time (Fig. 6a). This might have two reasons: first, it could be an indication for the additional influence of the lowering of the boundary layer height, if the number of particles for ni-trate to condense onto were to increase and only the nini-trate content were measured in single-particle mode. Second, as nitrate condenses onto pre-existing particles, small particles which up to then were below the detection limit of the light-scattering probe can grow to sizes where they are detected, increasing the number of detected particles. This effect could also explain the decreasing mass per particle of OOA and sulphate with increasing nitrate mass per particle (Fig. 6b and c). This smaller mass per particle of OOA and sulphate reflects the contributions of these species to the previously smaller particles which did not change by the condensation of nitrate. The diurnal cycle of OOA and sulphate mass per particle therefore can also be explained by the diurnal cycle of nitrate partitioning. However, the rate of increase of OOA exceeds that of sulphate mass per particle in the hours af-ter noon. This can be explained by additional condensation of OOA, formed from photooxidation of gaseous precursors, onto the pre-existing particles. The relative fraction of this additional, freshly generated OOA however is apparently too low to alter the observed single-particle mass spectral pat-terns significantly.
Fireworks around 14 July: from the application of the
re-vised algorithm and the manual clustering of the unidenti-fied particles, in total 79 particles containing potassium and 25 particles containing chloride were found, all during the time period of the fireworks around 14 July, the French Na-tional Day. Potassium and chloride were detected in separate particles, and not in mixtures with each other. Both particle types furthermore contain small amounts of sulphate, organ-ics and ammonium and/or water. The average mass spectrum of the potassium-containing particles furthermore shows a large signal atm/z30, which likely corresponds to nitrate. However, due to the small m/z 46 to 30 signal ratio we assume that this nitrate derives from potassium nitrate in-stead of ammonium nitrate. An enhanced ratio of m/z 30 tom/z46 (both likely from nitrate) was also observed in the average mass spectrum of the chloride-containing particles, where however no other potential cations than ammonium were measured.
Although the fireworks aerosol was found to be acidic from ensemble mode measurements (Freutel et al., 2013), no single particles dominated by sulphuric acid (instead of am-monium sulphate) were identified. This could be due to the fact that pure sulphuric acid particles were too small to be de-tected by the light-scattering probe. Furthermore, sulphuric acid might be easily missed when condensing onto
pre-existing, ammonium-sulphate-containing particles, as the ac-curacy of quantification of ammonium is limited due to large background values. Further laboratory work is needed here in order to investigate into the ability of the LSP-AMS to dif-ferentiate between sulphuric acid and ammonium sulphate in different mixing states (i.e. different degrees of neutraliza-tion).
4 Summary
A new classification algorithm was developed for the anal-ysis of single-particle mass spectra acquired with the AMS. It retrieves both information on particle types and quantita-tive information about the chemical composition of the indi-vidual particles by comparison to reference mass spectra of compounds and proxies of compound classes typically found in ambient aerosol. Both qualitative and quantitative retrieval were tested and validated in the laboratory using mass spec-tra from particles of known composition. The uncertainty of the relative chemical composition derived from one single-particle mass spectrum was estimated to be about 25 % for inorganic and about 30 % for organic substances. The uncer-tainty decreases slightly (to about 15 % and 25 %, respec-tively) when averaging over a larger number (≥25) of mass spectra. Incorporation of additional reference mass spectra like from ammonium chloride, sulphuric acid, ammonium bisulphate, or additional organic species and determination of detection limits for the various substances will extend the applicability of the algorithm further.
The algorithm was applied to a dataset of single-particle mass spectra acquired during ambient aerosol measurements in a suburb of Paris during July 2009. The algorithm identi-fied about 90 % of all particle mass spectra successfully; the remaining mass spectra for the most part contained too little signal to be identified even by manual inspection. New par-ticle types (potassium, silicone contaminations, ammonium chloride) were found in the unidentified mass spectra. This possibility to identify new particle types and incorporate their detection easily into the existing algorithm is an important feature in order to adapt to new, foreign particle types found in ambient aerosol samples.
nighttime, giving evidence of nitrate partitioning into the par-ticle phase. Such direct information is not available from AMS ensemble measurements. From the single-particle mea-surements, it was also found that number concentration of particles classified as OOA and inorganics increases dur-ing nighttime, which likely has two causes: the increase of gaseous precursors due to the decrease of boundary layer height, leading to a larger number of particles in which (only) nitrate is detected, and/or hitherto smaller particles growing into the detectable size range of the LSP-AMS. This lower cut-off of the measurable size range due to decreasing detec-tion efficiency is an important limitadetec-tion which has always to be kept in mind when interpreting single-particle data ac-quired with the LSP-AMS. Furthermore, in the afternoon, an increase of OOA mass per particle is observed, likely due to condensation of newly formed OOA after photooxidation of gaseous precursors.
Especially in combination with complementary informa-tion from ensemble AMS measurements, the analysis of the chemical composition of individual particles can give valu-able new and more substantiated information about various processes in the atmosphere than when relying on one of the methods alone. Therefore, a combined analysis of both AMS single-particle and ensemble measurements is a promising approach to gain more complete information from the data acquired with both methods from one single instrument.
Acknowledgements. The authors thank T. Böttger, S. J. Gallavardin,
P. Reitz, and J. Y. Schmale for support during the MEGAPOLI campaign. The staff of the Golf Départemental de la Poudrerie is gratefully acknowledged for technical and logistical support, especially C. Pouette and M. Leroux. E. S. Cross is thankfully ac-knowledged for helpful discussions regarding the field deployment of the LSP-AMS and the data analysis. We thank him, D. Sueper and T. Onasch for providing the software Sparrow, which was used and extended within this work. We thank J. Kimmel for support of the data acquisition software. This work was financed by internal MPI funds.
The service charges for this open access publication have been covered by the Max Planck Society. Edited by: M. Sipilä
References
Alfarra, M. R., Prevot, A. S. H., Szidat, S., Sandradewi, J., Weimer, S., Lanz, V. A., Schreiber, D., Mohr, M., and Baltensperger, U.: Identification of the Mass Spectral Signature of Organic Aerosols from Wood Burning Emissions, Environ. Sci. Technol., 41, 5770–05777, doi:10.1021/es062289b, 2007.
Allan, J. D., Delia, A. E., Coe, H., Bower, K. N., Alfarra, M. R., Jimenez, J. L., Middlebrook, A. M., Drewnick, F., Onasch, T. B., Canagaratna, M. R., Jayne, J. T., and Worsnop, D. R.: A generalised method for the extraction of chemically resolved mass spectra from Aerodyne aerosol mass spectrometer data, J.
Aerosol. Sci., 35, 909–922, doi:10.1016/j.jaerosci.2004.02.007, 2004.
Allan, J. D., Williams, P. I., Morgan, W. T., Martin, C. L., Flynn, M. J., Lee, J., Nemitz, E., Phillips, G. J., Gallagher, M. W., and Coe, H.: Contributions from transport, solid fuel burning and cook-ing to primary organic aerosols in two UK cities, Atmos. Chem. Phys., 10, 647–668, doi:10.5194/acp-10-647-2010, 2010. Bezdek, J. C., Ehrlich, R., and Full, W.: FCM: The fuzzyc-means
clustering algorithm, Comput. Geosci., 10, 191–203, 1984. Bishop, C. M.: Pattern Recognition and Machine Learning,
Infor-mation Science and Statistics, edited by: Jordan, M., Kleinberg, J., and Schölkopf, B., Springer Science+Business Media, LLC, New York, 2006.
Canagaratna, M. R., Jayne, J. T., Ghertner, D. A., Herndon, S., Shi, Q., Jimenez, J. L., Silva, P. J., Williams, P., Lanni, T., Drewnick, F., Demerjian, K. L., Kolb, C. E., and Worsnop, D. R.: Chase Studies of Particulate Emissions from in-use New York City Vehicles, Aerosol Sci. Tech., 38, 555–573, doi:10.1080/02786820490465504, 2004.
Canagaratna, M. R., Jayne, J. T., Jimenez, J. L., Allan, J. D., Al-farra, M. R., Zhang, Q., Onasch, T. B., Drewnick, F., Coe, H., Middlebrook, A., Delia, A., Williams, L. R., Trimborn, A. M., Northway, M. J., DeCarlo, P. F., Kolb, C. E., Davidovits, P., and Worsnop, D. R.: Chemical and microphysical characterization of ambient aerosols with the Aerodyne aerosol mass spectrometer, Mass Spectrom. Rev., 26, 185–222, 2007.
Crippa, M., DeCarlo, P. F., Slowik, J. G., Mohr, C., Heringa, M. F., Chirico, R., Poulain, L., Freutel, F., Sciare, J., Cozic, J., Di Marco, C. F., Elsasser, M., Nicolas, J. B., Marchand, N., Abidi, E., Wiedensohler, A., Drewnick, F., Schneider, J., Borrmann, S., Nemitz, E., Zimmermann, R., Jaffrezo, J.-L., Prévôt, A. S. H., and Baltensperger, U.: Wintertime aerosol chemical compo-sition and source apportionment of the organic fraction in the metropolitan area of Paris, Atmos. Chem. Phys., 13, 961–981, doi:10.5194/acp-13-961-2013, 2013.
Cross, E. S., Slowik, J. G., Davidovits, P., Allan, J. D., Worsnop, D. R., Jayne, J. T., Lewis, D. K., Canagaratna, M., and Onasch, T. B.: Laboratory and Ambient Particle Density Determinations using Light Scattering in Conjunction with Aerosol Mass Spectrometry, Aerosol Sci. Tech., 41, 343–359, doi:10.1080/02786820701199736, 2007.
Cross, E. S., Onasch, T. B., Canagaratna, M., Jayne, J. T., Kimmel, J., Yu, X.-Y., Alexander, M. L., Worsnop, D. R., and Davidovits, P.: Single particle characterization using a light scattering mod-ule coupled to a time-of-flight aerosol mass spectrometer, At-mos. Chem. Phys., 9, 7769–7793, doi:10.5194/acp-9-7769-2009, 2009.
Drewnick, F., Hings, S. S., DeCarlo, P., Jayne, J. T., Gonin, M., Fuhrer, K., Weimer, S., Jimenez, J. L., Demerjian, K. L., Borrmann, S., and Worsnop, D. R.: A New Time-of-Flight Aerosol Mass Spectrometer (TOF-AMS) – Instrument Descrip-tion and First Field Deployment, Aerosol Sci. Tech., 39, 637– 658, doi:10.1080/02786820500182040, 2005.
Freutel, F., Schneider, J., Drewnick, F., von der Weiden-Reinmüller, S.-L., Crippa, M., Prévôt, A. S. H., Baltensperger, U., Poulain, L., Wiedensohler, A., Sciare, J., Sarda-Estève, R., Burkhart, J. F., Eckhardt, S., Stohl, A., Gros, V., Colomb, A., Michoud, V., Doussin, J. F., Borbon, A., Haeffelin, M., Morille, Y., Beekmann, M., and Borrmann, S.: Aerosol particle measurements at three stationary sites in the megacity of Paris during summer 2009: meteorology and air mass origin dominate aerosol particle com-position and size distribution, Atmos. Chem. Phys., 13, 933–959, doi:10.5194/acp-13-933-2013, 2013.
Hinds, W. C.: Aerosol technology: properties, behavior, and mea-surement of airborne particles, 2nd ed., John Wiley & Sons, Inc., New York, 1999.
Hinz, K.-P. and Spengler, B.: Instrumentation, data evaluation and quantification in on-line aerosol mass spectrometry, J. Mass Spectrom., 42, 843–860, doi:10.1002/jms.1262, 2007.
Jayne, J. T., Leard, D. C., Zhang, X., Davidovits, P., Smith, K. A., Kolb, C. E., and Worsnop, D. R.: Development of an Aerosol Mass Spectrometer for Size and Composition Analysis of Sub-micron Particles, Aerosol Sci. Tech., 33, 49–70, 2000.
Jimenez, J. L., Jayne, J. T., Shi, Q., Kolb, C. E., Worsnop, D. R., Yourshaw, I., Seinfeld, J. H., Flagan, R. C., Zhang, X. F., Smith, K. A., Morris, J. W., and Davidovits, P.: Ambient aerosol sam-pling using the Aerodyne Aerosol Mass Spectrometer, J. Geo-phys. Res.-Atmos., 108, 8425, doi:10.1029/2001jd001213, 2003. Johnston, M. V. and Wexler, A. S.: MS of Individual Aerosol
Parti-cles, Anal. Chem., 67, A721–A726, 1995.
Kimmel, J. R., DeCarlo, P. F., Worsnop, D. R., and Jimenez, J. L.: Quantitative Time-of-flight Mass Spectrometry of Aerosols Using a Digitally Thresholded Analog-to-Digital Converter, Annual Conference of the American Society for Mass Spectrometry, Seattle, 2006, available online at http://cires.colorado.edu/jimenez-group/ToFAMSResources/ ToFManual/Docs/Kimmel_ASMS_2006.pdf (last access: 19 August 2013), 2006.
Liu, P. S. K., Deng, R., Smith, K. A., Williams, L. R., Jayne, J. T., Canagaratna, M. R., Moore, K., Onasch, T. B., Worsnop, D. R., and Deshler, T.: Transmission Efficiency of an Aero-dynamic Focusing Lens System: Comparison of Model Cal-culations and Laboratory Measurements for the Aerodyne Aerosol Mass Spectrometer, Aerosol Sci. Tech., 41, 721–733, doi:10.1080/02786820701422278, 2007.
Liu, S., Russell, L. M., Sueper, D. T., and Onasch, T. B.: Organic particle types by single-particle measurements using a time-of-flight aerosol mass spectrometer coupled with a light scattering module, Atmos. Meas. Tech., 6, 187–197, doi:10.5194/amt-6-187-2013, 2013.
Matthew, B. M., Middlebrook, A. M., and Onasch, T. B.: Collection Efficiencies in an Aerodyne Aerosol Mass Spec-trometer as a Function of Particle Phase for Labora-tory Generated Aerosols, Aerosol Sci. Tech., 42, 884–898, doi:10.1080/02786820802356797, 2008.
Ng, N. L., Canagaratna, M. R., Zhang, Q., Jimenez, J. L., Tian, J., Ulbrich, I. M., Kroll, J. H., Docherty, K. S., Chhabra, P. S., Bahreini, R., Murphy, S. M., Seinfeld, J. H., Hildebrandt, L., Donahue, N. M., DeCarlo, P. F., Lanz, V. A., Prévôt, A. S. H., Dinar, E., Rudich, Y., and Worsnop, D. R.: Organic aerosol components observed in Northern Hemispheric datasets from
Aerosol Mass Spectrometry, Atmos. Chem. Phys., 10, 4625– 4641, doi:10.5194/acp-10-4625-2010, 2010.
Noble, C. A. and Prather, K. A.: Real-time single particle mass spectrometry: A historical review of a quarter century of the chemical analysis of aerosols, Mass Spectrom. Rev., 19, 248– 274, 2000.
Pöschl, U.: Atmospheric Aerosols: Composition, Transformation, Climate and Health Effects, Angew. Chem. Int. Edit., 44, 7520– 7540, doi:10.1002/anie.200501122, 2005.
Schneider, J., Weimer, S., Drewnick, F., Borrmann, S., Helas, G., Gwaze, P., Schmid, O., Andreae, M. O., and Kirchner, U.: Mass spectrometric analysis and aerodynamic properties of various types of combustion-related aerosol particles, Int. J. Mass Spec-trom., 258, 37–49, doi:10.1016/j.ijms.2006.07.008, 2006. Schneider, J., Freutel, F., Zorn, S. R., Chen, Q., Farmer, D. K.,
Jimenez, J. L., Martin, S. T., Artaxo, P., Wiedensohler, A., and Borrmann, S.: Mass-spectrometric identification of primary bi-ological particle markers and application to pristine submicron aerosol measurements in Amazonia, Atmos. Chem. Phys., 11, 11415–11429, doi:10.5194/acp-11-11415-2011, 2011.
Simoneit, B. R. T.: Biomass burning – a review of organic tracers for smoke from incomplete combustion, Appl. Geochem., 17, 129– 162, doi:10.1016/S0883-2927(01)00061-0, 2002.
Sparrow Software: http://cires.colorado.edu/jimenez-group/ ToFAMSResources/ToFSoftware/index.html (last access: 21 March 2013), 2013.
Zhang, Q., Alfarra, M. R., Worsnop, D. R., Allan, J. D., Coe, H., Canagaratna, M. R., and Jimenez, J. L.: Deconvolution and Quantification of Hydrocarbon-like and Oxygenated Organic Aerosols Based on Aerosol Mass Spectrometry, Environ. Sci. Technol., 39, 4938–4952, doi:10.1021/es048568l, 2005. Zhang, Q., Jimenez, J. L., Canagaratna, M. R., Allan, J. D., Coe,
H., Ulbrich, I., Alfarra, M. R., Takami, A., Middlebrook, A. M., Sun, Y. L., Dzepina, K., Dunlea, E., Docherty, K., De-Carlo, P. F., Salcedo, D., Onasch, T., Jayne, J. T., Miyoshi, T., Shimono, A., Hatakeyama, S., Takegawa, N., Kondo, Y., Schneider, J., Drewnick, F., Borrmann, S., Weimer, S., Demer-jian, K., Williams, P., Bower, K., Bahreini, R., Cottrell, L., Griffin, R. J., Rautiainen, J., Sun, J. Y., Zhang, Y. M., and Worsnop, D. R.: Ubiquity and dominance of oxygenated species in organic aerosols in anthropogenically-influenced Northern Hemisphere midlatitudes, Geophys. Res. Lett., 34, L13801, doi:10.1029/2007gl029979, 2007.