When Hyperparameters Help:
Beneficial Parameter Combinations in Distributional Semantic Models
Alicia Krebs
[email protected] Center for Mind and Brain Sciences (CIMeC),
Denis Paperno
[email protected] University of Trento, Rovereto, Italy
Abstract
Distributional semantic models can pre-dict many linguistic phenomena, including word similarity, lexical ambiguity, and se-mantic priming, or even to pass TOEFL synonymy and analogy tests (Landauer and Dumais, 1997; Griffiths et al., 2007; Turney and Pantel, 2010). But what does it take to create a competitive distributional model? Levy et al. (2015) argue that the key to success lies in hyperparameter tun-ing rather than in the model’s architec-ture. More hyperparameters trivially lead to potential performance gains, but what do they actually do to improve the mod-els? Are individual hyperparameters’ con-tributions independent of each other? Or are only specific parameter combinations beneficial? To answer these questions, we perform a quantitative and qualitative eval-uation of major hyperparameters as identi-fied in previous research.
1 Introduction
In a rigorous evaluation, (Baroni et al., 2014) showed that neural word embeddings such as skip-gram have an edge over traditional count-based models. However, as argued by Levy and Gold-berg (2014), the difference is not as big as it ap-pears, since skip-gram is implicitly factorizing a word-context matrix whose cells are the pointwise mutual information (PMI) of word context pairs shifted by a global constant. Levy et al. (2015) further suggest that the performance advantage of neural network based models is largely due to hy-perparameter optimization, and that the optimiza-tion of count based models can result in similar performance gains. In this paper we take this claim as the starting point. We experiment with
three hyperparameters that have the greatest ef-fect on model performance according to Levy et al. (2015): subsampling, shifted PMI and context distribution smoothing. To get a more detailed pic-ture, we use a greater range of hyperparameter val-ues than in previous work, comparing all hyperpa-rameter value combinations, and perform a quali-tative analysis of their effect.
2 Hyperparameters Explored
2.1 Context Distribution Smoothing (CDS)
Mikolov et al. (2013b) smoothed the original con-texts distribution raising unigram frequencies to the power of alpha. Levy and Goldberg (2015) used this technique in conjunction with PMI.
P M I(w, c) = log ˆ
P(w, c) ˆ
P(w)·Pˆα(c)
ˆ
Pα(c) =
#(c)α
P
c#(c)α
After CDS, either PPMI or Shifted PPMI may be applied. We implemented CDS by raising every count to the power ofα, exploring several values forα, from .25 to .95 to 1 (no smoothing).
2.2 Shifted PPMI
Levy and Goldberg introduced Shifted Positive Pointwise Mutual Information (SPPMI) as an as-sociation measure more efficient than PPMI. For every wordw and every contextc, the SPPMI of wis the higher value between 0 and its PMI value minus the log of a constantk.
P P M I(w, c) = max(log P(w, c)
P(w)P(c),0)
2.3 Subsampling
Subsampling was used by Mikolov et al. as a means to remove frequent words that provide less information than rare words (Mikolov et al., 2013a). Each word in the corpus with frequency above tresholdtcan be ignored with probabilityp, computed for each word using its frequencyf:
p= 1−
s
t f
Following Mikolov et al., we used t = 10−5. In word2vec, subsampling is applied before the cor-pus is processed. Levy and Goldberg explored the possibility of applying subsampling afterwards, which does not affect the context window’s size, but found no significant difference between the two methods. In our experiments, we applied sub-sampling before processing.
3 Evaluation Setup
3.1 Corpus
For maximum consistency with previous research, we used the cooccurrence counts of the best count-based configuration in Baroni et al. (2014), ex-tracted from the concatenation of the web-crawled ukWack corpus (Baroni et al., 2009), Wikipedia, and the BNC, for a total of 2.8 billion tokens, using a 2-word window and the 300K most frequent to-kens as contexts. This corpus will be referred to as WUB. For comparison with a smaller corpus, sim-ilar to the one in Levy and Goldberg’s setup, we also extracted cooccurrence data from Wikipedia alone, leaving the rest of the configuration identi-cal. This corpus will be referred to asWiki.
3.2 Evaluation Materials
Three data sets were used to evaluate the mod-els. The MEN data set contains 3000 word pairs rated by human similarity judgements. Bruni et al. (2014) report an accuracy of 78% on this data-set using an approach that combines visual and tex-tual features. The WordSim data set is a collec-tion of word pairs associated with human judge-ments of similarity or relatedness. The similarity set contains 203 items (WS sim) and the related-ness set contains 252 items (WS rel). Agirre et al. achieved an accuracy of 77% on this data set using a context window approach (Agirre et al., 2009). The TOEFL data set includes 80 multiple-choice synonym questions (Landauer and Dumais,
1997). For this data set, corpus-based approaches have reached an accuracy of 92.50% (Rapp, 2003).
4 Results
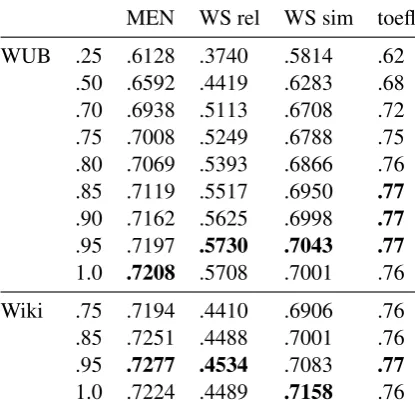
4.1 Context Distribution Smoothing
Our results show that smoothing is largely inef-fective when used in conjunction with PPMI. It also becomes apparent that .95 is a better parame-ter than .75 for smoothing purposes.
MEN WS rel WS sim toefl
WUB .25 .6128 .3740 .5814 .62 .50 .6592 .4419 .6283 .68 .70 .6938 .5113 .6708 .72 .75 .7008 .5249 .6788 .75 .80 .7069 .5393 .6866 .76 .85 .7119 .5517 .6950 .77 .90 .7162 .5625 .6998 .77 .95 .7197 .5730 .7043 .77 1.0 .7208 .5708 .7001 .76
[image:2.595.312.520.210.415.2]Wiki .75 .7194 .4410 .6906 .76 .85 .7251 .4488 .7001 .76 .95 .7277 .4534 .7083 .77 1.0 .7224 .4489 .7158 .76
Table 1:Context Distribution Smoothing
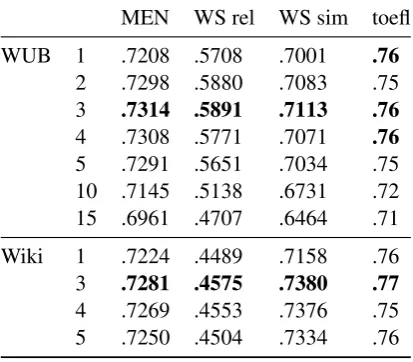
4.2 Shifted PPMI
When using SPPMI, Levy and Goldberg (2014) tested three values fork: 1, 5 and 15. On the MEN data set, they report that the best k value was 5 (.721), while on the WordSim data set the bestk value was 15 (.687). In our experiments, where (in contrast to Levy and Goldberg) all other hyperpa-rameters are set to ‘vanilla’ values, the bestkvalue was 3 for all data sets.
4.3 Smoothing and Shifting Combined
The results in Table 3 show that Context Distri-bution Smoothing is effective when used in con-junction with Shifted PPMI. With CDS, 5 turns out to be a better value than 3 fork. These results are also consistent with the previous experiment: a smoothing of .95 is in most cases better than .75.
4.4 Subsampling
MEN WS rel WS sim toefl
WUB 1 .7208 .5708 .7001 .76 2 .7298 .5880 .7083 .75 3 .7314 .5891 .7113 .76 4 .7308 .5771 .7071 .76 5 .7291 .5651 .7034 .75 10 .7145 .5138 .6731 .72 15 .6961 .4707 .6464 .71
[image:3.595.78.285.64.245.2]Wiki 1 .7224 .4489 .7158 .76 3 .7281 .4575 .7380 .77 4 .7269 .4553 .7376 .75 5 .7250 .4504 .7334 .76
Table 2:Shifted PPMI
the absence of shifting and smoothing, subsam-pling does not produce a consistent performance change, which ranges from−6.7%to+7%.
The nature of the task is also important here: on WS rel, subsampling improves the model’s per-formance by 9.2%. We assume that diversifying contextual cues is more beneficial in a relatedness task than in others, especially on a smaller corpus.
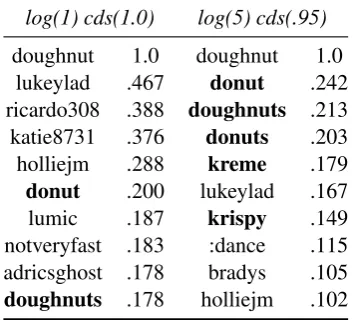
5 Qualitative Analysis
CDS and SPPMI increase model performance be-cause they reduce statistical noise, which is illus-trated in Table 5. It shows the top ten neighbours of the worddoughnutin the vanilla PPMI config-uration vs. SPPMI with CDS, in which there are more semantically related neighbours (in bold).
To visualize which dimensions of the vectors are discarded when shifting and smoothing, we randomly selected a thousand word vectors and compared the number of dimensions with a pos-itive value for each vector in the vanilla configu-ration vs. log(5)cds(.95). For instance, the word segmentationhas 1105 positive dimensions in the vanilla configuration, but only 577 in the latter.
For visual clarity, only vectors with 500 or less contexts are shown in Figure 1.
This figure indicates that the process of shifting and smoothing appears to be largely independent from the number of contexts of a vector: a word with a high number of positive contexts in the vanilla configuration may very well end up with zero positive contexts under SPPMI with CDS.
The independence of the number of positive contexts under the vanilla configuration from the probability of having at least one positive context
MEN WS rel WS sim toefl
WUB
log(1) cds(1.0) .7208 .5708 .7001 .76 log(3) cds(.75) .7319 .5969 .7146 .73 log(3) cds(.90) .7371 .6170 .7285 .76 log(3) cds(.95) .7379 .6201 .7315 .76 log(4) cds(.75) .7363 .6071 .7212 .75 log(4) cds(.90) .7398 .6222 .7351 .76 log(4) cds(.95) .7403 .6265 .7392 .77 log(5) cds(.75) .7387 .6115 .7281 .76 log(5) cds(.90) .7412 .6223 .7404 .77 log(5) cds(.95) .7414 .6257 .7434 .77
Wiki
log(1) cds(1.0) .7224 .4489 .7158 .76 log(5) cds(.75) .7424 .4787 .7378 .75 log(5) cds(.85) .7399 .4795 .7418 .75 log(5) cds(.95) .7362 .4806 .7443 .75
Table 3:CDS and Shifted PPMI
MEN WS rel WS sim toefl
WUB
log(1) cds(1.0) .7284 .5043 .6750 .75 log(5) cds(.95) .7577 .5539 .7505 .73
Wiki
log(1) cds(1.0) .7260 .5186 .6965 .72 log(5) cds(.95) .7661 .5729 .7446 .76
Table 4:CDS and SPPMI with subsampling
under SPPMI with CDS is confirmed by the Chi-Square test (χ= 344.26, p = .9058).
We further analysed a sample of 1504 vectors that lose all positive dimensions under SPPMI with CDS. We annotated a portion of those vec-tors, and found that the vast majority were numer-ical expressions, such as dates, prices or measure-ments, e.g.1745, which may appear in many dif-ferent contexts, but is unlikely to have a high num-ber of occurrences with any of them. This explains why its number of positive contexts drops to zero when SPPMI and CDS are applied.
6 Count vs Predict and Corpus Size
log(1) cds(1.0) log(5) cds(.95)
[image:4.595.93.270.64.224.2]doughnut 1.0 doughnut 1.0 lukeylad .467 donut .242 ricardo308 .388 doughnuts .213 katie8731 .376 donuts .203 holliejm .288 kreme .179 donut .200 lukeylad .167 lumic .187 krispy .149 notveryfast .183 :dance .115 adricsghost .178 bradys .105 doughnuts .178 holliejm .102
Table 5: Top 10 neighbours ofdoughnut. Semantically
re-lated neighbors are given in bold.
0 100 200 300 400 500
word vector
positiv
e dimensions
model
log(1) cds(1.0) log(5) cds(.95)
Figure 1: Along the X axis, vectors are ordered by the
as-cending number of positive dimensions in the vanilla model. The Y axis represents the number of positive dimensions in two models.
to the one that Levy et al. employed. With these two corpora, we found the same general pattern of results, with the exception of the WordSim relatedness task benefitting greatly from a larger corpus and MEN favoring steeper smoothing (.75) under the smaller corpus. This suggests that the smoothing hyperparameter should be adjusted to the corpus size and the task at hand.
For comparison, we give the results for a word2vec model trained on the two corpora us-ing the best configuration reported by Baroni et al. (2014): CBOW, 10 negative samples, CDS, win-dow 5, and 400 dimensions. We find that PPMI is more efficient when using the Wikipedia corpus alone, but when using the larger corpus the predict model still outperforms all count models.
7 Conclusion
Our investigation showed that the interaction of different hyperparameters matters more than the implementation of any single one. Smoothing only shows its potential when used in
combina->0 >300 >750 >1000 >1500
8:23 1900s e4 1024 51
01-06-2005 7.45pm 8.4 1928. 1981.
ec3n 41. 331 1924. 17
5935 1646 1745 45,000 2500
[image:4.595.306.538.64.156.2]$1.00 $25 1/3 630 1960s
Table 6:Sample of words with zero positive dimensions after
SPPMI with CDS
predict MEN WS rel WS sim toefl
WUB .80 .70 .80 .91
Wiki .7370 .4951 .7714 .83
best count MEN WS rel WS sim toefl
WUB .7577 .6265 .7505 .77
Wiki .7661 .5729 .7446 .77
Table 7:Performance of count vs. predict models as a
func-tion of corpus size
tion with shifting. Similarly, subsampling only becomes interesting when shifting and smoothing are applied. When it comes to parameter values, we recommend using .95 as a smoothing hyperpa-rameter and log(5) as a shifting hyperpahyperpa-rameter.
Qualitatively speaking, the hyperparameters help largely by reducing statistical noise in cooc-currence data. SPPMI works by removing low PMI values, which are likely to be noisy. CDS effectively lowers PMI values for rare contexts, which tend to be more noisy, allowing for a higher threshold for SPPMI (log 5vs.log 3) to be effec-tive. Subsampling gives a greater weight to under-exploited data from rare words at the expense of frequent ones, but it amplifies the noise as well as the signal, and should be combined with the other noise-reducing hyperparameters to be useful.
In terms of corpus size, we’ve seen that similar performance can be achieved with a smaller cor-pus if the right hyperparameters are used. One ex-ception is the WordSim relatedness task, in which models require more data to achieve the same level of performance, and benefit from subsam-pling much more than in the similarity task.
[image:4.595.316.519.201.306.2] [image:4.595.77.291.273.390.2]Acknowledgements
We thank Marco Baroni, the COMPOSES group at the University of Trento, and three anonymous reviewers for their valuable input. This research was supported by the ERC 2011 Starting Indepen-dent Research Grant 283554 (COMPOSES) and by the European Masters Program in Language and Communication Technologies.
References
Eneko Agirre, Enrique Alfonseca, Keith Hall, Jana Kravalova, Marius Pas¸ca, and Aitor Soroa. 2009. A study on similarity and relatedness using distribu-tional and wordnet-based approaches. In Proceed-ings of Human Language Technologies: The 2009 Annual Conference of the North American Chap-ter of the Association for Computational Linguistics, pages 19–27. Association for Computational Lin-guistics.
Marco Baroni, Silvia Bernardini, Adriano Ferraresi, and Eros Zanchetta. 2009. The wacky wide web: A collection of very large linguistically processed web-crawled corpora. Language Resources and Evaluation, 43(3):209–226.
Marco Baroni, Georgiana Dinu, and Germ´an Kruszewski. 2014. Dont count, predict! a systematic comparison of context-counting vs. context-predicting semantic vectors. InProceedings of the 52nd Annual Meeting of the Association for Computational Linguistics, volume 1, pages 238–247.
Elia Bruni, Nam-Khanh Tran, and Marco Baroni. 2014. Multimodal distributional semantics. J. Ar-tif. Intell. Res.(JAIR), 49(1–47).
Thomas L. Griffiths, Mark Steyvers, and Joshua B. Tenenbaum. 2007. Topics in semantic representa-tion. Psychological Review, 114(2):211–244.
Thomas K. Landauer and Susan T. Dumais. 1997. A solution to plato’s problem: The latent semantic analysis theory of acquisition, induction, and rep-resentation of knowledge. Psychological Review, 104(2):211–240.
Omer Levy and Yoav Goldberg. 2014. Neural word embedding as implicit matrix factorization. In Ad-vances in Neural Information Processing Systems, pages 2177–2185.
Omer Levy, Yoav Goldberg, and Ido Dagan. 2015. Im-proving distributional similarity with lessons learned from word embeddings. Transactions of the Associ-ation for ComputAssoci-ational Linguistics, 3:211–225.
Tomas Mikolov, Kai Chen, Greg Corrado, and Jef-frey Dean. 2013a. Efficient estimation of word representations in vector space. arXiv preprint arXiv:1301.3781.
Tomas Mikolov, Ilya Sutskever, Kai Chen, Greg S Cor-rado, and Jeff Dean. 2013b. Distributed representa-tions of words and phrases and their compositional-ity. InAdvances in Neural Information Processing Systems, pages 3111–3119.
Reinhard Rapp. 2003. Word sense discovery based on sense descriptor dissimilarity. InProceedings of the Ninth Machine Translation Summit, pages 315–322.