FOOT TYPE CLASSIFICATION FOR CHINESE
CHILDREN AND ADOLESCENTS
Miaomiao Xu
1, 2, Jing Xian Li
3, Youlian Hong
4, and Lin Wang
1, 21
Key Laboratory of Exercise and Health Science of the Ministry of Education, Shanghai
University of Sports, Shanghai, China
2
School of Kinesiology, Shanghai University of Sports, Shanghai, China
3School of Human Kinetics, University of Ottawa, Ottawa, Ontario, Canada
4Department of Sports Medicine, Chengdu Sports University, Chengdu, Sichuan, China
Original scientific paper https://doi.org/10.26582/k.51.1.8
Abstract:
The objective of this study was to examine the three-dimensional foot shape data and determine foot type’s distribution among Chinese children and adolescents. A total of sixteen three-dimensional foot shape variables of 5,069 Chinese children were measured through filming, including 3 girth-related variables, 3 length-related variables, 2 width-length-related variables, and 8 height-length-related variables. Cluster analysis was performed to classify these three-dimensional feet data of Chinese children and adolescents into three identified foot types, namely Robust Feet, Slender Feet, and Flat Feet, which differed in terms of length, volume, and arch height. The distribution of the three foot types varied across the different foot length groups. The foot types classification may be used in the design of shoe lasts and in the comfortable footwear manufacturing to minimize error fitting.
Key words: foot shape, cluster analysis, shoes making
Introduction
Human foot has an irregular three-dimen-sional (3D) shape. Information about important foot characteristics helps not only to improve shoe comfort (Price & Nester, 2016), but also to main-tain the proper physiological development of the feet (Barisch-Fritz, Schmeltzpfenning, Plank, & Grau, 2014). Currently, shoes for children are designed by linearly scaling molds taken from adult feet. However, the proportions of children’s feet do not correspond to those of adults (Mauch, Grau, Krauss, Maiwald, & Horstmann, 2009), consequently, chil-dren footwear may not be optimally adapted. In view of the differences in the foot morphologies of children, the foot dimensions of children should be collected, and their foot shape characteristics should be analyzed (Lee & Wang, 2015).
Previous studies used 3D scanning in their methodology and analyzed the reduced morpho-logical measurements of the feet by using cluster analysis (Mauch, et al., 2009; Mauch, Grau, Krauss, Maiwald, & Horstmann, 2008). For example, in the study conducted by Mauch et al. (2009), 3D foot morphology was analyzed with a sample of 2,869
analysis was used to present three different foot types between boys and girls. However, the said study involved a German sample, and its results cannot be extrapolated to a Chinese sample.
Currently, 3D data on the feet of Chinese chil-dren and adolescents are still lacking, and statis-tical multivariate methods have not yet been used to cluster similar feet into groups. Therefore, the purpose of this study was to examine the differ-ences among the feet of Chinese children and adolescents aged 7-18 years by clustering them into groups. The following hypotheses were considered in this study: (1) feet can be classified as Robust Feet, Slender Feet and Flat Feet; (2) the foot types distribution varies across the different foot length groups of Chinese children and adolescents.
Methods
Participants
Kinesiology 51(2019)1:127-132 Xu, M. et al.: FOOT TYPE CLASSIFICATION FOR CHINESE CHILDREN...
participants were chosen respective to each gender and age. A total of 2,492 boys and 2,577 girls of school age (7-18 years) from Chinese primary, secondary, and senior high schools volunteered for this study. Their parents/guardians, who were previously informed of the study, signed a letter of consent to confirm their children’s participa-tion. Recent injuries in the lower extremities, foot bone disorders, or skin infections were excluding criteria. The study was approved by the local Ethics Committee.
Procedures
Before the foot shapes of the participants were measured, their heights were measured under bare-foot condition using a stadiometer (Harpenden stadiometer, model 98.603, HoltainLtd, Cross-well, UK). Body mass was determined by a digital weighing scale (Seca electronic scale, model 770, Hamburg, Germany). The participants wore light clothing when the measurements were taken.
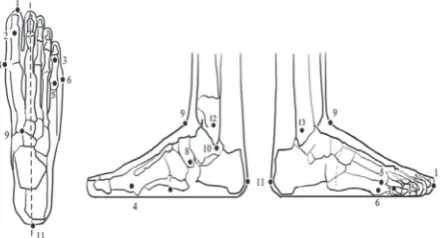
Multiple image-based approaches were used. The participants’ feet were first recorded using four video cameras (SONY HVR-Z1C, Japan). The 3D foot shape data of the right foot were collected using a video filming system. The foot model developed by the Biomechanics Institute of Valencia, Spain (García-Hernández, et al., 2005; Hong, Wang, Xu, & Li, 2011) was used in the current study. The model has thirteen anatomical reference points, which were marked with a black marker pen prior to filming. These reference points were defined manually by the same investigator (Figure 1). The participants had to stand still while being filmed, in a bipedal support, with their body weight evenly distributed on both feet. Four digital cameras were used to film the right foot synchronously for at least 5 s. The sample frequency was set to 50 Hz.
Three girth variables, namely, ball girth (BG), midfoot girth (MFG), and malleolar girth (MG), were measured to the nearest 1 mm using a flexible tape (Figure 2). The girths were measured by the same investigator who defined the reference points. After filming, the coordinates of the thirteen reference points were obtained by the automatic digitization of the video image by Ariel Motion Analysis System (Ariel Dynamics, USA). The digi-tized data were then smoothed using a Butterworth filter at 6 Hz.
Variables
The measurements shown in Figure 2 were obtained from the coordinates of the thirteen refer-ence points. The number of variables analyzed in this study exceeded the number of variables used in several previous studies (Mauch, et al., 2008, 2009).
The three variables related to length were foot length (FL), medial ball length (MBL), and forefoot length (ForeL). The two variables related to width were foot width (FW) and heel width (HW). The eight variables related to height included the first phalangeal head height (P1H), the fifth phalangeal head height (P5H), the fifth metatarsal head height (M5H), arch height (ArH), the lowest scaphoid point height (LSH), instep height (IH), medial malleolus height (MMH), and calcaneus height (CH). Thus, together with the three girth variables measured before the filming, a total of 16-foot shape variables were measured. This method was used to measure the three-dimensional foot variables in previous studies (Li, Xu, Wang, & Shao, 2005; Hong, et al., 2011). A high reliability of the measurements was found, with the interclass correlation coefficients ranging from 0.930 to 0.999 (Hong, et al., 2011).
Statistical analysis
Statistical analysis was performed using the SPSS 20.0 software package, with a significance level set at p<.05. A principal component anal-ysis (PCA) was then conducted to extract the main feature parameters for describing the foot shape differences. This method was used to develop foot type classification schemes in previous studies (Lee & Wang, 2015; Mauch, et al., 2008). Ward’s hierar-chical method was used to determine the number of clusters. The results were optimized by K-means clustering, with the cluster centers from the previous analysis as the initial seed points.
Results
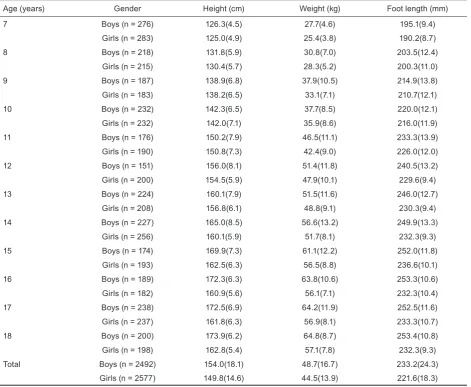
Participants’ physical characteristics Physical characteristics of the participants are summarized in Table 1.
Note. 1 – front end of the longest toe; 2 – first phalangeal head; 3 – fifth phalangeal head; 4 – first metatarsal head; 5 – highest point of the fifth metatarsal head; 6 – fifth metatarsal head; 7 – lowest point of the foot arch; 8 – lowest scaphoid point; 9 – point where the leg meets the foot; 10 – the tip of the medial malleolus; 11 – pternion; 12 – medial malleolus; 13 – Lateral malleolus
Note. 3 – length-related variables: a – foot length (FL ); b – medial ball length (MBL); c – forefoot length (ForeL). 2 – width-related variables: d – foot width (FW); e – heel width (HW). 8 – height-related variables: f – height of the first toe (T1H ); g – height of the fifth toe (T5H); h – height of the metatarsal head (M5H); i – arch height(ArH); j – lowest scaphoid point height (LSH); k – instep height (IH); l – medial malleolus height (MMH); m – calcaneus height (CH). 3 – girth-related variables: x – ball girth (BG); y – midfoot girth (MFG); z – malleoli girth (MG).
Figure 2. Foot measurements.
Table 1. Physical characteristics of the participants are summarized in the study. Values are means(SD)
Age (years) Gender Height (cm) Weight (kg) Foot length (mm)
7 Boys (n = 276) 126.3(4.5) 27.7(4.6) 195.1(9.4)
Girls (n = 283) 125.0(4.9) 25.4(3.8) 190.2(8.7)
8 Boys (n = 218) 131.8(5.9) 30.8(7.0) 203.5(12.4)
Girls (n = 215) 130.4(5.7) 28.3(5.2) 200.3(11.0)
9 Boys (n = 187) 138.9(6.8) 37.9(10.5) 214.9(13.8)
Girls (n = 183) 138.2(6.5) 33.1(7.1) 210.7(12.1)
10 Boys (n = 232) 142.3(6.5) 37.7(8.5) 220.0(12.1)
Girls (n = 232) 142.0(7.1) 35.9(8.6) 216.0(11.9)
11 Boys (n = 176) 150.2(7.9) 46.5(11.1) 233.3(13.9)
Girls (n = 190) 150.8(7.3) 42.4(9.0) 226.0(12.0)
12 Boys (n = 151) 156.0(8.1) 51.4(11.8) 240.5(13.2)
Girls (n = 200) 154.5(5.9) 47.9(10.1) 229.6(9.4)
13 Boys (n = 224) 160.1(7.9) 51.5(11.6) 246.0(12.7)
Girls (n = 208) 156.8(6.1) 48.8(9.1) 230.3(9.4)
14 Boys (n = 227) 165.0(8.5) 56.6(13.2) 249.9(13.3)
Girls (n = 256) 160.1(5.9) 51.7(8.1) 232.3(9.3)
15 Boys (n = 174) 169.9(7.3) 61.1(12.2) 252.0(11.8)
Girls (n = 193) 162.5(6.3) 56.5(8.8) 236.6(10.1)
16 Boys (n = 189) 172.3(6.3) 63.8(10.6) 253.3(10.6)
Girls (n = 182) 160.9(5.6) 56.1(7.1) 232.3(10.4)
17 Boys (n = 238) 172.5(6.9) 64.2(11.9) 252.5(11.6)
Girls (n = 237) 161.8(6.3) 56.9(8.1) 233.3(10.7)
18 Boys (n = 200) 173.9(6.2) 64.8(8.7) 253.4(10.8)
Girls (n = 198) 162.8(5.4) 57.1(7.8) 232.3(9.3)
Kinesiology 51(2019)1:127-132 Xu, M. et al.: FOOT TYPE CLASSIFICATION FOR CHINESE CHILDREN...
PCA results
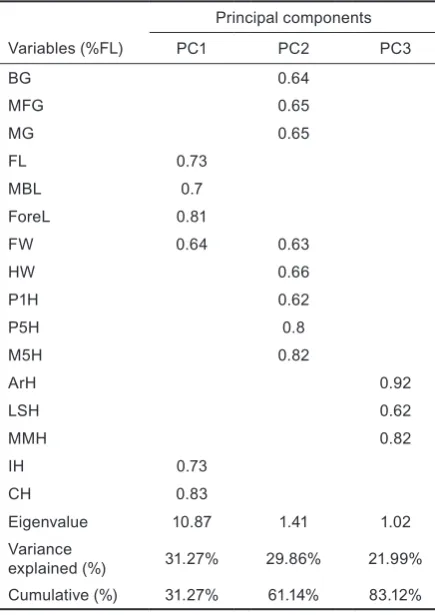
Three principal components (PCs) were obtained and the percentage of the total variance relative to foot length explained by the three prin-cipal components was 83.12%. PC 1 was length-related, including FL, MBL, ForeL, IH and CH. Therefore, PC 1 was named the “length factor”. PC 2 was volume-related, including FW, HW, BG, MFG, MG, P1H, P5H, and M5H. Thus, PC 2 was named the “volume factor”. The variables involved in PC 3 were arch-related, including ArH, LSH, and MMH, so PC 3 was named the “arch factor” (Table 2).
Table 2. PCA results for 16 three-dimension foot variables relative to foot length
Principal components Variables (%FL) PC1 PC2 PC3
BG 0.64
MFG 0.65
MG 0.65
FL 0.73
MBL 0.7
ForeL 0.81
FW 0.64 0.63
HW 0.66
P1H 0.62
P5H 0.8
M5H 0.82
ArH 0.92
LSH 0.62
MMH 0.82
IH 0.73
CH 0.83
Eigenvalue 10.87 1.41 1.02
Variance
explained (%) 31.27% 29.86% 21.99% Cumulative (%) 31.27% 61.14% 83.12% Note. BG – ball girth; MFG – midfoot girth; MG – malleolar girth; FL – foot length; MBL – medial ball length; ForeL – forefoot length; FW – foot width; HW – heel width; P1H – first phalangeal head height; P5H – fifth phalangeal head height; M5H – fifth metatarsal head height; ArH – arch height; LSH – lowest scaphoid point height; IH – instep height; MMH – medial malleolus height; CH – calcaneus height.
Classifying foot shapes
The standardized and independent factors, namely, length, volume, and arch, were used in the hierarchical analysis. Three clusters that represent different foot types were identified on the basis of the three factors. Profiles of the different foot types were described by their optimized cluster center (QUICK CLUSTER) as follows (Figure 3):
(1) Robust Feet (n = 1052; 21%): This foot type was mainly characterized by a fairly high arch and a wide volume. The variables included in the length factor exhibited average z-values of approximately −0.79, indicating a short foot length of this foot type.
(2) Slender Feet (n = 2233; 44%): The feet in this cluster were characterized by their very small volume, that is, they had narrow ball and heel widths as well as a medium arch height. In addi-tion, they displayed a relatively long foot length. (3) Flat Feet (n = 1784; 35%): Compared with the
slender feet, this foot type had a relatively large volume and a low arch height. The variables included in the length factor exhibited average z-values of approximately 0.15, indicating a medium foot length of this foot type.
Distributions of the three foot types in the different foot length groups
The proportions of the foot types in each foot length group totaled 100%. The foot type distribu-tion varied across the different foot length groups. A high proportion of Slender Feet existed in the smaller sizes (foot lengths from 175 mm to 215 mm). In fact, Slender Feet accounted for more than 50% of each size up to 215 mm foot length. By contrast, the Flat Feet type was more represented in the larger sizes (foot lengths from 240 mm to 280 mm); this foot type accounted for over 40% of each size in this foot length group, except for 260 mm foot length. An equal mixture of all foot types was found between the foot lengths of 220 mm and 235 mm (Figure 4).
Discussion and conclusions
This study examined the 3D foot shape data and determined foot type distribution among Chinese children and adolescents. The three different foot types, namely, Robust Feet, Slender Feet and Flat Feet, were identified among the population of Chinese children and adolescents, and the distri-bution of the three foot types varied across the different foot length groups.
The results from this study are consistent with findings from previous studies that investigated the 3D foot shape classification in children. Mauch et al. (2008) classified German children’s feet into five feet types, including flat, slender, robust, short, and long feet using cluster analysis. A comparison of these five feet types with the three foot types iden-tified in the current study shows that the slender and long feet types of the German children can be fused into the Slender Feet type of Chinese young-sters. Furthermore, the robust and short feet types of German children are similar to the Robust Feet type of Chinese kids, which is characterized by a short foot length and a great arch height. The current study is the first large-scale research that investigated the 3D foot shape data of Chinese chil-dren and adolescents.
In the serial footwear production, serial lasts are designed on the basis of a prototype last in a regu-lated length and width graduation (Krauss,Valiant, Horstmann, & Grau, 2010). Therefore, the calcu-lated foot types of an entire sample are based on a prototype shoe size, which is either upscaled or downscaled to produce other sizes. However, this procedure disregards the differences in the
propor-demonstrated in the current study. That is, approx-imately two-thirds of the children with 175-215 mm foot lengths would require shoes designed for a Slender Feet type. If this subsample (175-215 mm foot lengths) is considered separately from the entire sample size range (175-280 mm foot lengths), Robust Feet or Flat Feet might be unaccounted for when using the grand mean of the entire popula-tion. Therefore, the foot type distributions across different foot lengths of children and adolescents should be the basis for recommending a shoe design that considers the foot type classification to improve shoe fit.
Mauch et al. (2009) suggested that the distribu-tion of the foot types in the same shoe size could explain the shoe size-related discrepancies among German children. The results of the current study support their view that different foot length sizes have different foot type distributions. However, Mauch et al. (2009) suggested a high proportion of robust feet existed in small shoe sizes (25-28 French size), whereas Slender Feet had a large share in large shoe sizes (35-41 French size) of German chil-dren aged 2-14 years. The participants’ age range differences and racial differences could explain the foot types distribution differences between the two populations.
A few limitations of the current study should be acknowledged. BMI and physical activity may influence foot shape, which was not considered in the current study. In addition, one important meas-urement for foot dimension determination is an arch height. The arch height is typically measured by navicular or talonavicular joint line, but that land-mark was not digitized in this study. Last, we did
Kinesiology 51(2019)1:127-132 Xu, M. et al.: FOOT TYPE CLASSIFICATION FOR CHINESE CHILDREN...
the current population. The proportion of the flat-foot may influence the results. These limitations should be considered in further studies.
In conclusion, three different foot types, namely, Robust Feet, Slender Feet and Flat Feet, were identified in this study. The foot type
distribu-tion varied across the different foot length groups of Chinese children and adolescents. The results of this study can lay the foundation for the investiga-tion of the development of foot shape and can also provide useful information to consumers and shoe manufacturers.
References
Barisch-Fritz, B., Schmeltzpfenning, T., Plank, C., & Grau, S. (2014). Foot deformation during walking: Differences between static and dynamic 3D foot morphology in developing feet. Ergonomics, 57(6), 921-933. doi: 10.1080/00140139.2014.899629
García-Hernández, J., Heras, S., Juan, A., Paredes, R., Nácher, B., Alemany, S., et al. (2005). The MORFO3D Foot Database. Lecture Notes in Computer Science, 3523, 658-665. doi: 10.1007/11492542_80
Hong, Y., Wang, L., Xu, D.Q., & Li, J.X. (2011). Gender differences in foot shape: A study of Chinese young adults.
Sports Biomechanics, 10(2), 85-97. doi: 10.1080/14763141.2011.569567
Krauss, I., Valiant, G., Horstmann, T., & Grau, S. (2010). Comparison of female foot morphology and last design in athletic footwear—Are men’s lasts appropriate for women? Research in Sports Medicine, 18(2), 140-156. doi: 10.1080/15438621003627216
Lee, Y.C., & Wang, M.J. (2015). Taiwanese adult foot shape classification using 3D scanning data. Ergonomics, 58(3), 513-523. doi: 10.1080/00140139.2014.974683
Li, J.X., Xu, D.Q., Wang, A., & Shao, K. (2005). Analysis of foot shape measures from Chinese male and female adults. In J. Hamill, E. Hardin & K. Williams (Eds.), Proceedings of the 7th Symposium on Footwear Biomechanics
(pp. 84-86). Brentwood: Footwear Biomechanics.
Mauch, M., Grau, S., Krauss, I., Maiwald, C., & Horstmann, T. (2008). Foot morphology of normal, underweight and overweight children. International Journal of Obesity, 32(7), 1068-1075. doi: 10.1038/ijo.2008.52
Mauch, M., Grau, S., Krauss, I., Maiwald, C., & Horstmann, T. (2009). A new approach to children’s footwear based on foot type classification. Ergonomics, 52(8), 999-1008. doi: 10.1080/00140130902803549
Mauch, M., Mickle, K.J., Munro, B.J., Dowling, A.M., Grau, S., & Steele, J.R. (2008). Do the feet of German and Australian children differ in structure? Implications for children’s shoe design. Ergonomics, 51(4), 527-539. doi: 10.1080/00140130701660520
Price, C., & Nester, C. (2016). Foot dimensions and morphology in healthy weight, overweight and obese males. Clinical Biomechanics, 37, 125-130. doi: 10.1016/j.clinbiomech.2016.07.003
Submitted: February 2, 2018 Accepted: October 10, 2018
Correspondence to: Lin Wang, MB, PhD
School of Kinesiology, Shanghai University of Sport, China