Oxide Electrolytes and their
Interfaces for Energy Applications
Aoife K. Lucid
A thesis submitted in partial fulfillment of the requirements
for the degree of Doctor of Philosophy
at the
School of Chemistry and CRANN,
Trinity College Dublin,
Supervisor: Professor Graeme W. Watson
I declare that this thesis has not been submitted as an exercise for a degree at this
or any other university and it is entirely my own work, except where otherwise cited,
referenced, acknowledged, or accredited.
I agree to deposit this thesis in the University’s open access institutional repository
or allow the library to do so on my behalf, subject to Irish Copyright Legislation and
Trinity College Library conditions of use and acknowledgement.
Signed:
Aoife K. Lucid
2018
University of Dublin, Trinity College
One of the greatest challenges facing the sustainability of our planet is the
develop-ment of efficient, clean and environdevelop-mentally friendly methods of converting and storing
energy from renewable sources. Solid oxide fuel cells and solid oxide electrolyser cells
have been proposed for this purpose. Ideally, a reversible cell would exist wherein fuel
is used to generate electricity in fuel cell mode and energy is stored in the form of fuel
in electrolysis mode. The solid electrolyte in these devices is key to their operation as
they transport oxide ions from the oxygen electrode to the fuel electrode to convert
fuel to electricity. The primary issue with most modern solid oxide cells is the high
op-erating temperature which is required for oxide ion conduction across the electrolyte
to occur. This leads to degradation of the device and causes costs to be high. In
recent years there has been great interest in developing electrolytes for intermediate
temperature devices (IT, 600 - 800◦C). CeO2 doped with trivalent cations has been
suggested as a suitable electrolyte as it displays ionic conductivities comparable to
that of current electrolytes but in the intermediate temperature range.
In this thesis, we first investigate the effect of trivalent dopants on structure and
reducibility of CeO2, using density functional theory. These are key properties which
should be considered in an oxide ion conducting electrolyte; the local defect structure
will have an impact on the oxide ion conductivity of the material, and the reducibility is
important in the context of unwanted electronic conduction. If electronic conduction
occurs in the electrolyte of a solid oxide cell, it will short circuit and thus will be
rendered useless, therefore, the reduction of Ce4+ to Ce3+ is undesirable. Different
dopants will impact the local defect structure and the reducibility of ceria differently,
and so with this work, we aimed to elucidate which dopants are best suited for solid
oxide electrolyte applications. Sm, Gd, Pr and Nd were identified as the most suitable
dopants for ceria for solid oxide electrolyte applications.
A direct study of the diffusion and dynamics in doped ceria requires large simulation
cells, meaning molecular dynamics in conjunction with interatomic potentials must be
utilised. The second part of this work is concerned with the effect of polarisability in
the modelling of doped ceria. It is well known that the oxide ion is highly
polaris-able; however, the inclusion of the effects of this polarisability can be computationally
expensive. Therefore, we investigate the effect of both excluding and including the
po-larisability self-consistently when modelling doped ceria. This is done by considering
two interatomic potential models which are both derived from the sameab initio data, where one is a rigid ion model, and the other a dipole polarisable ion model. Bulk
supercells of doped ceria were used to carry out this study, where it was found that it
was necessary to use the polarisable model due to the high polarisability of the oxide
ion.
Thirdly, the effects of surfaces and biaxial tensile strain (as a result of epitaxial growth)
on ionic conduction are also of interest. Much work has focused on the optimisation
of defect interactions in doped ceria, and so it is necessary to consider different routes
to optimisation. The effect of different specific surface terminations across a range of
stabilities is investigated for doped ceria. The impact of strain on thin films has been
debated, with moderate to no enhancements in ionic conductivity observed for doped
ceria. Here, we study the effect of a range of tensile strains across multiple surface
terminations. It was found that different surface terminations affect ionic diffusion at
the surface differently and the level of enhancement with strain varied according to
surface termination.
The fourth focus in this work is the effect of grain boundaries on the oxide ion
conduc-tivity in these materials. These interfaces are essential to the performance of doped
ceria as solid oxide electrolytes. It is well known that the microstructure has a
sig-nificant impact on many material properties such as ionic conductivity. It has been
suggested that the grain boundaries in these materials can result in reduced oxide ion
conductivity; however, the majority of studies consider only the average effect of the
interface and not the possible effects of different specifically defined interfaces. Here
we discuss the effect of specific tilt grain boundaries on the performance of doped ceria
as an oxide ion conductor.
Lastly, we turn to an alternative electrolyte material, LaGaO3 doped with Sr and
Mg, as it is known to display high ionic conductivities in the IT range. Despite
this promising behaviour, very little is understood or known about interfaces in the
material, an area where computational study is vital. In this work, we aim to develop a
polarisable interatomic potential for doped LaGaO3 which would ultimately be used to
study interfaces in the material and their effect on ionic conduction. The preliminary
interatomic potential for LaGaO3 has shown excellent agreement with experimental
structural data, with the doped LaGaO3 interatomic potential reproducing DFT data
Firstly, a huge thank you is owed to my supervisor Prof. Graeme Watson for his endless
patience, assistance and guidance throughout my work. His insight and expertise have
been priceless to me on many occasions, and I truly cannot thank him enough for
the opportunity to undertake this work. Thanks to all of the members of the Watson
group during my time here for office chats (both work and non-work related) and
for listening to me rant and rave about all aspects of work and life: Dr. Jeremy
Allen, Dr. Mario Burbano, Dr. John Carey, Dr. Patrick Keating, Dr. Aoife Kehoe,
Dr. Umadevi Deivasigamani, Douglas Temple, Aoife Plunkett, Swetanshu Tandon and
Julia Savioli. A very special thank you goes to Ailbhe Gavin for sharing many pictures
of dogs and many lunches and doughnuts when they were needed most.
I also want to thank SFI for funding without which this work could not have been
undertaken. Computational support and resources have been vital to the completion
of this work, for which I want to thank Research IT in TCD for maintenance of
the Kelvin and Lonsdale clusters - on which much of the initial work was carried
out - ICHEC, for continued funding of projects on the Fionn supercomputer and the
PRACE DECI scheme for the time obtained on the SISU machines.
To my family, and especially my parents, thank you for always being there and
sup-porting me throughout my time in education, and particularly my time in U.C.C. and
Trinity neither of which would have been possible without you.
Lastly, thank you to Chris, for being there whenever I needed you, whether it be to
bounce a work idea around or for a much-needed laugh, thank you so much.
Related to Thesis Work
1. A. K. Lucid and G. W. Watson, ”The importance of polarizability in the
mod-eling of ionic diffusion in ceria”, IOP Conf. Ser.: Mat. Sci. Eng. 169, 012002
(2017)
2. A. K. Lucid, P. R. L. Keating, J. P. Allen and G. W. Watson, ”Structure and
Reducibility of CeO2 Doped with Trivalent Cations”, J. Phys. Chem. C 120,
23430-23440 (2016)
A number of papers related to the work in Chapters 6 and 7 are in preparation.
Not Related to Thesis Work
1. K. C. Schwartzenberg, J. W. J. Hamilton, A. K. Lucid, E. Weitz, J. Notestein,
M. Nolan, J. A. Byrne and K. A. Gray, ”Multifunctional photo/thermal catalysts
for the reduction of carbon dioxide”, Cat. Today 280, 65073 (2017)
2. M. Fronzi, A. Iwaszuk, A. K. Lucid and M. Nolan, ”Metal oxide
nanocluster-modified TiO2 as solar activated photocatalyst materials”, J. Phys: Cond. Mat.
28, 074006 (2016)
3. M. Nolan, A. Iwaszuk, A. K. Lucid, J. J. Carey and M. Fronzi, ”Design of Novel
Visible Light Active Photocatalyst Materials: Surface Modified TiO2”, Adv.
Mat. 28, 5435-5446 (2016)
4. A. Iwaszuk∗, A. K. Lucid∗ and M. Nolan, ”First principles investigation of
anion-controlled red shift in light absorption in ZnX (X = O, S, Se) nanocluster
mod-ified rutile TiO2”, J. Mat. Chem. A 2, 18796-18805 (2014)
5. A. K. Lucid, A. Iwaszuk and M. Nolan, ”A first principles investigation of Bi2O3
-modified TiO2 for visible light Activated photocatalysis: The role of TiO2crystal
form and the Bi3+ stereochemical lone pair”, Mat. Sci. Semicond. Process. 25, 59-67 (2014)
Conference Talks
Throughout my doctoral research I have presented the following conference talks
1. “Molecular dynamics investigation of doped ceria materials for solid oxide fuel
cell electrolytes ”, Aoife K. Lucid and Graeme W. Watson, Irish Atomic
Simu-lators Meeting, University College Dublin, Dublin, Ireland, January (2016)
2. “Molecular dynamics investigation of samarium doped ceria and its interfaces
for solid-oxide fuel-cell applications”, Aoife K. Lucid and Graeme W. Watson,
European-Materials Research Society Spring Meeting, Lille, France, May (2016)
3. “Modelling of electrolytes for solid oxide fuel cell applications ”, Aoife K. Lucid
and Graeme W. Watson, Third Year Talks Symposium, Trinity College Dublin,
Ireland, June (2016)
4. “Molecular dynamics study of samarium and gadolinium doped ceria and their
interfaces for solid-oxide fuel-cell applications”, Aoife K. Lucid and Graeme W.
Watson,International Conference on Defects in Insulating Materials, University of Lyon, Lyon, France, July (2016)
5. “Computational modelling of electrolytes and their interfaces for solid oxide
fuel cell applications”, Aoife K. Lucid and Graeme W. Watson, Trinity College Dublin Chemistry Colloquium, Trinity College Dublin, Dublin, Ireland, Septem-ber (2016)
6. “Force field derivation and modelling of LaGaO3 for solid oxide fuel cell
elec-trolytes”, Aoife K. Lucid and Graeme W. Watson, Royal Society of Chemistry
Solid State Chemistry Group Christmas Meeting, University of Loughborough, Loughborough, England, December (2016)
7. “Interfaces and their influence on oxide ion diffusion in doped ceria”, Aoife K.
Lucid and Graeme W. Watson,American Chemical Society Spring Meeting, San
Francisco, California, USA, April (2017)
8. “An interatomic potential for a perovskite electrolyte derived from first
prin-ciples”, Aoife K. Lucid and Graeme W. Watson, American Chemical Society
9. “Interfaces and their influence on oxide ion diffusion in doped ceria”, Aoife
K. Lucid and Graeme W. Watson, Materials Research Society Spring Meeting,
Phoenix, Arizona, USA, April (2017)
10. “Strain effects in surfaces of doped ceria for electrochemical device applications”,
Aoife K. Lucid and Graeme W. Watson,Materials Research Society Spring
Meet-ing, Phoenix, Arizona, USA, April (2017)
11. “An interatomic potential for LaGaO3derived from first principles”, Aoife K.
Lu-cid and Graeme W. Watson,Materials Research Society Spring Meeting, Phoenix, Arizona, USA, April (2017)
12. “Computational Modelling of Electrolytes for Solid Oxide Cells”, Aoife K. Lucid
and Graeme W. Watson, 69th Irish Universities Chemistry Research Colloquium,
Dublin City University, Dublin, Ireland, July (2017) (Eli Lilly Oral Prize Runner Up)
In addition to these talks I have also presented aspects of my work and have had
colleagues present my work on seventeen conference posters in total, fourteen of which
Declaration iii
Summary iv
Acknowledgements vii
Publications viii
List of Figures xvii
List of Tables xxi
List of Abbreviations xxv
1 Introduction 1
1.1 Solid oxide fuel cells . . . 2
1.2 Solid oxide electrolysis cells . . . 4
1.3 Electrolytes for SOCs . . . 6
1.3.1 Fluorite electrolytes . . . 6
1.3.1.1 CeO2 . . . 7
1.3.2 Perovskite electrolytes . . . 10
1.3.2.1 LaGaO3 . . . 10
1.3.3 Defects in solid oxide electrolytes . . . 11
1.4 Interfaces in SOC electrolytes . . . 12
1.5 Thesis outline . . . 13
2 Theoretical background 17 2.1 Introduction . . . 17
2.2 Quantum chemistry . . . 18
2.2.1 The Schr¨odinger eqauation . . . 18
2.2.2 The Born-Oppenheimer approximation . . . 19
2.2.3 The Hartree model . . . 20
2.2.4 Hartree’s self-consistent field model . . . 20
2.2.5 Hartree-Fock theory . . . 21
2.2.6 Limitations of Hartree-Fock . . . 22
2.2.7 Density functional theory . . . 23
2.2.8 DFT+U . . . 26
2.2.9 Hybrid DFT . . . 28
2.3 Interaction potential methods . . . 30
2.3.1 Long range interaction . . . 30
2.3.2 Ewald summation for point charges . . . 30
2.3.3 Short range interactions . . . 32
2.3.4 Short range effects in ionic systems . . . 33
2.3.5 Environmental polarisation effects . . . 34
2.4 Form of the interaction potential . . . 36
3 Computational methodology 39 3.1 Introduction . . . 39
3.2 Periodic boundary conditions . . . 40
3.3 Density functional theory simulations of solids . . . 41
3.3.1 Basis sets and pseudopotentials . . . 41
3.3.2 Brillouin zone and k-points . . . 43
3.3.3 Electronic and geometric optimisation . . . 46
3.3.4 Structural optimisation and convergence testing . . . 46
3.4 Electronic structure analysis . . . 50
3.4.1 Band structure . . . 50
3.4.2 Electronic density of states . . . 50
3.5 Molecular dynamics simulations . . . 52
3.5.1 Algorithms . . . 52
3.5.2 Ensembles . . . 56
3.5.3 Nearest image convention and short range cut off . . . 58
3.5.4 MD procedure . . . 59
3.6 MD analysis . . . 60
3.6.1 Mean squared displacement . . . 60
3.6.2 Radial distribution function . . . 62
3.6.3 Vacancy analysis . . . 63
3.7 Surface structure generation . . . 64
3.8 Grain boundary structure generation and definition . . . 66
4 The structure and reducibility of trivalently doped ceria 69 4.1 Introduction . . . 69
4.2 Methodology . . . 71
4.2.1 Occupation matrix control . . . 74
4.3 Results . . . 75
4.3.1 Pure ceria . . . 75
4.3.2 Structure of doped ceria . . . 75
4.3.3 The effect of dopants on the reducibility of CeO2 . . . 84
4.4 Discussion . . . 86
4.5 Conclusions . . . 91
5.2 Previous computational studies . . . 94
5.3 Methodology . . . 96
5.3.1 Potential fitting . . . 97
5.3.2 Potential parameters . . . 98
5.4 RIM vs. DIPPIM . . . 99
5.4.1 Ionic conductivity . . . 99
5.4.2 Activation energy . . . 103
5.4.3 Structure . . . 105
5.4.4 Defect analysis . . . 106
5.4.5 Phonon modes in pure CeO2 . . . 109
5.4.6 Conclusions . . . 111
5.5 Molecular dynamics study of bulk doped ceria . . . 111
5.5.1 Ionic conductivity . . . 111
5.5.2 Activation energy . . . 114
5.5.3 Structure . . . 116
5.5.4 Defect analysis . . . 116
5.5.5 Conclusions . . . 119
6 The impact of surfaces and strain on ionic diffusion in doped ceria 121 6.1 Introduction . . . 121
6.2 Methodology . . . 125
6.3 Results and discussion . . . 127
6.4 The impact of surfaces . . . 127
6.4.1 (111) surface . . . 127
6.4.1.1 Ionic diffusion of (111) slab . . . 127
6.4.1.2 Ionic diffusion at the (111) surface - SmDC . . . 128
6.4.1.3 Ionic diffusion at the (111) surface - GdDC . . . 135
6.4.1.4 Activation energy of (111) slab . . . 139
6.4.2 (221) surface . . . 139
6.4.2.1 Ionic diffusion of (221) slab . . . 139
6.4.2.2 Ionic diffusion of (221) surface - SmDC . . . 140
6.4.2.3 Ionic diffusion of (221) surface - GdDC . . . 142
6.4.2.4 Activation energy of (221) slab . . . 145
6.4.3 (210) surface . . . 146
6.4.3.1 Ionic diffusion of (210) slab . . . 146
6.4.3.2 Ionic diffusion of (210) surface - SmDC . . . 147
6.4.3.3 Ionic diffusion of (210) surface - GdDC . . . 150
6.4.3.4 Activation energy of (210) slab . . . 152
6.5 The impact of strain . . . 153
6.5.1 (111) surface . . . 153
6.5.1.1 Ionic diffusion (111) slab and surface - SmDC . . . 153
6.5.1.2 Ionic diffusion (111) slab and surface - GdDC . . . 155
6.5.2 (221) surface . . . 160
6.5.2.1 Ionic diffusion (221) slab and surface - GdDC . . . 160
6.5.2.2 Activation energy of (221) slab . . . 164
6.5.3 (210) surface . . . 165
6.5.3.1 Ionic diffusion (210) slab and surface - SmDC . . . 165
6.5.3.2 Ionic diffusion (210) slab and surface - GdDC . . . 167
6.5.3.3 Activation energy of (210) slab . . . 170
6.6 Conclusions . . . 171
7 Grain boundaries and their effect on ionic diffusion in doped ceria 175 7.1 Introduction . . . 175
7.2 Methodology . . . 176
7.2.1 Pure CeO2 grain boundaries . . . 176
7.2.2 Doped CeO2 grain boundaries . . . 176
7.3 Results . . . 177
7.3.1 Grain boundary structure . . . 177
7.3.2 Ionic diffusion parallel to the grain boundaries . . . 179
7.3.2.1 Σ3(111) . . . 179
7.3.2.2 Σ9(221) . . . 180
7.3.2.3 Σ5(210) . . . 182
7.3.3 Ionic diffusion perpendicular to the grain boundaries . . . 183
7.4 Conclusions . . . 184
8 Derivation of a polarisable interatomic potential for LaGaO3 187 8.1 Introduction . . . 187
8.1.1 The Goldschmidt tolerance factor . . . 188
8.2 Methodology . . . 191
8.2.1 Data generation . . . 191
8.2.2 Wannier analysis for dipole extraction . . . 192
8.2.3 Fitting process . . . 194
8.3 Results of potential fitting . . . 197
8.3.1 Pure LaGaO3 . . . 197
8.3.2 Pure and doped LaGaO3 . . . 201
8.4 Conclusions and future work . . . 203
9 Conclusions and future work 205 9.1 Conclusions . . . 205
9.2 Future work . . . 208
9.2.1 Surfaces and strain . . . 208
9.2.2 Interfaces . . . 209
1.1 Schematic illustration of a solid oxide fuel cell. . . 3
1.2 Schematic illustration of a solid oxide electrolysis cell. . . 5
1.3 The fluorite unit cell with space groupF m¯3m. . . 7
1.4 The cubic perovskite (ABO3) crystal structure with space group P m¯3m. 10 1.5 Orthorhombic (P bnm) and rhombohedral (R¯3c) structures of LaGaO3. 11 1.6 Defects which can be present in solid oxide electrolytes arranged accord-ing to their dimension. . . 12
1.7 A schematic illustration of a polycrystalline material showing the spe-cific structure of a grain boundary. . . 13
2.1 Schematic illustration of the DFT+U correction. . . 27
2.2 Schematic illustration of the concept of the Ewald sum for electrostatics. 32 2.3 Illustration of the effect of coordination environments on electron den-sity of ions. . . 34
2.4 Illustration of the effect of symmetry breaking on an ions confining potential due to its environment. . . 36
2.5 The Tang-Tonnies damping function. . . 38
3.1 Schematic illustration of periodic boundary conditions. . . 41
3.2 Schematic illustration of relationship between the all-electron and pseu-dopotential wave functions. . . 43
3.3 Schematic of a band structure in the Brillouin zone. . . 45
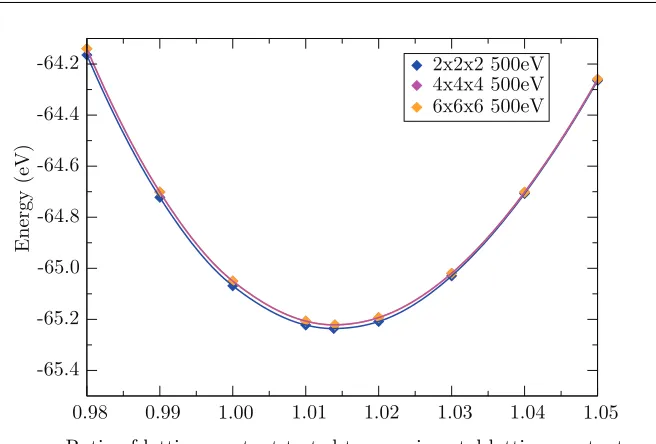
3.4 Points on energy-volume curve for CeO2 across threek-point meshes. . 49
3.5 The first Brillouin zone of the F m¯3m space group and the band struc-ture of CeO2 with the valence band maximum aligned to 0 eV. . . 50
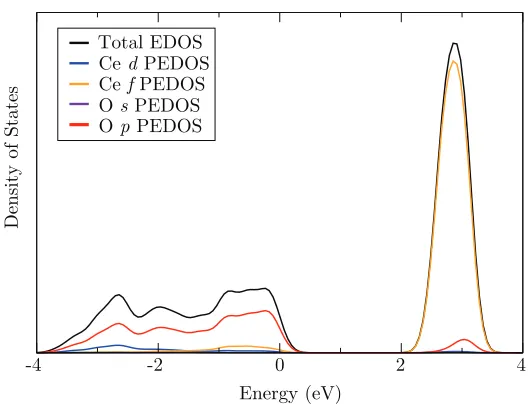
3.6 Electronic density of states and partial electronic density of states for CeO2 with the valence band maximum aligned to 0 eV. . . 51
3.7 Schematic illustration of the nearest image convention. . . 59
3.8 Partial RDF between Ce and O atoms in CeO2 at 1173 K. . . 62
3.9 Schematic illustration of the radial distribution function. . . 63
3.10 Partial vacancy-vacancy and O-O RDFs in Ce0.9Sm0.1O1.95 at 1173 K. . 64
3.11 Schematic of Tasker surface types and reconstructions. . . 65
3.12 The potential energy surface scan used to identify the minimum energy Σ9(221) grain boundary is shown and the Σ9(221) grain boundary in pure ceria is shown before and after optimisation. . . 66
4.1 Ferromagnetic and antiferromagnetic structures of pure sesquioxides. . 74
4.2 Starting configurations for doped CeO2 with CCVs at varying positions. 76 4.3 Lowest energy structure for Al-doped CeO2. . . 78
4.4 Lowest energy structure for Sb, Sc, In, Tl, Y and Bi-doped CeO2. . . . 79
4.5 Lowest energy structure for Nd, Pr and La-doped CeO2. . . 80
4.6 Charge density around Y and Bi cations and CCV in doped CeO2. . . . 80
4.7 The electronic density of states for Bi-doped CeO2. . . 82
4.8 The two positions tested for an intrinsic oxygen vacancy in doped CeO2. 85 4.9 The reduction energies for doped CeO2. . . 86
5.1 Ionic conductivity of Ce1−xSmxO2−x/2 at 973 K: RIM vs.DIPPIM. . . . 99
5.2 Ionic conductivity of Ce1−xSmxO2−x/2 at 973 K: RIM vs. DIPPIM with experiment. . . 100
5.3 ln(σT) vs. 1000/T for Ce0.9Sm0.1O1.95: RIM vs.DIPPIM. . . 104
5.4 Partial radial distribution functions for Ce0.9Sm0.1O1.95 at 973 K: RIM vs. DIPPIM. . . 106
5.5 Dopant-vacancy radial distribution functions for Ce0.9Sm0.1O1.95 and Ce0.75Sm0.25O1.875 at 973 K: RIM vs. DIPPIM. . . 107
5.6 Vacancy-vacancy partial radial distribution functions for Ce0.9Sm0.1O1.95 and Ce0.75Sm0.25O1.875 at 973 K: RIM vs. DIPPIM. . . 109
5.7 Ionic conductivity of Ce1−xGdxO2−x/2 at 973 K with experiment. . . 112
5.8 ln(σT) vs. 1000/T for Ce0.9Gd0.1O1.95 and Ce0.9Sm0.1O1.95. . . 114
5.9 Partial radial distribution functions for Ce0.9Gd0.1O1.95 at 973 K. . . 116
5.10 Dopant-vacancy partial radial distribution functions for Ce0.9Gd0.1O1.95 and Ce0.75Gd0.25O1.875 at 973 K. . . 117
5.11 Vacancy-vacancy partial radial distribution functions for Ce0.9Sm0.1O1.95, Ce0.9Gd0.1O1.95, Ce0.75Sm0.25O1.875 and Ce0.75Gd0.25O1.875 at 973 K. . . . 119
6.1 Schematic illustration of the effect of tensile strain on a thin film, show-ing biaxial strain and the Poisson effect. . . 124
6.2 The surface structures of the (111), (210) and (221) surfaces of ceria. . 124
6.3 Dimensions of (111) CeO2 slab used for simulations. . . 126
6.4 The 2D diffusion coefficients of bulk and the (111) slab of (a)GdDC and (b)SmDC at 973 K. . . 128
6.5 Diffusion versus depth for the (111) surface of Ce0.9Sm0.1O1.95 at 973 K. 129 6.6 The oxygen vacancy density distribution in the (111) slab of Ce0.9Sm0.1O1.95 before and after a 1673 K temperature scaling run. . . 130
6.7 The oxygen vacancy density distribution in the (111) slab of Ce0.9Sm0.1O1.95 after 1 ns at 973 K. . . 131
6.8 Diffusion versus depth for the (111) surface of Ce0.8Sm0.2O1.9 at 973 K. 133 6.9 The oxygen vacancy density distribution in the (111) slab of Ce0.8Sm0.2O1.9 after 1 ns at 973 K. . . 134
6.10 Diffusion versus depth for the (111) surface of Ce0.9Gd0.1O1.95 at 973 K. 135 6.11 The oxygen vacancy density distribution in the (111) slab of Ce0.9Gd0.1O1.95 after 1 ns at 973 K. . . 136
6.12 Diffusion versus depth for the (111) surface of Ce0.8Gd0.2O1.9 at 973 K. 137 6.13 The oxygen vacancy density distribution in the (111) slab of Ce0.8Gd0.2O1.9 after 1 ns at 973 K. . . 138
6.15 Diffusion versus depth for the (221) surface of Ce0.9Sm0.1O1.95 at 973 K. 141
6.16 The oxygen vacancy density distribution in the (221) slab of Ce0.9Sm0.1O1.95
after 1 ns at 973 K. . . 142 6.17 Diffusion versus depth for the (221) surface of Ce0.9Gd0.1O1.95 at 973 K. 144
6.18 The oxygen vacancy density distribution in the (221) slab of Ce0.9Gd0.1O1.95
after 1 ns at 973 K. . . 144 6.19 The 2D diffusion coefficients of bulk and the (210) slab of (a)GdDC and
(b)SmDC at 973 K. . . 147 6.20 Diffusion versus depth for the (210) surface of Ce0.9Sm0.1O1.95 at 973 K. 148
6.21 The oxygen vacancy density distribution in the (210) slab of Ce0.9Sm0.1O1.95
after 1 ns at 973 K. . . 149 6.22 Diffusion versus depth for the (210) surface of Ce0.9Sm0.1O1.95 at 973 K. 150
6.23 Diffusion versus depth for the (210) surface of Ce0.9Gd0.1O1.95 at 973 K. 151
6.24 The oxygen vacancy density distribution in the (210) slab of Ce0.9Gd0.1O1.95
after 1 ns at 973 K. . . 151 6.25 The enhancement in diffusion when strained slabs are compared to
un-strained slabs (Dstrained/D) for Ce0.9Sm0.1O1.95 across all strains, at 773
K, 973 K and 1173 K for the (111) slab. . . 154 6.26 Diffusion versus depth for the (111) surface of Ce0.9Sm0.1O1.95 at 973 K,
for the unstrained slab and tensile strains of 1, 2 and 4%. . . 155 6.27 The enhancement in diffusion when strained slabs are compared to
un-strained slabs (Dstrained/D) for Ce0.9Gd0.1O1.95 across all strains, at 773
K, 973 K and 1173 K for the (111) slab. . . 156 6.28 Diffusion versus depth for the (111) surface of Ce0.9Gd0.1O1.95 at 973 K,
for the unstrained slab and tensile strains of 1, 2 and 4%. . . 157 6.29 The enhancement in diffusion when strained slabs are compared to
un-strained slabs (Dstrained/D) for Ce0.9Gd0.1O1.95 across all strains, at 773
K, 973 K and 1173 K for the (221) slab. . . 161 6.30 Diffusion versus depth for the (221) surface of Ce0.9Gd0.1O1.95 at 973 K,
for the unstrained slab and tensile strains of 1, 2 and 4%. . . 162 6.31 The enhancement in diffusion when strained slabs are compared to
un-strained slabs (Dstrained/D) for Ce0.9Sm0.1O1.95 across all strains, at 773
K, 973 K and 1173 K for the (210) slab. . . 166 6.32 Diffusion versus depth for the (210) surface of Ce0.9Sm0.1O1.95 at 973 K,
for the unstrained slab and tensile strains of 1, 2 and 4%. . . 166 6.33 The enhancement in diffusion when strained slabs are compared to
un-strained slabs (Dstrained/D) for Ce0.9Gd0.1O1.95 across all strains, at 773
K, 973 K and 1173 K for the (210) slab. . . 167 6.34 Diffusion versus depth for the (210) surface of Ce0.9Gd0.1O1.95 at 973 K,
for the unstrained slab and tensile strains of 1, 2 and 4%. . . 168
7.1 Schematic illustration of a grain boundary cell used for simulations. . . 177
7.2 The structure of the Σ3(111) grain boundary compared to TEM. . . 178
7.3 The structure of the Σ9(221) grain boundary compared to TEM. . . 178
7.5 Ionic diffusion parallel to the Ce0.9Sm0.1O1.95 Σ3(111) grain boundary
at 973 K. . . 180 7.6 Sliced oxygen vacancy number density (˚A−3) for Σ3(111) grain
bound-ary at 973 K for Ce0.9Sm0.1O1.95 after 1 ns. . . 180
7.7 Ionic diffusion parallel to the Ce0.9Sm0.1O1.95 Σ9(221) grain boundary
at 973 K. . . 181 7.8 Sliced oxygen vacancy number density (˚A−3) for Σ9(221) grain
bound-ary at 973 K for Ce0.9Sm0.1O1.95 after 1 ns. . . 181
7.9 Ionic diffusion parallel to the Ce0.9Sm0.1O1.95 Σ5(210) grain boundary
at 973 K. . . 182 7.10 Ionic diffusion parallel to the Ce0.9Sm0.1O1.95 Σ5(210) grain boundary
at 973 K. . . 183 7.11 Directional MSD for Σ3(111) Sm0.1Ce0.9O1.95 (∼82 ˚A) at 1673 K. . . . 184
7.12 Directional MSD for Σ3(111) Sm0.1Ce0.9O1.95 (∼26 ˚A) at 1673 K. . . . 184
8.1 Schematic illustration of the Goldschmidt tolerance factor. . . 189 8.2 (a)Orthorhombic (P bnm) (b)Rhombohedral (R¯3c) and (c)Cubic (P m¯3m)
structure of LaGaO3. . . 192
8.3 Flow chart demonstrating the potential fitting process. . . 195
8.4 Comparison of dipoles from DFT and DIPPIM along the x-axis for a
number of the pure LaGaO3 configurations used in potential fitting. . . 199
8.5 Comparison of forces from DFT and DIPPIM along the x-axis for a
number of the pure LaGaO3 configurations used in potential fitting. . . 200
8.6 Comparison of dipoles from DFT and DIPPIM along the x-axis for a
number of the doped LaGaO3 configurations used in potential fitting. . 202
8.7 Comparison of forces from DFT and DIPPIM along the x-axis for a
3.1 Energy per formula unit CeO2for varying plane wave cut-off andk-point
mesh. . . 49
4.1 The preferred position and calculated doping energies of trivalent dopants in CeO2. . . 77
4.2 The ∆E and Eass values calculated for trivalent dopants in ceria. . . . 84
4.3 A summary of the ionic radii, preferred dopant sites, doping
ener-gies, difference in energy between next-neighbour and nearest-neighbour charge compensating vacancy positions, reduction energies and association energies for the trivalent dopants in CeO2. . . 89
5.1 Short range repulsion and dispersion parameters for the DIPPIM
po-tential for doped ceria. . . 98
5.2 Polarisability parameters for the doped ceria DIPPIM potential. . . 98
5.3 Short range repulsion and dispersion parameters for the RIM potential for doped ceria derived in this work. . . 99 5.4 Diffusion coefficients (D) and ionic conductivity (σ) for Ce1−xSmxO2−x/2,
x= 0.5,0.10,0.15,0.20,0.25 at 773 K, 973 K and 1173 K obtained using the RIM potential. . . 101 5.5 Diffusion coefficients (D) and ionic conductivity (σ) for Ce1−xSmxO2−x/2,
x= 0.5,0.10,0.15,0.20,0.25 at 773 K, 973 K and 1173 K obtained using the DIPPIM potential. . . 102 5.6 Ionic conductivity of Ce0.9Sm0.1O1.95 at 973 K: RIM vs. DIPPIM . . . . 103
5.7 Activation energy of Ce0.9Sm0.1O1.95: RIM vs. DIPPIM . . . 104
5.8 Activation energies of oxide ion conduction for both RIM and DIPPIM
calculations of SmDC, calculated from 773 - 1173 K. . . 105
5.9 Number of oxygen vacancies in the NN and NNN positions with respect
to the cations in a random distribution (Ce-O) and SmDC (RIM and DIPPIM). . . 108 5.10 Number of oxygen vacancies around another oxygen vacancy along the
directions in the oxide simple cubic sublattice of Ce0.9Sm0.1O1.95. . . 109
5.11 Calculated phonon mode frequencies of pure CeO2 at high symmetry
points of the Brillouin zone. . . 110 5.12 Ionic conductivity of Ce0.9Gd0.1O1.95 at 973 K with experiment. . . 112
5.13 Diffusion coefficients (D) and ionic conductivity (σ) for Ce1−xGdxO2−x/2, x= 0.5,0.10,0.15,0.20,0.25 at 773 K, 973 K and 1173 K. . . 113 5.14 Activation energies of oxide ion conduction for both GdDC and SmDC,
calculated from 773 - 1173 K. . . 115 5.15 Activation energies of oxide ion conduction for Ce0.9Gd0.1O1.95 in the
temperature range 773 K - 1173 K, compared to experiment. . . 115
5.16 Number of oxygen vacancies in the NN and NNN positions with respect to the cations in a random distribution (Ce-O) for Ce0.9Gd0.1O1.95 and
Ce0.9Sm0.1O1.95 at 973 K. . . 118
5.17 Number of vacancies around another vacancy along the directions in the oxide simple cubic sublattice of a random distribution (O-O), Ce0.9Gd0.1O1.95
and Ce0.9Sm0.1O1.95 at 973 K. . . 118
6.1 The Tasker types of the (111), (210) and (221) surfaces of ceria. . . 126 6.2 The oxygen vacancy concentrations by slice in the (111) slab of Ce0.9Sm0.1O1.95
after 1 ns at 973 K. . . 132 6.3 The oxygen vacancy concentrations by slice in the (111) slab of Ce0.8Sm0.2O1.9
after 1 ns at 973 K. . . 134 6.4 The oxygen vacancy concentrations by slice in the (111) slab of Ce0.9Gd0.1O1.95
after 1 ns at 973 K. . . 136 6.5 The oxygen vacancy concentrations by slice in the (111) slab of Ce0.8Gd0.2O1.9
after 1 ns at 973 K. . . 138 6.6 The activation energies of oxide ion diffusion for Ce1−xMxO2−x/2 (M =
Sm, Gd; x = 0.10, 0.20) for bulk, (111) slab and the (111) surface from 773 - 1173 K. . . 140 6.7 The oxygen vacancy concentrations by slice in the (221) slab of Ce0.9Sm0.1O1.95
after 1 ns at 973 K. . . 143 6.8 The oxygen vacancy concentrations by slice in the (221) slab of Ce0.9Gd0.1O1.95
after 1 ns at 973 K. . . 145 6.9 The activation energies of oxide ion diffusion for Ce1−xMxO2−x/ (M =
Sm, Gd, x = 0.10, 0.20) for bulk, (221) slab and the (221) surface from 773 - 1173 K. . . 146 6.10 The oxygen vacancy concentrations by slice in the (210) slab of Ce0.9Sm0.1O1.95
after 1 ns at 973 K. . . 149 6.11 The oxygen vacancy concentrations by slice in the (210) slab of Ce0.9Gd0.1O1.95
after 1 ns at 973 K. . . 152 6.12 The activation energies of oxide ion diffusion for Ce1−xMxO2−x/2 (M =
Sm, Gd, x = 0.10, 0.20) for bulk, (210) slab and the (210) surface from 773 - 1173 K. . . 153 6.13 The oxygen vacancy concentrations by slice in the (111) slab of Ce0.9Gd0.1O1.95
after 1 ns at 973 K, at 1% tensile strain. . . 157 6.14 The oxygen vacancy concentrations by slice in the (111) slab of Ce0.9Gd0.1O1.95
after 1 ns at 973 K, at 2% tensile strain. . . 158 6.15 The oxygen vacancy concentrations by slice in the (111) slab of Ce0.9Gd0.1O1.95
after 1 ns at 973 K, at 4% tensile strain. . . 159 6.16 The activation energies of oxide ion diffusion for Ce0.9M0.1O1.95 (M =
Sm, Gd) for the (111) slab at tensile strains of 0, 1, 2 and 4%, from 773 - 1173 K. . . 159 6.17 The activation energies of oxide ion diffusion for Ce0.9M0.1O1.95 (M =
6.18 The oxygen vacancy concentrations by slice in the (221) slab of Ce0.9Gd0.1O1.95
after 1 ns at 973 K, at 1% tensile strain. . . 162 6.19 The oxygen vacancy concentrations by slice in the (221) slab of Ce0.9Gd0.1O1.95
after 1 ns at 973 K, at 2% tensile strain. . . 163 6.20 The oxygen vacancy concentrations by slice in the (221) slab of Ce0.9Gd0.1O1.95
after 1 ns at 973 K, at 4% tensile strain. . . 164 6.21 The activation energies of oxide ion diffusion for Ce0.9Gd0.1O1.95 for the
(221) slab at tensile strains of 0, 1, 2 and 4%, from 773 - 1173 K. . . . 164 6.22 The activation energies of oxide ion diffusion for Ce0.9M0.1O1.95 (M =
Sm, Gd) at the (221) surface at tensile strains of 0, 1, 2 and 4%, from 773 - 1173 K. . . 165 6.23 The oxygen vacancy concentrations by slice in the (210) slab of Ce0.9Gd0.1O1.95
after 1 ns at 973 K, at 1% tensile strain. . . 169 6.24 The oxygen vacancy concentrations by slice in the (210) slab of Ce0.9Gd0.1O1.95
after 1 ns at 973 K, at 2% tensile strain. . . 169 6.25 The oxygen vacancy concentrations by slice in the (210) slab of Ce0.9Gd0.1O1.95
after 1 ns at 973 K, at 4% tensile strain. . . 170 6.26 The activation energies of oxide ion diffusion for Ce0.9M0.1O1.95 (M =
Sm, Gd) for the (210) slab at tensile strains of 0, 1, 2 and 4%, from 773 - 1173 K. . . 171 6.27 The activation energies of oxide ion diffusion for Ce0.9M0.1O1.95 (M =
Sm, Gd) at the (210) surface at tensile strains of 0, 1, 2 and 4%, from 773 - 1173 K. . . 171
8.1 The ionic radii and coordination numbers of La3+, Ga3+, O2−, Sr2+ and
Mg2+ in LaGaO3 and doped LaGaO3. . . 190
8.2 Potential parameters which were included in the fit for LaGaO3. . . 195
8.3 Effective electron numbers used to calculate C6,ij and their references. . 196
8.4 The weighted objective functions and sample sizes for each set of ob-servables for pure LaGaO3, along with the total objective function. . . 198
8.5 Short range repulsion and dispersion parameters for the DIPPIM
po-tential for pure LaGaO3. . . 198
8.6 Polarisability parameters for the DIPPIM potential for pure LaGaO3. . 198
8.7 Structural parameters for three phases of LaGaO3calculated using
DIP-PIM and DFT(PBE) compared with experimental values from the lit-erature. . . 201
8.8 The weighted objective functions and sample size for each set of
ob-servables for pure and doped LaGaO3, along with the total objective
AFM AntiFerroMagnetic
CCV ChargeCompensating Vacancy
DFT Density Functional Theory
DIPPIM DIPole Polarisable IonModel
EAM Embedded Atom Model
EDOS Electronic Density Of States
EOS Equation Of State
FM FerroMagnetic
GdDC Gd-Doped Ceria
GGA Generalised Gradient Approximation
GB Grain Boundary
HF Hartree-Fock
IP Interatomic Potential
IT Intermediate Temperature
K(L)MC Kinetic (Lattice)Monte Carlo
L(S)DA Local (Spin) Density Approximation
MLWF Maximally Localised Wannier Function
MSD Mean Squared Displacement
MD Molecular Dynamics
NN Nearest Neighbour
NNN Next Nearest Neighbour
NAC NonAnalyticalCorrection
ORR Oxygen Reduction Reaction
PEDOS Partial Electronic Density Of States
PBC Periodic Boundary Conditions
PES Potential Energy Surface
PAW Projector AugmentedWave
RDF Radial Distribution Function
RE-DC Rare Earth-Doped Ceria
RIM Rigid IonModel
SmDC Sm-DopedCeria
SCF Self Consistent Field
SIE Self Interaction Error
SOEC Solid OxideElectrolyserCell
SOE Solid OxideElectrolyte
SOFC Solid OxideFuel Cell
WC Wannier Centre
WF Wannier Function
Introduction
Global energy consumption is at an all-time high and with growth of 28% predicted
between 2015 and 2040 the demand is ever growing.[1] Between 2015 and 2040 all forms
of energy (natural gas, renewable, nuclear, petroleum and other liquids) are predicted
to rise, with the exception of coal whose demand is set to remain the same. Though
the fastest growths are predicted in renewable (2.3%/year) and nuclear (1.5%/year)
energies it is still projected that by the year 2040 the worldwide dependence on fossil
fuels will remain at 77%.[1] The continued dependence on fossil fuels is contributing
to the emission of greenhouse gases, the primary cause of global warming and climate
change which is swiftly approaching crisis levels.[2] In light of this, it is of great
im-portance to develop clean, efficient and environmentally friendly alternative energy
sources which offer long-term solutions to the global energy crisis. Ideally, devices
which are compatible both with fuels which are widely available at present and fuels of
the future, such as H2, would offer a feasible, long-term solution, as such devices would
slot cleanly into a renewable or clean energy grid. One such device is a solid oxide fuel
cell (SOFC); SOFCs have emerged as a promising candidate for the future of energy
conversion due to their high efficiency, fuel flexibility and low pollutant output.[3–7]
The continuing development of the field of computational chemistry allows detailed
in-vestigation of materials for applications in such devices to be carried out. In this thesis,
a combination of density functional theory and classical molecular dynamics
simula-tions are utilised to study properties of solid oxide electrolytes, and their interfaces,
for application in solid oxide fuel and electrolysis cells.
1.1
Solid oxide fuel cells
Fuel cells are electrochemical devices which can efficiently convert chemical energy
into electrical energy. Since the 1960s there has been an intense research effort to
de-velop fuel cell technologies and use these as an alternative energy conversion method.
SOFCs are thought to be the most efficient and flexible current fuel cell technology,
boasting a number of advantages over existing technologies including, high fuel
con-version efficiencies and low pollutant emissions, especially when compared with heat
engines.[3, 8] Internal combustion engines display ∼25% fuel conversion efficiency
ver-sus SOFCs which exhibit ∼40% efficiency. Combined heat and power (CHP) SOFCs,
in which the excess heat produced by the fuel cell is used for heating both
commer-cially and residentially, can be up to ∼80% efficient.[9] This high conversion efficiency
is due to the fact that SOFCs are not limited by the Carnot cycle.[10] As previously
mentioned SOFCs are highly fuel-flexible and can be operated using a variety of fuels
such as natural gas, methanol, liquefied petroleum gas and hydrogen.[11], making them
ideal devices for application with currently available fuels and fuels of the future.
SOFCs are comprised of a solid electrolyte (usually ceramic), a porous anode and a
porous cathode. The electrolytes are typically oxide ion conductors. In these systems,
oxide ions (O2−) are formed at the cathode (oxygen electrode) through the oxygen reduction reactions (ORR) where air, containing O2 gas, reacts at the cathode to form
two O2− ions, according to Equation 1.1.
O2+ 4e−−→2O2− (1.1)
These oxygen ions then travel through the electrolyte in order to react with the fuel
(in this case hydrogen) at the anode (fuel electrode) of the cell, as seen in equation 1.2.
As it is O2− ions being transported through the electrolyte fuel flexibility is achieved, fuel can be obtained from a variety of sources including conventional and renewable
sources. This is in contrast to Polymer Electrolyte Membrane Fuel Cells (PEMFCs)
to produce and store.
2H2+ 2O2−−→2H2O + 4e− (1.2)
The electrolyte must be an electronic insulator, and so the electrons generated at
the anode are forced to return to the cathode via an external circuit which, in turn,
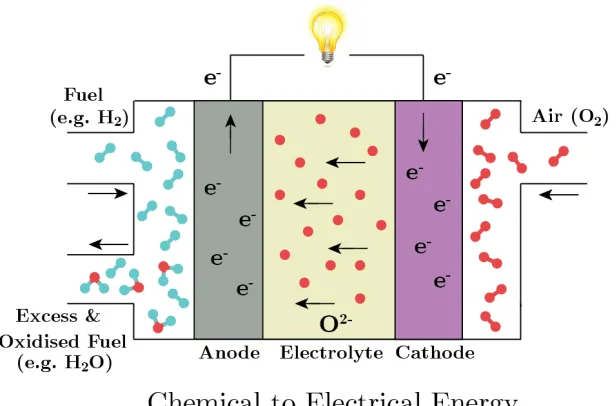
generates electricity. A schematic of the operation of an SOFC is shown in Figure 1.1,
with H2 used as the example fuel. In this case, the only by-product of the conversion
[image:29.596.168.476.263.466.2]of chemical to electrical energy is H2O.
Figure 1.1: Schematic illustration of a solid oxide fuel cell. The fuel considered
here is H2. Oxide ions are shown in red with hydrogen atoms shown in blue.
The cathode should be a mixed ionic-electronic conducting (MIEC) material as this
prevents the ORR from being restricted to the triple-phase-boundary zone, which
would serve to enhance the performance of the SOFC.[12] Current generation SOFCs
use strontium-doped lanthanum manganite (La1−xSrxMnO3, LSM) as the cathode
material.[7] The anode must be electronically conducting, porous, and must have the
ability to oxidise the fuel. A mixed nickel/yttria-stabilised zirconia cermet (Ni/YSZ)
is usually used.[7] The solid electrolyte must be a highly O2− conducting (∼0.01 S
cm−1) ceramic-based material, an electronic insulator, stable under reducing and
ox-idising atmospheres (i.e. cathode and anode conditions), mechanically strong and
used in most fuel cells is yttria-stabilised zirconia (YSZ).[14] The main drawback of
current SOFCs is their high operating temperature, ∼1000◦C, which can be attributed to the high temperatures required for oxygen diffusion in the electrolyte and the ORR
at the cathode. The cost of SOFCs is greatly increased because materials used for
in-terconnects must be stable at such temperatures; it also accelerates the rate at which
the performance of the device degrades. Therefore, it is of great interest to bring
down the operating temperatures of these fuel cells to the intermediate-temperature
(IT) range (600-800◦C) in order to reduce their cost and improve stability, durability,
performance and efficiency. Ceria (CeO2) doped with trivalent cations has been
sug-gested as a material which could replace YSZ as the solid electrolyte as it can achieve
ionic conductivities comparable to YSZ but in the IT range.[15] Samarium (Sm) and
gadolinium (Gd) are the dopants which have been seen to perform best with ceria as
SOFC electrolytes.[16, 17]
1.2
Solid oxide electrolysis cells
A solid oxide electrolysis cell (SOEC) is essentially a solid oxide fuel cell which operates
in reverse, electrolysing water (steam) to produce hydrogen gas, or CO2 to produce
CO, i.e. converting electrical energy to chemical energy.[18, 19] In this example we
will consider the electrolysis of water; steam reacts at the cathode (fuel electrode) with
electrons to produce H2 gas and O2− as shown in Equation 1.3.
2H2O + 4e− −→2H2+ 2O2− (1.3)
The oxide ions are then transported through an oxide ion conducting electrolyte to
the anode (oxygen electrode) where oxide ions combine to form O2 releasing electrons
in the process, as shown in Equation 1.4.
A schematic illustration of the operation of a SOEC is shown in Figure 1.2, with the
electrolysis of water to produce H2 gas shown as the example.
Figure 1.2: Schematic illustration of a solid oxide electrolysis cell. The fuel
con-sidered here is H2. Oxide ions are shown in red with hydrogen atoms shown in
blue.
The components are similar to those utilised in an SOFC, in that the most
com-mon fuel electrode is Ni-doped YSZ and LSM is the most comcom-mon oxygen electrode.
The electrolyte material is usually YSZ, with ceria-based electrolytes also utilised for
SOECs.[20] Ideally, there would exist a solid oxide reversible cell (SORC) which could
reversibly convert energy between fuel (i.e. hydrogen) and electricity. This would
al-low renewable energies such as solar or wind energy to be stored as fuel (SOEC mode)
when the supply is high (i.e. it is sunny/windy) and that fuel could then be used to
power the SOFC when demand for energy is high. This device would work well in the
context of a renewable energy grid as intermittent renewable sources are not always
available and a SORC would allow energy to be generated and stored when available
for use when required.[21] The primary issue facing SORCs is the behaviour of the
elec-trodes as both fuel and oxygen elecelec-trodes depending on what mode is operating.[21]
Nevertheless, developments in electrolytes for SOFCs and SOECs are applicable to
1.3
Electrolytes for SOCs
The work in this thesis focuses on solid oxide electrolyte materials for operation in the
IT range. Two such materials which have been suggested are trivalently doped ceria
(CeO2) and lanthanum gallate (LaGaO3) doped with strontium and magnesium.[15–
17, 22] These materials have been suggested as they both display ionic conductivities
comparable to, and in some cases higher than that of YSZ, but in the IT range.
YSZ and doped ceria both have a fluorite crystal structure while lanthanum gallate
takes a perovskite crystal structure. These will be discussed in further detail below. As
already stated the solid electrolyte utilised in solid oxide cells (SOCs) must display high
ionic conductivity, this is very important as the oxide ions must be transported across
the electrolyte with relative ease. They must also be electronically insulating - were
electronic conduction to occur in the electrolyte the SOC would be short-circuited, thus
rendered useless. The material must be stable under oxidising and reducing conditions
so that significant degradation does not occur at the electrodes. The material must
also be chemically and thermally compatible with the other components of the SOC
if it is not the cell will begin to crack and degrade quickly. In the following sections,
the fluorite-based and perovskite-based electrolytes will be discussed in some detail.
1.3.1
Fluorite electrolytes
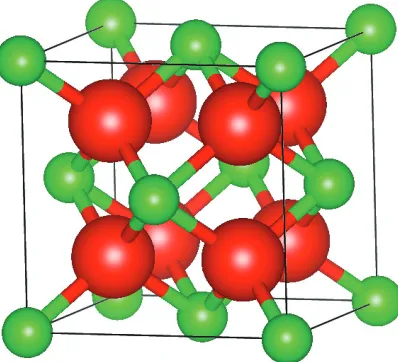
Solid oxide electrolytes usually have a fluorite-type crystal structure. The octahedral
hole sites are vacant in the fluorite structure which allows a lot of space in the crystal
for ion motion, making these systems suitable as solid electrolytes.[23] This can be
seen in the fluorite structure shown in Figure 1.3.
Doping of oxide-based fluorite structures with lower valent cations introduces oxygen
vacancies into the system via a charge compensation mechanism.[24] The process by
which oxygen vacancies occur is shown in Kr¨oger-Vink notation below.[25]
D2O3+ 2MxM+ O x
O −→2D
0
M+ V
r r
Figure 1.3: The fluorite unit cell, with space groupF m¯3m. Cations are shown in
green and anions are shown in red.
Where MO2 is the fluorite-based ceramic oxide and D2O3 is a dopant sesquioxide. In
Kr¨oger-Vink notation ’x’ indicates a charge of 0, prime (0) indicates a charge of -1
and ‘r’ indicates a charge of +1. The dopant cation (D) has an effective change of -1,
while the oxygen vacancy has an effective change of +2. This notation shows that for
every two tetravalent cations substituted with a trivalent cation an oxygen vacancy is
formed. The introduction of oxygen vacancies into the fluorite structure induces oxide
ion diffusion through a vacancy diffusion mechanism. So far this discussion implies
that the more vacancies there are in a system, the higher the conductivity will be,
however, this is not the case. Defect interactions (cation-vacancy, dopant-vacancy
and vacancy-vacancy) will impact the ionic conductivity of the system, often resulting
in reduced ionic conductivities at high dopant/vacancy concentrations. This will be
discussed further below.
1.3.1.1 CeO2
CeO2 is one of the most widely studied materials for SOFC electrolytes due to its
high thermal stability and ionic conductivity.[26–29] While pure CeO2 displays ionic
conductivity, due to intrinsic O vacancies,[30] it is very low at ∼ 3.13×10⁻³S cm−1.
to significantly increase ionic conductivity. In Kr¨oger–Vink notation, the doping of
CeO2 with a trivalent cation is given by:
2CexCe+ OxO+ M2O3 →2M
0
Ce+V
r r
O + 2CeO2 (1.6)
where Cex
Ce is a Ce4+ ion on a Ce lattice site, OxO is an O2
− ion at an O lattice
site, M0Ce is the trivalent dopant at a Ce lattice site with an effective charge of -1 and VOr r is a vacancy at an O lattice site with an effective charge of +2. X–ray diffraction results from several experimental studies have confirmed that such dopants
are readily taken into bulk CeO2.[17, 31–41] As seen in Equation 1.6, an O vacancy
is formed to compensate the charge created when two Ce(IV) atoms are replaced
with trivalent cations. These vacancies, hereafter referred to as charge compensating
vacancies (CCVs), act as pathways for the diffusion of O ions and hence increase ionic
conductivity.
When choosing dopants to increase the ionic conductivity, it has been found that
the greatest rise in ionic conductivity is observed for dopants that cause the least
distortion to the host lattice.[42] A study by Kim described the critical ionic
ra-dius (rc=1.038 ˚A for ceria) as the ionic radius of a dopant which will cause neither
expansion nor contraction of the host lattice.[43] Some of the highest reported
con-ductivities for doped CeO2 have been with gadolinium,[17, 31, 34, 35, 39, 40, 44–47]
which has been linked to the ionic radius of the Gd(III) ion (1.05 ˚A) being very close
to rc of CeO2.[48] The effect of dopants on the CeO2 lattice has also been
investi-gated computationally[49–51] with two important factors identified as to how trivalent
cations affect lattice distortions: firstly, the formation of the O vacancy; and
sec-ondly, the difference between the ionic radii of the host cation, Ce(IV), and the dopant
cations. The former causes a contraction in the lattice, due to electrostatic
interac-tions, whereas the latter leads to lattice expansion through steric effects. Marrocchelli
et al.[50] determined an ionic radius of a dopant for which the electrostatic and steric effects would cancel each other, 1.03 ˚A, which is consistent with the experimental value
the electrostatic effects dominate and the lattice contracts while for ionic radii larger
than 1.03 ˚A the steric effects dominate and the lattice expands.
Another method for increasing ionic conductivity in CeO2 is co–doping. The theory
is that by selecting one dopant with a radius less than rc and one whose radius is
greater, the expansion and contraction of the CeO2 lattice are balanced out and high
conductivities can be achieved. Examples of such co–dopant systems include lutetium
(0.98 ˚A) and neodymium (1.11 ˚A),[52] lanthanum (1.17 ˚A) and yttrium (1.02 ˚A),[38]
and gadolinium (1.05 ˚A) and yttrium (1.02 ˚A).[39] However, comparable increases in
ionic conductivities have also been observed for co–doped materials such as gadolinium
(1.05 ˚A) and bismuth (1.16 ˚A),[31] samarium (1.08 ˚A) and neodymium (1.11 ˚A),[53, 54]
and gadolinium (1.05 ˚A) and praseodymium (1.13 ˚A).[55] These examples, in which all
the radii are greater than rc, would suggest the increased ionic conductivity arising
from co–doping is not just due to the counteracting expansive and contractive forces.
Burabno et al. carried out molecular dynamics simulations on a range of co–doped
materials and suggested that co–doping simply produced the average ionic conductivity
of the parent singly doped compounds.[54]
The defect interactions in doped ceria (i.e. cation-cation, cation-vacancy and
vacancy-vacancy interactions) have been found to be of great importance when considering
dopant concentrations for trivalently doped ceria. Generally, a conductivity profile
is found where beyond a particular dopant/vacancy concentration the conductivity
beings to drop. Maximum dopant concentrations are usually found to be in the range
of 10-20% dopant substitution, corresponding to a vacancy concentration of 2.5-5%.
This is lower than would be expected, as it is known that the vacancies are charge
carriers and so it is presumed that the more vacancies in the system the higher the ionic
conductivity. It is the defect interactions in doped ceria which dominate this process,
and it has been suggested that dopant-vacancy association and vacancy-ordering is
1.3.2
Perovskite electrolytes
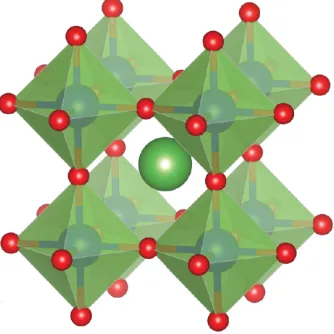
The perovskite oxide crystal structure has an ABO3 structure where A and B are
cations and O is the oxide ion. The cubic perovskite crystal structure is shown in
Figure 1.4, with the A-site shown in green, the B-site in blue and the oxide ions in
red. The ABO3 (P m¯3m) perovskite structure has the larger A-site cation at a
12-coordinate site, with the smaller B-site cations 12-coordinated in octahedra to oxide ions.
[image:36.596.194.361.282.449.2]The perovskite structure is known to show high mobility of oxygen vacancies.[58]
Figure 1.4: The cubic perovskite (ABO3) crystal structure with space group
P m¯3m. The A-site cation is shown in green, B-site in blue and oxide ions in red.
1.3.2.1 LaGaO3
LaGaO3 is a perovskite-structured material with La3+ on the A-site and Ga3+ on the
B-site. It has an orthorhombic (P bnm) perovskite structure up to 423 K and takes a
rhombohedral structure thereafter.[59] The orthorhombic structure is defined by tilting
of the GaO6octahedra with respect to the cubic structure. These structures are shown
Figure 1.5: (a) Orthorhombic (P bnm) and (b) rhombohedral (R¯3c) structures of
LaGaO3.
LaGaO3 doped with Sr2+ on the A-site and Mg2+ on the B-site (LSGM,
La1−xSrxGa1−yMgyO3−(x+y)/2) is a perovskite oxide ion conductor which has been
sug-gested as an electrolyte for solid oxide cells.[22, 60] LSGM has shown oxide ion
conduc-tivity above that of YSZ and doped ceria at intermediate temperatures, negligible
elec-tronic conduction and good stability over a wide range of oxygen partial pressures.[61]
As for doped ceria and zirconia, the conductivity mechanism is a vacancy mechanism.
Oxygen vacancies are introduced through the doping of the A- and B-sites with lower
valence cations, as shown in Kr¨oger-Vink notation below.
2SrO + 2LaxLa+ OxO−→2SrLa0 + VOr r+ La2O3 (1.7)
2MgO + 2GaxGa + OxO−→2MgGa0 + VOr r+ Ga2O3 (1.8)
The introduction of two dopants results in one vacancy for both the A- and B-sites.
The dopant concentration at which the maximum in ionic conductivity is observed
varies from x= 0.10−0.20 and y= 0.15−0.20 in La1−xSrxGa1−yMgyO3−(x+y)/2.[62]
1.3.3
Defects in solid oxide electrolytes
When considering the behaviour of solid oxide electrolytes the impact of defects is
defects govern the behaviour of these materials. Figure 1.6 shows the defects which
can be present in solid oxide electrolyte materials according to their dimension.
Va-cancies and dopants are seen to be zero-dimensional defects, these are the defects most
frequently studied in solid oxide electrolytes, and they must be present in order for
oxide ion conduction to occur. Considerably less is known about the extended defects
in solid oxide electrolytes. As nanostructuring of these materials is becoming more
prevalent, the behaviour of extended defects such as surfaces and grain boundaries is
becoming more important.[63, 64]
Figure 1.6: Defects which can be present in solid oxide electrolytes arranged
ac-cording to their dimension.
1.4
Interfaces in SOC electrolytes
The modelling of solid oxide electrolyte materials is often confined to bulk systems
which contain point defects.[54, 56, 65, 66] There is considerably less known about the
impact of extended defects such as surfaces and grain boundaries on these materials.
In reality, oxide ion conductors are polycrystalline, meaning that they contain grain
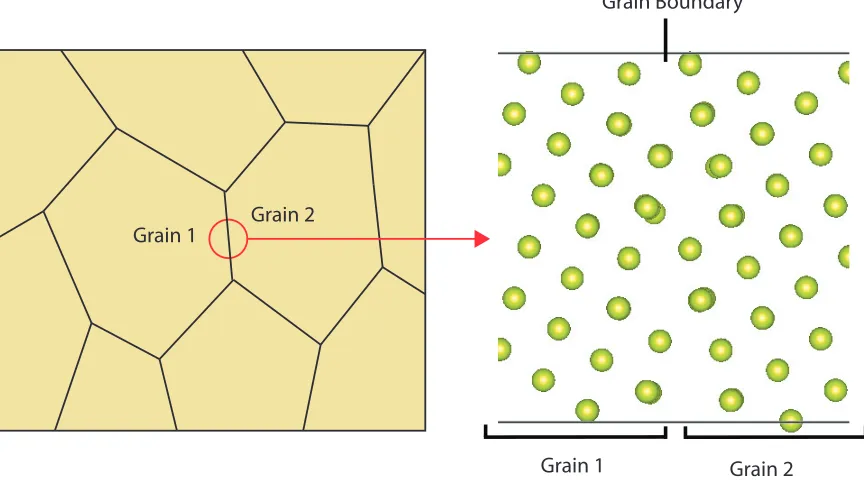
boundaries within the materials. These grain boundaries give rise to structural
dis-continuities within the material which control the macroscopic properties such as ionic
conduction, thermal expansion, elasticity, and strength - all of which are important
these materials is key to the optimisation of performance in these materials.
Experi-mental studies of grain boundaries in these materials are usually based on the average
effect observed using impedance spectroscopy, where all grain boundaries are treated
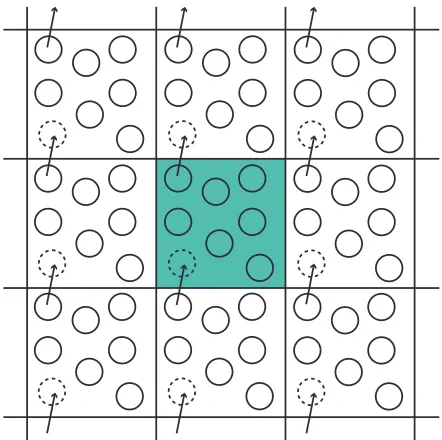
equally as an average effect.[16, 67] In fact, grain boundaries can take on specific
struc-tures, an example of this is shown in Figure 1.7; the left-hand side of the image shows
a polycrystalline material with the two of the grains marked while the right-hand side
of the image shows a grain boundary which has a specific structure associated with it.
Grain Boundary
Grain 1 Grain 2
[image:39.596.105.537.258.498.2]Grain 1 Grain 2
Figure 1.7: A schematic illustration of a polycrystalline material showing the
specific structure of a grain boundary.
The simulation of these interfaces would allow the effects of different specific interfaces
to be examined, thereby increasing the understanding of the impact of interfaces in
polycrystalline solid oxide electrolytes. This enhanced understanding of interfaces in
materials is necessary to fully optimise the design of devices to improve oxide ion
conduction in the IT range.
1.5
Thesis outline
The remainder of this thesis is structured as follows; in Chapter 2 the theoretical
are introduced followed by a description of Hartree-Fock theory, DFT, DFT+U and hybrid DFT. This is followed by a discussion of interaction potentials including a
de-tailed description of the interatomic potential (IP) used primarily in this work, the
Dipole Polarisable Ion Model (DIPPIM). In Chapter 3 the computational
methodol-ogy is outlined and explained in detail. This begins with a discussion of the principles
on which the DFT calculations carried out in this thesis are based. The electronic
density of states and band structure, which can be obtained from DFT calculations,
are described as methods of analysing electronic structure data. Many of the concepts
on which molecular dynamics is based are described; including the algorithms used for
the advancement of time and the thermodynamic ensembles used. Methods of analysis
frequently used for molecular dynamics data are also discussed, such as mean squared
displacements and radial distribution functions. Also in Chapter 3, the generation of
surface slabs and grain boundaries for simulation, is described.
Chapter 4 considers the effect of a range of trivalent dopants (Al, Ga, Sc, Sb, In, Lu,
Tl, Yb, Tm, Er, Ho, Y, Dy, Tb, Gd, Eu, Sm, Nd, Pr, Bi, and La) on structure and
reducibility of CeO2, using density functional theory. These are key properties which
should be considered in an oxide ion conducting electrolyte; the local defect structure
will have an impact on the oxide ion conductivity of the material, and the reducibility
is important in the context of electronic conduction. If electronic conduction occurs in
the electrolyte of an SOFC or SOEC the cell will short circuit and thus will be rendered
useless, therefore, the reduction of Ce4+ to Ce3+ is undesirable. Different dopants will
impact the local defect structure and the reducibility of ceria differently, and so with
this work, we aim to elucidate which dopants are best suited for solid oxide electrolyte
applications.
A direct study of the diffusion and dynamics in doped ceria requires large cells, meaning
molecular dynamics in conjunction with interatomic potentials must be utilised. In
Chapter 5 we consider the effect of polarisability in the modelling of doped ceria. It is
well known that the oxide ion is highly polarisable; however, the inclusion of the effects
of this polarisability can be computationally expensive. Therefore, we investigate
modelling doped ceria. This is done by considering two interatomic potential models
which are both derived from the same ab initio data, where one is a rigid ion model,
and the other a dipole polarisable ion model.
In Chapter 6 the effects of surfaces and strain on ionic conduction are discussed, as
much work has focused on the optimisation of defect interactions in doped ceria and
so it is necessary to consider different routes to optimisation. The effect of different
specific surface terminations across a range of stabilities is investigated for doped ceria.
The impact of strain on thin films has been debated, with moderate to no enhancement
in ionic conductivity observed for doped ceria. Here, we study the effect of a range of
tensile strains across multiple surface terminations.
In Chapter 7 the effect of interfaces, such as grain boundaries, on the oxide ion
conduc-tivity in these materials is considered. These interfaces are essential to the performance
of doped ceria as solid oxide electrolytes. It is well known that the microstructure has
a significant impact on many material properties such as strength, thermal expansion
and ionic conductivity. It has been suggested that the grain boundaries in these
ma-terials can result in reduced oxide ion conductivity; however, the majority of studies
consider only the average effect of the interface and not the possible effects of
dif-ferent specifically defined interfaces. Here we discuss the effect of specific tilt grain
boundaries on the performance of doped ceria as an oxide ion conductor.
In Chapter 8 the process of deriving a polarisable IP based onab initiodata is discussed in detail. This process is then applied to the development of an IP for pure and doped
LaGaO3. Finally, in Chapter 9 the conclusions of the work carried out in this thesis
Theoretical background
2.1
Introduction
With the advent of high-performance computing came the ability of computational
chemistry to describe the properties of chemical systems with greater speed, detail
and accuracy than ever before. This computational power allows greater insight into
experimental observations to be gained, and the prediction of the properties and
be-haviour of materials which have yet to be synthesised or even discovered. The methods
utilised depend on the property and size of the system which is being investigated, and
the choice of method is key to the accurate representation of chemical and physical
properties of the material of interest.
Two methods which are widely used in the study of solid-state materials are quantum
mechanical methods and interatomic potential (IP) methods. Quantum mechanical
methods are best suited to the study of electronic properties, such as band structure,
density of states and charge distributions, of relatively small systems whereas IP
meth-ods do not explicitly consider electrons and are suitable for the study of the physical
movement of atoms or ions and their associated properties, such as structure, ionic
con-ductivity and activation energy of ion motion, in large systems. Both methods, used
in conjunction with one another, are key to the multi-scale simulation of properties of
materials and their specific applications.
Both of these methods are utilised in this thesis, and their underlying theories are
outlined in this chapter. In section 2.2 fundamental principles of quantum chemistry
are examined, followed by a discussion of some of the ab initio methods which are
derived from quantum chemistry. In section 2.3 the basic principles of IP methods
are discussed including the treatment of long range and short range interactions using
these methods.
2.2
Quantum chemistry
2.2.1
The Schr¨
odinger eqauation
The Schr¨odinger equation is fundamental to quantum chemistry as it describes the
quantum mechanical behaviour of a chemical system. In its time-independent form, as
presented in Equation 2.1, the Schr¨odinger equation allows us to obtain information
about the stationary states of a quantum system, also known as the orbitals in the
case of atoms, molecules and electrons.
ˆ
HΨ =EΨ (2.1)
In Equation 2.1 each quantum state is described by an eigenvector, the wave function
(Ψ) and its corresponding eigenvalue, the total energy (E). The Hamiltonian operator
( ˆH) is the sum of the kinetic and potential energy operators as shown in Equations
2.2 and 2.3.
ˆ
H =−~
2
2m∇
2+V(r) (2.2)
∇2 =
∂2 ∂x2,
∂2 ∂y2,
∂2 ∂z2
(2.3)
Where~= 2hπ,mis the mass of the particle,∇2 is the three dimensional kinetic energy
operator and V(r) is the configurationally dependent potential energy of the particle.
The Hamiltonian operator can be separated into electronic (e) and nuclear components
(N) of kinetic ( ˆT) and potential energy ( ˆV).
ˆ
which is equivalent to (in atomic units)
ˆ
H =X
A
1 2MA
∇2−
n X i 1 2∇ 2 i + N X A<B
ZAZB
rAB − M X A n X i ZA riA + n X i>j 1 rij (2.5)
whereA andB are nuclei, iandj are electrons,Z is nuclear charge and M is mass. It
is not possible to solve the Schr¨odinger equation analytically for a system containing
more than one electron, as it is a form of what is known as the three-body problem;
therefore the introduction of approximations is necessary for systems containing more
than one electron.
2.2.2
The Born-Oppenheimer approximation
The first approximation usually made when seeking to solve the Schr¨odinger equation
is the Born-Oppenheimer approximation, this separates the nuclear and electron wave
functions through the Hamiltonian operator. The basis of the approximation is that
the nuclei are so large, relative the to the mass of the electrons, they can be treated
as having fixed positions allowing their kinetic energy term, ˆTN, to be excluded. The
potential energy of the nuclear-nuclear interaction, ˆVN N need only be calculated once
for each configuration of nuclei. This results in a simplified electronic Hamiltonian,
( ˆHe), given in Equation 2.6.
ˆ
He = ˆTe+ ˆVeN + ˆVee (2.6)
Despite this simplification of the Hamiltonian, the problem is still many-body in
na-ture, and the calculation of the electron-electron potential energy ( ˆVee) is the biggest
challenge. Two methods which have been developed to calculate the electron-electron
2.2.3
The Hartree model
The Hartree model simplifies the multi-electron problem by ignoring electron-electron
interactions and instead considering a one-electron Hamiltonian (h(i)), given by
Equa-tion 2.7.
h(i) = −1
2∇
2
i + M
X
A
1
riA
(2.7)
ˆ
H =
N
X
i
h(i) (2.8)
This results in a one-electron form of the Schr¨odinger equation with spin orbitalsχj(xi)
occupied by electron i with energy given asεj(xi).
h(i)χj(xi) = εjχj(xi) (2.9)
The resulting wave function can then be represented as a product of the one electron
spin orbitals, known as the Hartree product (ΨHP)
ΨHP =χi(x1)χj(x2)χk(x3)...χη(xN) (2.10)
with the energy of the system given by a sum of the spin-orbital eigenvalues
hΨ|Hˆ|Ψi=εi+εj +εk...+εη =E (2.11)
2.2.4
Hartree’s self-consistent field model
There are two primary limitations to the Hartree model; firstly, this is an independent
electron model wherein electron repulsion is ignored. This is solved by the
introduc-tion of Hartree’s self-consistent-field (SCF) model,[68–70] which treats an electron as
though it is moving in an average field generated by the nuclei and all other electrons
in the system. The field that is created is determined by the form of the wave
func-tion which is unknown until the equafunc-tions have been solved, this is overcome by the
a new wave function which will change the elec