A Data Analytics System for the
Brazilian Electricity Sector
Ramon L. Marques, Leandro B. Oliveira, Lu´ıs A. B. O. Leite, Gisele L. Pappa and Renato Ferreira .
Abstract—This paper introduces SIASE, a data analytics system proposed by the Brazilian Electricity Regulatory Agency to receive, store, process and analyze data coming from the 93 electric utilities in the country. The system is able to receive more than 80 million records per month, and process this data for updating the electricity price change processes and data analytics for decision making. Here we focus on the system architecture and implementation, which need to deal with very dynamic information, together with the proposed architecture for the electricity price and data analytics model.
Index Terms—information system, electricity sector, big data.
I. INTRODUCTION
Electric utilities are the companies responsible for con-necting and supplying energy to any type of consumer, including home users and the second sector. As the fifth most populated nation in the world, Brazil had, in 2008, 61.5 million consumer unities, 85% of which were home consumers [1]. In 2018 this number grew to almost 83 million [2], a 34% growth in 10 years. These consumers have their energy currently supplied by 93 companies that operate in the Brazilian electricity system. The rights and duties of these companies are established in a concession agreement with the State for the public service exploration in a concession area — which corresponds to the geographic area where each electric utility has the electricity supplying monopoly.
The fulfillment of the concession agreements are strictly regulated by ANEEL (Brazilian Electricity Regulatory Agency). The purpose of the agency, created in the 90’s when the sector was privatized [3], is on one hand to guarantee the consumer pays a fair value and has access to a continuous electricity service of quality and, on the other, to guarantee electric utilities the economic-financial balance necessary to comply with the concession agreement.
There is, however, a plan for restructuring the Brazil-ian electricity sector in the next years. According to [4], the general guidelines for this restructuring is to have a reasonable number of similar size companies to create an energy wholesale market, and to separate the generation, transmission, distribution and commercialization activities in order to improve competition.
In this distributed scenario, the regulatory agency needs to receive a lot of information from these companies to control and plan the sector in the country. However, ANEEL
Manuscript received June 29, 2018; revised August 07, 2018. This work was supported by and strategic R&D project from ANEEL, coordinated by iAbradee (Instituto Abradee de Energia) together with 25 electric utilties.
R. L. Marques, L. B. Oliveira and L. A. B. O. Leite are with Axxiom Soluc¸˜oes Tecnol´ogicas, Belo Horizonte Brazil {ramon.marques, leandro.oliveira,luis.leite}@axxiom.com.br
G. L Pappa and R. A. C. Ferreira are with the Computer Science Department, UFMG, Brazil{glpappa,renato}@dcc.ufmg.br.
still does not take full advantage of this data to improve its processes and decision making. For example, commer-cial electricity losses due to irregularities (energy theft and measurement errors) reach up to R$ 5 billion losses a year in Brazil, which is around 5% of the total amount spent in energy consumption [5]. Electricity bills are, in some cases, up to 17% more expensive to compensate for energy thefts and other fraudulent practices [6]. This kind of information is of social interest, and the information coming from the electric utilities is crucial for identifying these scenarios, besides being useful for the definition of public policies.
In parallel, the Brazilian Information Access Law (law 12.527/2011) [7] deals with the access to information pro-duced by private entities arising from the link with the public administration. This law applies to the electric utilities, and provides the standards of data and how to provide easy access to them over the internet, allowing data recording and exportation. Nowadays one of the most required information by consumers and research institutions concerns the market and electricity prices.
In order to comply with the law and also make electric utilities data available to aid ANEEL in strategic decisions, the data received from these companies needs to be organized and further analyzed. Acquiring a commercial software to deal with that was ANEEL first choice. However, the agency knew it would be difficult to find a commercial solution that achieved all the system requirements, which included being capable of adapting to the processes and needs of the organization without software maintenance.
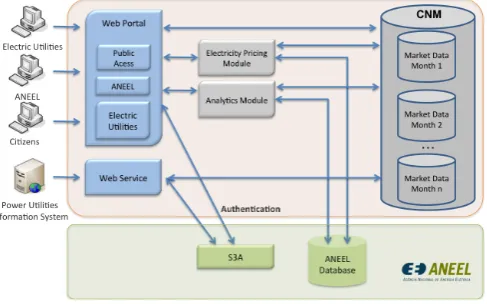
Fig. 1. Overview of the system.
sophisticated operations.
II. RELATEDWORK
The era of big data has been changing the way electric utilities and other companies make strategic decisions and deal with consumers [8]. In the electric sector, finding software that can supply the diverse and dynamic nature of processes and data is not straightforward. In this direction, this section reviews a few works that have described how they build different types of information systems, with a growing focus on data analytics for decision support.
The authors in [9] proposed a methodology to provide concise information regarding power consumed for each con-sumer and transformer, to check electricity theft in distribu-tion networks, to remotely monitor supply and consumpdistribu-tion of electricity through a wireless network, to localize electric-ity information and hence compare energy supplied to bills issued. They created an online database that keeps track of energy consumed for each consumer, an application hosting and development platform (Platform as a Service) specially designed for projects related to the Internet of Things (IoT) and Machine to Machine (M2M). The methodology enables data collection from connected objects (the things part), store it, build powerful applications with few lines of code and allows integration with external Industrial Training (IT) systems (the internet part).
In [10] the authors proposed an information system for organizational strategic planning for the public electric utility company in Mexico, Federal Electricity Commission (CFE). The system was developed on the Lotus Notes/Domino platform and integrates data from its multiple areas to provide data for all the interconnected systems developed. This enables tracking and managing information about strategic planning, metrics generation (goals, strategies and measures) and the creation and deployment of strategic dashboards. The system supports the decision-making process for the company Senior Management.
The system proposed here has the same purpose as the one proposed in [10], but it is Web-based, gives information to different stakeholders and allows for easily pricing update and data analytics.
III. METHODOLOGY
This section describes the methodology followed by SIASE to receive, process and store the data sent by the
93 electric utilities in Brazil. Figure 1 shows an overview of the system. As already mentioned, the system is Web-based, and gives data access to three stakeholders: the electric utilities, ANEEL and the common citizens, which can also require data to the system. The stakeholders have access to two types of information. The first regards the data used in the methodology for establishing the electricity price. The second is an data analytics module, which provides information about energy consumption at a macro level, and allows the user to combine this data with any additional information he/she might want to upload to the system.
Using the Web portal, the energy utilities can send their monthly data to , or they can also send the data directly through a Web service. Note that this data is sent per consumer unity. As previously mentioned, the data required can change over time, and its format is defined by ANEEL. ANEEL, in turn, uses the Web portal to approve the infor-mation sent by the electric utilities. Once data is approved, it is make available for the pricing and data analytics modules, and are also stored in the CNM database. This database is the one that stores all electric utility data over time. Regarding citizens, they have access to a bill simulator on the website, which can show the impact of any price changes in their electricity bill. All types of users have access to the analytics module, which allows the generation of different types of analyses and reports.
This section describes the proposed data model and its implementation, and the electricity pricing and data analytics modules. The electricity pricing module can only be accessed by ANEEL, and is used to generate the rules used to update the prices of electricity. These rules are implemented using a set of equations, which are later used to calculate the new pricing for each electric utility. We start by describing the ANEEL requirements, which had a great impact on the system proposed.
A. ANEEL Requirements
This section describes the six requirements the agency listed to the system: (i) use all the technologies already in place inside the agency; (ii) because of requirement (i), the database should be relational, more specifically run on Microsoft SQL Server; (iii) be able to dynamically change the set of data demanded from electric utilities, without relying on software maintenance; (iv) develop a cloud-based solution hosted outside the agency structure, but placed in national territory, (v) flexibility and (vi) scalability. From the above requirements, the use of a relational database was the major limitation to a range of viable solutions.
B. Data Model
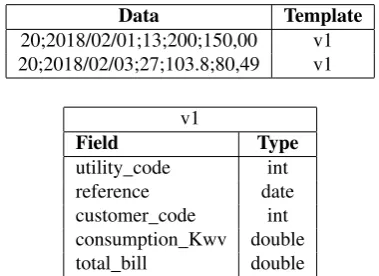
Data Template 20;2018/02/01;13;200;150,00 v1 20;2018/02/03;27;103.8;80,49 v1
v1
Field Type
utility code int
reference date
[image:3.595.74.264.51.189.2]customer code int consumption Kwv double total bill double
Fig. 2. Self-describing data model using template v1.
the data description of the model, its sequence and types. Figure 2 shows one of the templates (v1) that can be created, together with a data sample.
This model makes it straightforward for ANEEL to change the data and meta-data describing the information received from the distributors using most of the mechanisms of a relational database. Another advantage of the model is to store the data in a way that it can be easily processed by the data analytics module. Note that this model also allows us to use an hybrid structure, where some fields are kept physically as columns in the table and other fields are dynamic.
In order to manage the template files, a template state manager was implemented. A template can be in one out of three states: (i) active, (ii) inactive; (iii) discontinued. At at moment in time, there must be a single active template for data upload. Inactive templates are being edited or where configured to change to an active status in the near feature. Discontinued templates, in turn, were once active and replaced by a new template. These templates can not be removed from the system, as they guarantee data integrity of previously received data.
1) Model Implementation: The data model described can be implemented using a non-structured or a hybrid model. In the non-structured model, a table has basically two columns: one to store all data concatenated by a semicolon and other to refer to a template. In the hybrid model, an n-columns table is developed with separate columns to fixed fields, one column to dynamic data concatenated by a semicolon and a last column to refer to the template that describes the data. Developing the hybrid model was possible because the meta-data requiring information from the electric utilities always has a set of fixed fields (e.g., customer id, activity type) and another set of data that can be requested depending on the situation. The template defines the fields that are fixed and those that are dynamic.
Regardless of the model we chose to use, there are two operations that have relevant execution times to the system: data insertion and data search. Regarding data insertion, three different approaches were tested in the two types of models. The first approach inserted the market data in masses of 1,000 records at a time, with a single transaction opened in the database. In this case, the insert commands are executed individually. This kind of load brings a lot of costs to execute each insert, for example, serialization, network transfer and deserialization.
One way to fix this problem is the insertion of the market data uploaded file by a BLOB (Binary Large OBject) typed
Fig. 3. Data flow into the system.
column in the database. However, all search (and filter) executed in this table will need to analyze the whole data in this column. Another approach would be to use a BULK INSERT statement from the SQL Server. This statement is able to interact with the Bulk Copy Program, a tool available in SQL Server able to import bulks of data from a file to a table via script. In this case, when a electric utility submits the market records to the system, it receives the file, generates a new and unique file containing all the information needed, and run a BULK INSERT statement.
These three alternatives were tested (see Section IV.A), and the results showed the bulk insert to be the most efficient considering both insertion and search operations.
C. System’s Data Flow
One of the most important functionality of SIASE is to receive, validate and store the electricity market data from the 93 electric utilities in Brazil. Figure 3 shows how this process happens. Once the electric utility uploads data into the system, there is first a validation phase. The validation simply checks the number of data fields submitted, their order, types and ranges according to the active data template. After validation, data is stored in the CNM database.
However, to be used by the price calculation modules, the data needs to be aggregated. This is because the pricing rules are defined over values of aggregated and not individual fields. Aggregations operations predefined are sum, average, count, maximum and minimum. It is also performed consid-ering a template file, which describes the fields that will be used to generate aggregated views of data. These fields may include, for instance, city, customer type or activity type.
D. Electricity Pricing Module
Price updates are made once a year for each electric utility to keep the economic balance of the companies. The regulatory agency often needs to change the rules of the price calculation methodology. Because of that, the system needs to have all the business rules built and customized by the user. To make this work, we proposed a language to write the pricing rules as well as the language interpreter.
[image:3.595.315.533.53.161.2]Fig. 4. Screen capture of the system’s pricing rule ’.
1) Electricity Price Calculation Language (EPCL): EPCL is a language created to write formulas, composed by a set of 33 functions. The predefined functions available in EPCL allow mathematical and logical operations, statistical compu-tations, data type conversions, as well as date manipulations. The formulas created are assigned to variables, which are organized in a tree. A tree corresponds to a pricing rule and the tree root variable returns the final price.
The language’s syntax comprises numerical and textual constants, data arrays, arithmetic operators, functions that return values and may take arguments, and structures called fields. Fields allow access to other variables of the rule being created and to query data contained in tables of the system database. EPCL also has operators for data querying operations, like table row filtering and table column insertion and selection. Since the system was conceived to be used by employees of ANEEL and the Brazilian electric utilities, in EPCL function names are in Portuguese and comma is the decimal separator.
Numerical constants include integer and real numbers. Textual literals are delimited by single quotes, and arrays are represented by a list of expressions separated by semicolons and placed between braces. Functions are called by their names followed by a list of semicolon-separated arguments between parentheses.
Figure 4 shows a screen capture of a part of the systems pricing rule editor. The panel on the right exhibits the list of variables of the currently edited rule. The name of the currently edited variable is displayed on the top left, whereas its formula is shown at the center of the screen.
2) Price Calculation: Having defined a price calculation rule, the price calculation itself consists in evaluating the associated pricing rule. A price calculation requires two fundamental parameters that set the conditions to the process: the concession area and the month/year date for which the price must be calculated. From there, all the queries to data source and market tables are implicitly filtered by these two parameters, although it is possible to explicitly retrieve data associated with previous and future months.
[image:4.595.306.547.227.332.2]The first step performed for price calculation is the parsing of the formulas in the variables that compose the pricing rule being evaluated. During the parsing step, the formulas syntax and semantic are checked and a parse tree is generated. In a second phase, that tree is traversed with depth-first search (DFS) in order to build a summary of all the tables referenced by the rule’s variables. That summary is required to perform a single access to the system’s database, whose output data fill in an in-memory cache that provides fast data querying in
Fig. 5. Data analytics system screen.
Fig. 6. Data analystics module architecture.
the following step. Finally, the parse tree is DFS traversed one last time and the variables are numerically evaluated, with arithmetic expressions being computed, functions being called and fields being resolved using the data in the in-memory cache. At the end of the traversal, the root variable supplies the requested price.
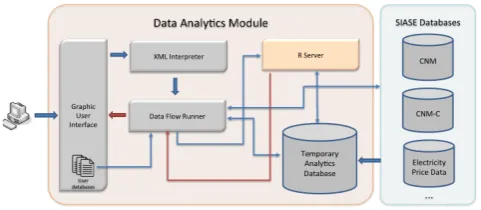
E. Data Analytics Module
The second module of SIASE is the data analytics, which can be accessed by all stakeholders and allows for a diverse range of data analyses. Figure 5 shows a screen shot of the data analytics module. On the left hand side, we have a menu with all the operations available, which include database operations, such as projection, filtering and joins, as well as running machine learning algorithms for classification, clus-tering, regression or outlier detection. On the right hand side, we have a working space area where the user can create a new data analysis flow by dragging, dropping and connecting the operations available. The user interface is inspired in the concept of visual programming. In the example, note that the user chooses the CndC database, from where it filters a set of attributes and runs the clustering k-means algorithm. After that, the user can export the results. Each of the components used in the data analytics flow have a set of parameters, which can be configured by the user. For example, the filter component requires the user to list the attributes used for filtering.
TABLE I
TIMES FOR DIFFERENT SYSTEM OPERATIONS.
Operation CSV XML
Upload 00:03:22 00:13:14
Reading 00:02:00 00:58:40
Validation 00:31:26 01:28:06
Insertion - Non-structured tablevia:
Record Mass 13:00:00
Bulk Insert 00:09:14
BLOB 00:02:35
Insertion - Hybrid tablevia:
Bulk Insert 00:17:54
Searching
Non-structured table 00:04:35
Hybrid table 00:02:50
Consolidation
Grouped search by record 00:08:30
Grouped search by BLOB 00:12:00
Market aggregation 00:01:10
sequence. SQL commands are run in the database, while machine learning algorithms are implemented in R, and have their codes executed in a R server. In both cases, the results of these operations are saved in a temporary database. Consider, for example, the data analysis flow shown in Figure 5. The filter component has as input the CnmC database. After executing a SQL command in the CnmC database, the results of the operations are stored in the temporary database. This new database is given as input to K-means, and its output exported in a file, which can save the output of the algorithm or different forms of visualization, according to the parameters of the component.
IV. EXPERIMENTS
This section presents experimental results proposed to validate the developed system.
A. Data model benchmarks
As a way to validate the proposed architecture, we tried to simulate real data conditions. ANEEL receives data from the 93 electric utilities once a month. The electric utility with the biggest number of consumer unities was selected as our worst case scenario. This company had almost 8,800,000 consumer unities, which corresponds to almost 11% of total consumer market from the electricity sector in Brazil. Each record is described by 134 fields regarding customers information.
All experiments considered this database and were per-formed using an application server with two cores (1.5 GHz) and 8 GB of memory; and a single core (2.5 GHz) database server with 8 GB of memory running SQL Server 2014. Both servers were running Windows Server 2012.
We start the benchmark by uploading a compressed file (.zip format) with a CVS (365MB) and an XML (1.4GB) version of the market for the chosen company. After upload, the data validation phase starts (see Figure 3). This phase uses the template meta-data current active to check the data validity. However, before validating the data, it has to be read from the uploaded file. Table I shows the times of all operations tested in this section.
Due the size of the original file, considering upload and validation times, CSV was chosen as the market file format for the system. After sending and validating data market, three approaches were used to simulate insertion of market data into non-structured and hybrid tables.
The insertion times are also reported in Table I, and show a big advantage to store BLOB objects into the database. However, as previously discussed, all search and filter in these objects become inefficient, as the whole mass needs to be considered during search. The chosen alternative was then the bulk insert, which when used together with a hybrid table, has an insertion time of 00:17:54.
The last step in the data flow before approval is market consolidation. This operation summarizes and aggregates data of each market based on a consolidation template defined by , which groups and aggregates fields from market data. All consolidated data are also stored in a hybrid table. Data consolidation involving extracting, grouping and ag-gregating data records. Two different group data extractions strategies were tested: record data and BLOB. Note that grouped search by record is faster (8m30s versus 12m for group search by BLOB). After that, data were aggregated according to the consolidation meta-data template. Then, the results were stored one-by-one in the database. As an example, concerning the case of our biggest company with the 8,800,000 records, they were reduced to almost 31,000 records after the aggregation process (which used three variables as filters).
B. Price calculation language usage
This section shows some examples of the EPCL language developed to create pricing rules. We start with the simple function MEDIA (MEAN in Portuguese), which calculates the mean value of the numbers of the array passed as argu-ment. It can be written asM EDIA({12,614;−1,85; 7,5}), where it returns the value 6.088. If an expression needs to be used multiple times, it can be assigned to a variable. For instance, the array{12,614;−1,85; 7,5} can be stored in a variable called VEC.
Equation 1 illustrates the use of relational comparison operators and textual literals. In the equation, the function SE (IF in Portuguese) takes three arguments, evaluates the first – which is a comparison expression – and returns either the textual value ‘mean ≥1’, if the mean of the elements of VEC is greater than 1, or ‘mean <1’, otherwise. In the equation, notice that the variable VEC is accessed by putting its name between square brackets.
SE(M EDIA([V EC])>= 1; ‘mean ≥ 10; ‘mean < 10) (1)
The following example shows some of the operators that EPCL offers for manipulating tables. System tables have reserved names that allow them to be differentiated from variables. Fields that deal with system database tables return values of type table. Table II shows a sample of the system’s consolidated market table and presents consumption data of the three customers in a fictional concession area for the months of February, March and April of 2018. Consider the formula in Equation 2 is assigned to a variable of a pricing rule, where CNMC is the reserved name for the system’s consolidated market table. If a price calculation is performed for the fictional concession area for the month of April of 2018, the formula in Equation 2 will return a new table containing only the rows related to the month of April of 2018, which corresponds to line ids 7, 8 and 9 in Table II.
TABLE II
SAMPLE DATA OF A CONSOLIDATED MARKET.
Id REF DATE CUSTOMER CODE CONSUMPTION
1 02/2018 88297 321.8
2 02/2018 0341 129.7
3 02/2018 2394 97.1
4 03/2018 8829 310.7
5 03/2018 0341 131.2
6 03/2018 2394 102.7
7 04/2018 8829 353.4
8 04/2018 0341 118.3
9 04/2018 2394 75.0
TABLE III
RESULTING TABLE FOR BILL CALCULATION(EQUATION3).
CUSTOMER CODE BILL VALUE
8829 282.72
0341 96.64
Let us give another example of things that can be done with EPCL. Let us say we want to calculate the total bill for the customers who consumed more than 100kWh in the month of April, assuming the bill value equals the consumption multiplied by 0.8, which is the energy cost (kWh). The formula in Equation 3 can do that, returning the values shown in Table III. The operator ‘pipe’ filters CNMC rows where column CONSUMPTION is greater than 100. Then, the operator ‘&’ inserts in the resulting table a column called BILL VALUE, whose values are equal the CONSUMPTION column values multiplied by 0.8. Finally, operator ‘?’ preserves only columns CUSTOMER CODE and BILL VALUE in the final table.
[CN M C|.‘CON SU M P T ION0>100
&.‘CON SU M P T ION0∗0,8 : ‘BILL V ALU E0
?{‘CU ST OM ER CODE0; ‘BILL V ALU E0}] (3)
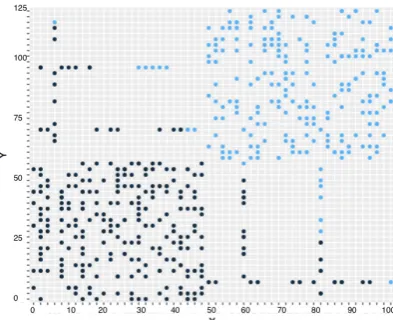
C. Data Analytics example
[image:6.595.71.268.600.760.2]The data analytics module was conceived to allow a wide range of analysis to be performed, from fraud detection to understanding how the prices grew in the past years. As an example of how the data analytics can be used, consider again the data analysis flow shown in Figure 5. The objective of this flow was to group home consumers in a specific neighborhood according to their consumption profile. The filter component of the flow filtered users with the
Fig. 7. Result of k-means algorithm for groups of customers.
characteristics aforementioned. This group was consumers was given as input to the k-means clustering algorithm, and his number of clusters set as two. The data exportation component generated the graph showed in Figure 7. If the number of dimensions of the data is greater than 3, the system provides dimensionality reduction methods, such as Principal Component Analysis, which can be used for visualization purposes. In this case, the color of each point corresponds to the cluster it is closer to according to the Euclidean distance.
V. CONCLUSIONS
This paper introduced SIASE, a system proposed by ANEEL to integrate data from all 93 energy utilities in Brazil. The system has two main modules: electricity pricing and data analytics. The first allows ANEEL to dynamic define business rules that will influence changes in electricity price. The second is available for very different stakeholders, including the general public. It generates different types of analyses concerning the electricity sector in Brazil.
One of the main challenges was to comply with ANEEL requirements of using only technology already in place in the agency, while efficiently and dynamically uploading, storing and searching around 80M registers per month. The data model solution associates different templates (meta-data) to the data uploaded to the system, and these templates can be easily modified. The experiments showed that using a hybrid table for data storage is more efficient than other tested implementations. The EPCL language, proposed to create the rules of pricing, is powerful, effective and takes advantage of previous knowledge the employees already have in dealing with spreadsheets. The data analytics model will certainly open up many opportunities of data exploration for better understanding the market in the near future.
REFERENCES
[1] “Atlas de energia el´etrica do brasil,” Agˆencia Nacional de Energia El´etrica (Brasil), 2002.
[2] “Relat´orio de consumo e receita da distribuic¸˜ao,” Accessed on June 15, 2018. [Online]. Available: http://www.aneel.gov.br/relatorios-de-consumo-e-receita
[3] M. M. Minusi, “Metodologia de minerac¸˜ao de dados para detecc¸c¸˜aoo de desvio de comportamento do uso de energia em concession´aria de energia el´etrica,” Master’s thesis, PUC-RS, 2008.
[4] J. R. Pontes, “A ind´ustria de energia el´etrica no brasil: causas funda-mentais de sua reestruturac¸˜ao,” inRegulac¸˜ao e gest˜ao competitiva no setor el´etrico brasileiro. Sagra-Luzzatto, 1999, pp. 33–53. [5] C. Muniz, M. M. B. R. Vellasco, R. Tanscheit, and K. Figueiredo, “A
neuro-fuzzy system for fraud detection in electricity distribution.” in IFSA/EUSFLAT Conf., 2009, pp. 1096–1101.
[6] J. E. C. Junior, “Detecc¸˜ao de fraudes em unidades consumidoras de energia el´etrica utilizando rough sets,” Master’s thesis, UFMS, 2005. [7] “Lei no12.527, de 18 de novembro de 2011,” Presidˆencia da Rep´ublica
do Brasil. Casa Civil.
[8] R. Finos and E. Woods, “Electric utility billing and customer infor-mation systems – billing and cis software and services for regulated and deregulated utilities: Global market analysis and forecasts,” PiKe Research, Tech. Rep., 2012.
[9] M. M. Josephine and D. Nathan, “Curtailing energy theft by remote monitoring case study: University of nigeria, nsukka,” inProc. of the World Congress on Engineering and Computer Science, vol. 1, 2016. [10] O. Hern´andez, M. Santos, and S. Gallardo, “SGE: Information system for strategic planning management applied to an electric utility,” in Proc. of the World Congress on Engineering and Computer Science, vol. 1, 2015.