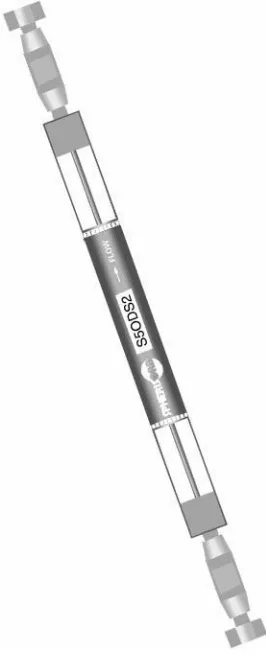
Figure 1 Typical HPLC column.
Table 1 Definitions of columns
Column type Internal diameter (mm)
Analytical 20}3
Microbore 2}0.5
Capillary (0.5
CHROMATOGRAPHY: LIQUID
Column Technology
P. Myers, Phase Separations Ltd, Deeside,
Flintshire, UK
Copyright^ 2000 Academic Press
Introduction
Today, the main columns for high performance liquid chromatography (HPLC) are of tubular design, nor-mally manufactured from high quality stainless steel and packed with spherical ceramic particles. Termi-nation of the columns is via a metal frit held in place by an endRtting that can accept a 1/16 in (15.9 mm) male Rtting to connect the column to the HPLC instrument.
Figure 1shows a typical conventional HPLC
col-umn. This is now a mature design that has evolved over a period of 20 years. In that time, many vari-ations have evolved, such as cartridge columns, re-movable endRtting columns, radial compression col-umns and nonmetal colcol-umns. Today, the most com-mon analytical column has an inner diameter (i.d.) of 4.6 mm with an outer diameter of 1/4 in (63.5 mm). However, in recent years there has been a movement to smaller i.d. columns such as 3, 2, 1 and 0.5 mm. There has also been a development of packed capil-lary columns having i.d. of 0.32, 0.25 and 0.1 mm. Even newer columns with i.d. 0.05 mm have been developed for capillary electrochromatography (CEC). Columns are deRned inTable 1according to their internal diameters.
The most common length of an HPLC column is 25 cm but analytical columns are available in lengths down to 3 cm and guard columns are commonly 1 cm long.
The material packed into columns is mainly silica based, spherical in shape with a particle size of 5m. Material of diameter 10m has now virtually disap-peared from analytical columns and 3m material, although introduced in the mid-1980s, is still not widely used. Newer, smaller-diameter particles of
2 and 1m are also available but at the time of writing occupy a niche market only.
The Conventional Column
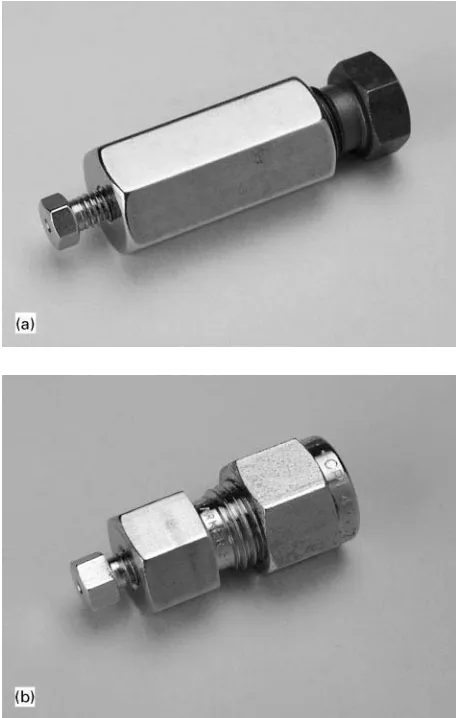
Conventional analytical columns are 4.6 or 4 mm i.d., 1/4 in (63.5 mm) o.d. They are manufactured from high quality stainless steel such as 316 to with-stand the high pressures that are used in packing (up to 10 000 psi; 69 000 kPa) and in operating the columns (around 2500 psi; 17 000 kPa). Manufac-turers take particular care with the inner bores of these tubes; some use tubing ‘as-drawn’, while others use electropolished tubing. There have been reports of chemical modiRcation with silanes to the inner surface. The column packing material is held in the column with an end frit, which in turn is held in place by the column end Rtting. The frit is normally made from a sintered metal, the porosity being determined by the size of the packing material used. For 5m materials, a 2m porosity frit is normally used, but for 3m and smaller, a 0.5m frit is common. The most common type of endRttings are those manufactured by Swagelok, Parker and Valco. Typical endRttings are shown inFigure 2.
Frits are held on the column by compressionR t-tings; although it is possible to remove the endRtting to repair or top up the packed material (or to clean or repair a damaged frit), it is not generally recommen-ded as it is not usually possible to regain good perfor-mance. Inserting and removing these classical columns from an HPLC instrument cannot be done without tools. In an attempt to make this into a simple ‘no tools operation’, and to reduce the amount of hardware used in the tube section of the column, the cartridge column was developed. The Rrst suc-cessful commercial cartridge column was designed by Brownlee Labs and is today still known as the Brow-nlee system.
Figure 2 Typical end fittings.
Figure 3 Finger-tight end fitting column showing frit cap.
[image:2.568.290.517.506.684.2]Figure 4 Removable end fitting column.
Figure 5 (See Colour Plate 21) Radial compression column cartridge.
held by hand-tight end nuts that are part of and free to rotate with the cartridge holder.
Since the Brownlee system was introduced, there have been many copies on this basic design and also developments into theRnger-tight removable endR t-ting column (Figure 3). These columns, as shown in
Figure 4, again have the frit pushed into the tube or
held in place by a frit cap. This frit cap also contains a seal that allows the endRtting to be screwed down onto the frit. This design has many advantages. It allows easy removal of the frit to replace it or top up the column packing material, but more importantly,
it allows columns to be coupled together with very low dead volumes.
Apart from the cartridge and removable endRtting columns, a different design approach was taken by Waters with their radial pack systems. As mentioned previously, high pressures are used to pack particles into column to obtain a well-packed bed. In packing columns, voids in the packing bed are produced if insufRcient pressures are used; these voids are com-monly along the axial direction. The idea of the radial packed column is to pack the material into a soft-walled tube. This tube is held in a device that can apply radial pressure, and so reduce the radial voids. Some examples are shown inFigure 5. This radial compres-sion system has not been applied down to small i.d. tubes, but has been developed for semipreparative systems. In preparative systems, direct axial compres-sion on to the top of the packing is also used.
[image:2.568.51.278.615.694.2]Table 2 Volumetric flow rates required to maintain a linear flow velocity of 1.5 mm s\1in columns of different diameters Column
diameter (mm)
Flow rate (mL min\1)
Solvent consumption (mL h\1)
1.0 0.04 2.4
2.0 0.18 10.8
3.0 0.39 23.4
4.0 0.7 42.0
4.6 0.93 55.8
5.0 1.1 66.0
[image:3.568.50.278.82.201.2]8.0 2.81 168.6
Figure 6 PEEK column.
Figure 7 PEEK-o-bore column.
Reducing the column diameter below 3 mm requires detectors with smaller volumes to reduce detector band broadening. Pumps that can produce lowerSow rates are also required.Table 2gives the volumetric
Sow rates required to maintain a linearSow velocity of 1.5 mm s\1.
Although microbore columns became commer-cially available in the mid-1980s, they have not dis-placed 4.6 mm i.d. columns. Many comparison re-views were written in the 1980s of 1 mm versus 4.6 mm i.d. columns. In general the conclusion was reached that solvent saving and packing material costs did not justify the capital expenditure in new equipment and that mass sensitivity enhancements were difRcult to achieve. Since then much has im-proved, both in the instruments and especially in the column design, particularly in the endRttings used on
(3 mm i.d. columns.
From 1990 onward, further research was conduc-ted and there was widespread discussion of the ad-vantages of microbore columns, including increased resolution, decreased solvent consumption, lower heat capacity, increased mass sensitivity and, most importantly, the easier coupling of these columns to secondary systems and mass spectrometers. Columns with i.d. down to 1 mm are conventionally still manufactured from stainless steel, but as the i.d. is reduced so can the wall thickness be reduced. This allows the use of other materials, as the resulting pressure forces in the small i.d. tubes is also reduced. For 2 and 1 mm columns, glass-lined tubing has been used. This is in an attempt to give a very smooth inner surface, which in turn helps column packing and hence efRciency. Columns are now available manu-factured from PEEK (poly(ether ether ketone), an ICI polymer). Columns of this material are produced in diameters down to 0.5 mm.
A conventional PEEK column is shown inFigure 6, and a 0.5 mm Sexible PEEK column is shown in
Figure 7. These columns have no wetted metal
com-ponents and, since the 0.5 mm columns areSexible,
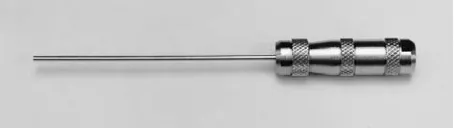
[image:3.568.334.467.365.697.2]Figure 8 Integral guard column.
Figure 9 Stand-alone guard column.
inlet blocks or becomes contaminated, then this part of the column can be cut off.
Capillary columns of less than 0.5 mm i.d. are almost exclusively manufactured from fused silica, in some cases with a metal outer case onto which the endRttings can be connected.
Guard Columns
As the name suggests, guard columns are used to protect the main analytical column. They are normal-ly 1 cm in length, of the same diameter as the main column, and made of the same material. They are not extensively used in all application areas, possibly be-cause they can reduce the total column efRciency and are not easy to install or replace. This is set to change with the development of removable end Rtting col-umns. New designs, as shown inFigure 8, now allow easy connection and replacement of guard systems. However, manufacturers still only offer generic pack-ings of either normal phase or reversed phase for these columns. Figure 9shows a guard column car-tridge system that can be connected to any form of column.
Packing Materials
Porous silica is the most widely used adsorbent in HPLC, although extensive work has been conducted with alumina, zirconia and polymer supports. The majority of these supports are spherical and, for ana-lytical applications with small molecules, have gen-eral physical parameters of pore size 10 nm, pore
volume 0.5 mL g\1and surface area 250 m2g\1. The
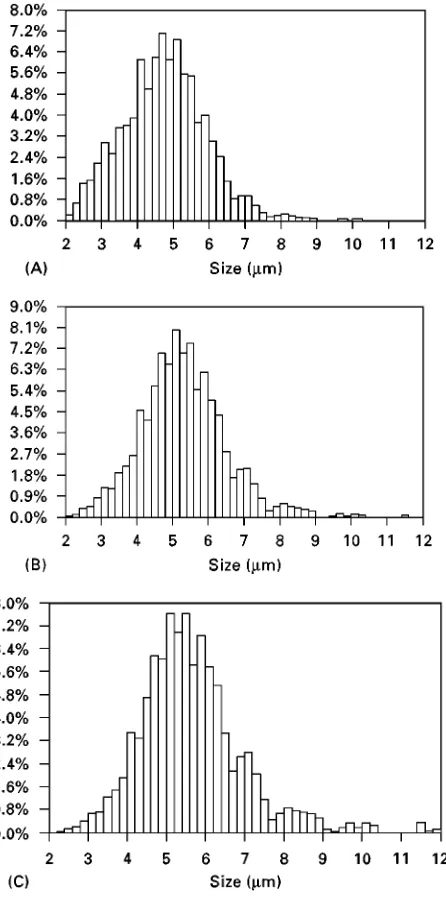
most common particle size used in columns is 5m. Care must be taken when using the particle size given by a manufacturer. What is meant by 5m particles, is actually a 5m particle size distribution. Depend-ing upon the type and mode of measurDepend-ing instrument used by the manufacturer, there will be a particle size distribution based on number, area or volume.
In the number distribution the percentage of the particles in each size range is determined by dividing the number in each range by the total number of particles. In the area distribution, the percentage of the surface area in each size range is determined by dividing the surface area calculated for each size range by the total surface area of all the particles. This has the effect of emphasizing the larger particles more than the number distribution. For example, one particle of 10m diameter has the same surface area as 100 particles of 1m diameter. The volume distri-bution is calculated from the percentage of the vol-ume of each particle size divided by the total volvol-ume of all the sizes. The volume distribution emphasizes the large particles even more than the area distribu-tion, e.g. a 10m diameter particle has the same volume as 1000 particles of 1m. Typical distributions (for a 5m Spherisorb) are given in
Figure 10, showing the emphasis on the larger
par-ticle sizes in the distributions for area and volume. Silica particles used for packing are commonly manufactured from a sol}gel type process, starting
from a cation-based sol. This produces gels that are high in their cationic species, for example Spherisorb has a sodium content of 1500 ppm. Newer manufac-turing methods introduced in recent years, use or-ganic tetraethyl orthosilicate (TEOS) condensation systems that can produce exceptionally pure silicas.
In the sol}gel process, the size of the particles can
be controlled by the viscosity of the mixture, the emulsiRcation rate and the amount and type of sur-factant used to stabilize the emulsion. However, none of the processes can produce monodispersed particles
} they produce a particle size distribution and the
required particle size is then obtained from this by air classiRcation or elutriation.
The tighter the particle size distribution, the more uniform a column packing can be made. However, with very tight particle size distributions it becomes more difRcult to pack the columns. Van Deemter curves demonstrating the effect of particle size on the column efRciency are shown inFigure 11.
[image:4.568.51.278.628.692.2]Figure 10 Particle size distributions for a 5m Spherisorb. (A) Number; (B) area; (C) volume.
Figure 11 Van Deemter curves.
Table 3 Column packing parameters
Description Column volume
(mL)
Si density (g mL\1)
Mass of packing (g)
Carbon load (%)
Amount of carbon in the column (g)
Nova-Pak C18 1.8 0.91 1.64 7 0.12
Bondapak C18 1.8 0.46 0.82 10 0.08
different manufacturers, which can impose different interpretations on the type and shape of pores. In HPLC, an important factor is the absence of micro-pores and mesomicro-pores. Micromicro-pores are deRned as hav-ing a diameter of less than 1 nm, while mesopores are less than 5 nm in diameter. If these pores are included
in the surface area calculations, then very large sur-face area values are obtained. However, most analyte molecules cannot penetrate into micropores and even if they could possibly penetrate into the mesopores, diffusion is very restricted by steric hindrance, which in turn affects mass transfer and hence efRciency.
Silica is a preferred adsorbent in HPLC as the surface characteristics can be modiRed by chemical reaction to change the hydrophilic silica surface into a hydrophobic surface suitable for reversed-phase chromatography, or to place an ionic exchange material on the surface for ion exchange chroma-tography.
A very broad range of functionality can be attached to the silica surface, through reaction with or-ganosilanes, the most popular being C18or
octadecyl-silane. The linkage onto the silica is of the type Si}O}Si}R, where R is the functional group.
Manu-facturers use a variety of silanes, ranging from mono-chloro to trimono-chlorosilanes to mono and tri methoxy and ethoxy silanes. Attachment of the monofunc-tional silane onto the surface of the silica leads to a monomeric phase, while the addition of small amounts of water into the bonding process can lead to polymeric phases.
[image:5.568.52.518.651.711.2]Table 4 Some commercially available bonded phases
Phase name Usage Comments
C1 Purification
C4 Protein separations
C6 Protein separations
C8 General purpose Almost 80%of all applications have been developed with
C8and C18phases
C18ODS General purpose Almost 80%of all applications have been developed with C8and C18phases
Phenyl Separation of complex mixtures Induced dipole interactions with polar analytes Cyano CN Broad spectrum of mixtures with different
polarities
Can be used in both normal and reversed phase Amino NH2 Sugar analysis and for aromatic compounds Weak anion exchanger
Diol Complex mixtures Slightly polar adsorbent for normal phase
Ion exchange Ionic species
Chiral phases Enantiomer separations Four major types available: donor, polymer, cavity and exchange
ODS, octadecylsilica.
outlines this problem, showing the amount of carbon on a material against its percentage carbon loading.
Table 4provides a broad summary of the bonded
phases that are commercially available. It must be stressed that this is in no way an extensive list. There are many specialized phase}column combinations sup-plied by many manufacturers. In particular, these spe-ciality phases tend to be in the chiral separation areas. The term end-capping was introduced in the late 1970s to indicate that a secondary treatment had been applied to a bonded phase. This was an attempt to cover all available silanols. The most common end-capping agent is trimethylchlorosilane; this molecule is relatively small and so can penetrate into the pore system of the adsorbent. Generally end-capping leads to an improvement in the chromatography of basic compounds. However, even after the best end-cap-ping, it is estimated that about 50% of all silanols are still unbonded.
A term that has recently been introduced into column packings is ‘base-deactivated’ reversed phases. This is a particularly unfortunate term since these packings are not deactivated with bases but have surface treatments or treatments of the silica that make them particularly useful for separating basic compounds. Amines, for example, tend to tail on conventional reversed-phase column packings because of the residual acidic silanols. These base-deactivated packings are normally manu-factured from the new pure silicas and have a more uniform or reduced level of silanols.
A major problem with silica is the small pH range over which the adsorbent can be used. Above pH 8.5 the siloxane bridge is broken, leading to breakdown through solvation of the particle. Below pH 2.5, the bonded phase is hydrolysed from the surface of the silica. In an attempt to extend the pH range of silica, attempts have been made to manufacture pH-stable
bondings. These have normally been based on coating the silica with a polymer, such as polybutadiene or a grafted polysiloxane.
Other ceramics have been reported as packing ma-terials. The most common are alumina, zirconia and titania. Although it is possible to attach hydrophobic groups onto all of these materials, with alumina the silane is very easily removed from the surface. To obtain a hydrophobic character for alumina, poly-butadiene or grafted polysiloxane polymers are used. These types of bondings have been divided into two groups. The Rrst comprises those polymers with siloxane bonds such as polymethyloctylsiloxane, polymethyloctadecylsiloxane and silica monomers, while the second is represented by purely organic monomers and oligomers such as polybutadiene.
Another support that has been developed and can be used under very aggressive conditions is porous graphitic carbon.
Polymer-based adsorbents are also used as a sup-port material in HPLC columns. They are manufac-tured from synthetic cross-linked organic polymers. Their main application area is in size-exclusion chromatography and ion exchange chromatography. In normal-phase and reversed-phase HPLC they still have very few applications. A problem is that even though the new polymer packings are highly cross-linked and stable, they still carry the history of their precursors and they can swell with some solvents.
Conclusions
impurity levels are now less than 5 ppm (the Rrst silicas used had typical impurity levels of 1000}2000 ppm). In the silica support materials the
latest developments have been towards base-deac-tivated materials and have tended to focus on the new very pure silicas. Particle size distributions have also become tighter around given means, leading to more stable and reproducible columns.
In column design, the move has been to cartridge type systems having smaller tube i.d. with smaller particles and shorter lengths.
The focus on development is now moving to micro systems. Future developments are likely to be systems with smaller and smaller column i.d., and even com-plete columns on microchips.
See Colour Plates 21, 22.
See also: II/Chromatography: Liquid: Mechanisms: Re-versed Phases. III/Porous Graphitic Carbon: Liquid
Chromatography. Porous Polymers: Liquid Chrom-atography.
Further Reading
Balke ST (1984)Quantitative Column Liquid Chromato-graphy. Amsterdam: Elsevier.
Horvath C (ed.) (1980) High Performance Liquid Chromatography, Advances and Perspectives, vol. 1:
History of HPLC,Chemically,Bonded Phases, Second-ary Equilibria,Gradient Elution. New York: Academic Press.
Horvath C (ed.) (1980) High Performance Liquid Chromatography, Advances and Perspectives, vol. 2:
Optimisation,Adsorption Chromatography, Reversed-Phase HPLC. New York: Academic Press.
Kucera P (1984)Microcolumn High Performance Liquid Chromatography. Amsterdam: Elsevier.
Nawrocki J (1997) The silanol group and its role in liquid chromatography.Journal of Chromatography A 779: 29d71.
Neue UD (1997) HPLC Columns. Theory, Technology, and Practice. New York: Wiley-VCH.
Novotny M and Ishii D (eds) (1985)Microcolumn Separ-ations. Amsterdam: Elsevier.
Scott RPW (1992) Liquid Chromatography Column Theory. New York: Wiley.
Scott RPW (ed.) (1984)Small Bore Liquid Chromatogra-phy Columns:Their Properties and Their Uses. New York: Wiley.
Unger KK (ed.) (1990) Packings and Stationary Phases in Chromatographic Techniques. New York: Marcel Dekker.
Countercurrent Liquid Chromatography
Yoichiro Ito, Lung and Blood Institute, NIH, Bethesda,
MD, USA
Copyright^ 2000 Academic Press
Introduction
Countercurrent chromatography (CCC) belongs to the family of liquid partition chromatography but with one distinct feature: the system totally eliminates the use of a solid support. Unlike liquid chromatogra-phy (LC), CCC utilizes two immiscible solvent phases. The partition process takes place in an open column where one phase (the mobile phase) continu-ously passes through the other (stationary phase), which is permanently retained in the column. To retain the stationary phase within the column, the system uses effective combinations of the column conRguration and a forceReld (gravitational or cen-trifugal). Hence CCC instruments display a variety of forms that are quite different from those used in LC. Because no solid support is used, CCC can elimin-ate all the complications arising from the use of a solid support such as adsorptive sample loss and de-naturation, tailing of solute peaks and contamination.
The Two Basic CCC Systems
All existing CCC systems have been developed from two basic forms, the hydrostatic equilibrium system and the hydrodynamic equilibrium system (Figure 1). The basic hydrostatic system (left) uses a stationary coiled tube. The coil isRrstRlled with the stationary phase (either the lighter or the heavier phase of an equilibrated two-phase solvent system) and the mo-bile phase is introduced from one end of the coil. Owing to the action of gravity, the mobile phase percolates through the segment of the stationary phase in one side of the coil. This process continues until the mobile phase reaches the other end of the coil. Thereafter the mobile phase only displaces the same phase leaving the stationary phase in the coil. Consequently, solutes introduced at the inlet of the coil are partitioned between the two phases in each helical turn and separated according to their partition coefRcients.