Air Pollution in Belfast
By G. C. R. CAREY
{Rend before the Society in Belfast on January 23rd 1967)
The purpose of this paper is to compare the average levels of air pollution present in different areas of Belfast during the five-year period commencing 1st January, 1961, and to examine these levels in relation to the mortality rates from bronchitis which occurred in the central and in the peripheral wards or part-wards of the city during the same five-year period. An assessment is made of the smoking habits of persons resident in Belfast and the effects of these smoking habits upon mortality from bronchitis is discussed.
In the International Statistical Classification of Diseases, Bronchitis (LCD. No. 500-502) comprises three disease groups, namely Acute bronchitis, Unqualified bronchitis and Chronic bronchitis (LCD. No. 500, 501 and 502 respectively). Eighty-seven per cent of all deaths due to bronchitis in the United Kingdom during the year 1964 were due to chronic bronchitis.
The Annual Reports of the Registrar-General for England and Wales have for many years shown that death rates from bronchitis are higher in urban than in rural areas and that these rates are considerably higher in males than in females. In both sexes bronchitis mortality rates increase with advancing age.
A number of factors have been identified as of aetiological importance in chronic bronchitis. Unusually high bronchitis mortality rates are found in areas of the United Kingdom which also have high levels of air pollution (Pemberton and Goldberg, 1954; Daly, 1954). Within a city, deaths from bronchitis and from all causes are significantly higher in wards with high air pollution (Burn and Pemberton, 1963). The number of deaths from bronchitis increases during periods of very high air pollution, for example, during London fogs (Ministry of Health, 1954). Low air temperatures and decreases in absolute humidity also influence bronchitis mortality (Boyd, 1960). Social factors, including domestic overcrowding, may influence bronchitis mortality independently of air pollution (Hewitt, 1956; Daly, 1959). Cigarette smoking also predisposes to increased mortality from bronchitis (e.g. Doll and Hill, 1956).
discharge so that it tends to remain suspended at a low level in the city and river basin under conditions of atmospheric stability. Thus, high concen-trations of air pollution at or near ground level may occur during cold winter days when air turbulence is low and when domestic heating require-ments are high.
METHODS (1) Air Pollution Data
The concentrations in air of solid dark matter and of gaseous acid (subsequently referred to as smoke and sulphur dioxide respectively) were obtained from 24 hour volumetric air samples using standard D.S.I.R. instruments (Department of Scientific and Industrial Research, 1957) sited at eight points in the city (see Fig. 1). Smoke concentrations were deter-mined by the reflectance method using an Evans Electroselenium (' EEL ') electrophotometer and the results expressed as micrograms of smoke per cubic metre of air. Gaseous acid concentrations were determined by passing the air samples through 1-5 volume hydrogen peroxide, titrating the solution against N/250 sodium borate using British Drug Houses' 4-5 ' indicator and then expressing the results as micrograms of sulphur dioxide per cubic metre of air.
In what follows the analysis of air pollution data relates to the five year period commencing 1st January, 1961.
(2) Mortality data '.. ' \..: '
The preliminary air pollution measurements taken during the winter of 1958-59 suggested that the inner part of the city was exposed to about double the concentrations of smoke and sulphur dioxide occurring in the suburbs. There are fifteen wards in Belfast of which four are entirely contained in a central area approximately \\ miles radius from the city centre. The remaining eleven wards, which extend from the boundary of the city to the central area, were divided for comparison purposes into inner and outer part-wards. <
With the invaluable co-operation of the Registrar-General for Northern Ireland the enumeration areas at the 1961 Census were arranged in such a way that the analyses by age and sex of the populations of the four wards that lay entirely within the inner zone, and of each half of the divided wards, were made available to us.
The Registrar General for Northern Ireland also arranged that from 1st January, 1961, all deaths of persons domiciled in Belfast should be coded by inner and outer wards and part wards in relation to the deceased person's domicile. It was therefore possible to calculate age and sex specific death rates for the inner and outer zones of the city and for individual wards and part wards for 1961 and all subsequent years, all rates being based on population data obtained at the 1961 Census.
(3) Tobacco smoking data
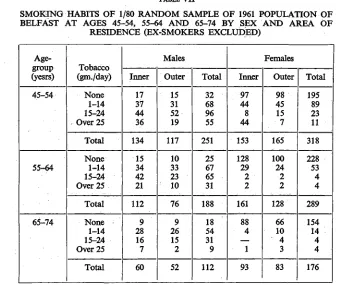
;was drawn using random numbers. Every person in this sample was visited by a social worker who recorded the age, sex, address and smoking habits of the person interviewed. Tobacco smoking was listed in five categories: Group 0 (non smokers)—never smoking as much as one cigarette a day for one year; Group 1—smoking only one to four cigar ettesaday; Group 2—smoking five to fourteen cigarettes a day; Group 3 —smoking fifteen to twenty four cigarettes a day; Group 4—smoking more than twenty five cigarettes daily. For purposes of analysis (see Table VJI) Groups 1 and 2 have been amalgamated. Any present non smoker with a history of past smoking was classified as an 'ex-smoker' and excluded from further analysis.
RESULTS
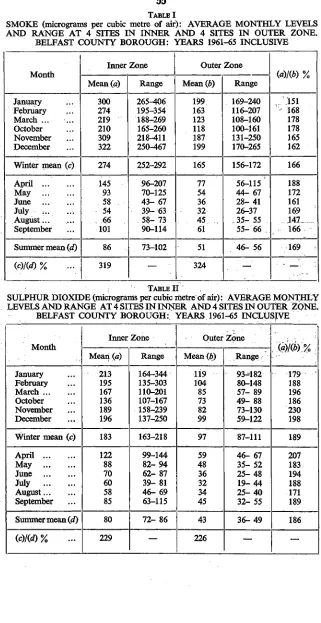
Table I shows the average monthly levels of smoke (micro/gms/cu. m.), based on the means of the readings of all four sites in each zone, by month of tlje year for the 5-year period 1961-65. The data have been grouped in six ' winter' months (January to March and October to November inclusive) and six ' summer ' months (April to September inclusive) in an attempt to identify the amount of air pollution which is created by heating demands during the colder months of the year. Similar data are shown in Table II for average monthly levels of sulphur dioxide. The range referred to is that of the highest and lowest mean value for smoke (or sulphur dioxide) for all four sites in the zone during the specified month in any one of the five years under consideration.
It will be seen from Table I that there was a well-defined yearly cycle of smoke pollution, highest in January and December and lowest in June and July. On average, in either zone, the mean levels of smoke in the 6 month winter period were about three times higher than in the equivalent summer period. In the winter and in the summer periods the average levels of smoke J n the inner zone were about 1-7 times greater than in the outer zone. Inspection of the basic data showed that there were large variations in some level from day to day at individual sites and that these variations depended on meteorological conditions of temperature and air movement. On the other hand, the variations in average winter smoke levels from year to year were small, about + 6 % around tlie five year mean, suggesting that the overall levels of air pollution in the city have remained relatively constant for at the least the past fiv6 years.
about ± 11 % around the five year mean, but the basic data showed no evidence of any trend during the five year period in either improvement or deterioration in the sulphur dioxide problem in the city.
Table III shows the mean and range for the five years 1961-65 inclusive of smoke and sulphur dioxide pollution during the winter and summer periods at each of the four sampling sites in the inner and in the outer zone of the city. It will be seen that those sites which have the highest mean values for smoke pollution do not necessarily have the highest values for sulphur dioxide pollution. The sampling sites having the highest mean values for winter and for summer smoke in the inner zone are situated at Templemore Avenue (east of the city centre) and at Mountcollyer Street (north of the city centre). In the outer zone an unexpected finding was that higher than average smoke levels, both in the summer and in the winter period, were recorded at the Falls Road site which is at the western, and generally windward, side of the city.
(4) Mortality
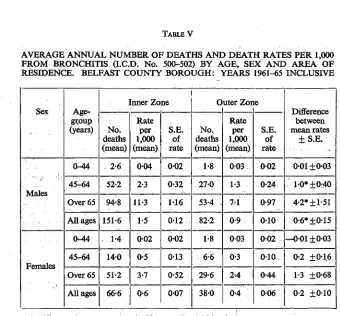
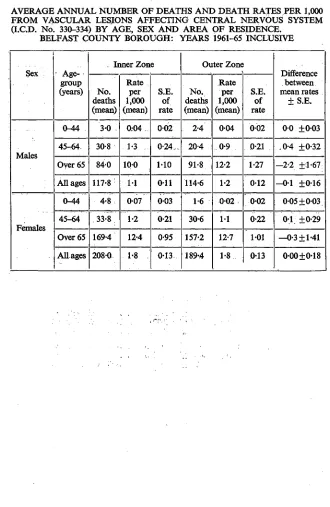
The average annual number of deaths and death rates per 1,000 popula-tion by age, sex and area of residence in Belfast are given in Table IV for deaths from all causes and in Table V for deaths from bronchitis (LCD. No. 500-502). Mortality from vascular lesions affecting the central nervous system (LCD. No. 330-334) is unlikely to be affected by environ-, mental conditions such as air pollution and analyses of mortality due to this disease group are shown in Table VI for purposes of comparison with the data shown in Tables IV and V.
The average annual numbers of deaths and corresponding average annual death rates for the five year period have been used in this analysis because comparison of death rates between individual years gives rise to complex problems of survivorship from one year to the next. Another difficulty arose in the choice of the most appropriate method for calculation of the reliability of a series of annual death rates, so that the method described by the Registrar-General of England and Wales was used throughout in Tables IV, V and VI for the calculation of standard errors and standard errors of the differences between average annual death rates. Details of the method are given in Explanatory Note No. 11 of the Registar-General's Statistical Review of England and Wales for the year 1964.
About 90 per cent of deaths from all causes and 97 per cent of deaths due to bronchitis occur after the age of 45 years. For this reason mortality data have been grouped for all persons aged 0 to 44 years. Mortality data have also been grouped for all persons aged 75 years and over partly because the numbers of persons in certain categories of age and residence were small and partly because problems of competing causes of death and survivorship arise mainly in the oldest age groups.
the death rate for males was always higher than the corresponding rate for females of the same age group.
The data in Table V show that for males, but not for females, the bronchitis death rate in the inner zone was significantly higher than that in the outer zone at ages 45-64, over 65 years and at all ages. Within each zone the bronchitis death rates for males aged 45-64, over 65 years and at all ages were always higher than the corresponding rate for females. In the inner zone about 12 per cent of all deaths in men aged 45-64 and 65 years and over were due to bronchitis, compared with about 5 per cent for women in each of these two age groups. In the outer zone about 8 per cent of all deaths in males aged 45-64 and over 65 years of age were due to bronchitis, compared with 4 per cent for women in either age group.
The data in Table VI show that in neither sex nor in any age group were there significant differences between zones in the death rates from vascular lesions affecting the central nervous system.
Smoking is an aetiological factor in the epidemiology of chronic bron-chitis and comparison must be made between the smoking habits of the populations resident in each zone. These comparisons are shown in Table VII. The only group in which significant differences were found between the two zones was that of females aged 65 years and over and in this comparison there were only 5 smokers resident in the inner zone. In no other group were there significant differences between zones in the age-sex distributions of smoking habits.
DISCUSSION
The data presented in this paper have shown that air pollution levels are considerably higher in the inner than in the outer zone of Belfast. Bronchitis death rates in men aged over 45 years were significantly higher In the inner zone of the city but the smoking habits of a random sample of men of this age group did not differ significantly between the two zones. This suggests that an urbanisation factor may operate independently of smoking habit in the causation of death (but not necessarily morbidity) from bronchitis. An urbanisation factor of this nature may be operative throughout Northern Ireland in that Dean (1966) has shown that an urban-rural gradient of bronchitis mortality exists, even in non-smokers, between truly rural areas of the province which have the lowest rates, and inner Belfast, which has the highest rates.
Environmental causes other than air pollution may affect bronchitis mortality rates in different areas of a city. For example, domestic over-crowding may be greatest in the central area of Belfast where housing density and air pollution levels are high.
not sufficiently detailed (being based on only four sites in each zone) to enable reliable estimates to be made of smoke and sulphur dioxide levels in individual wards or part wards.
High bronchitis mortality rates may be associated with overcrowding in the inner zone of Belfast in that the average number of persons per room was 0-856 for all inner wards and part-wards and 0-730 for the remainder of the city. The difference between these average levels of domestic over-crowding may well be real, but it may explain only a small part of the observed difference in bronchitis mortality between the two zones. In this connection, Hewitt (1956) found that only 20 to 25 per cent of the differ-ences in bronchitis mortality rates between London boroughs could be attributed to factors other than air pollution, for example domestic over-crowding and social class differences. Daly (1959) found that factors related to social class, domestic overcrowding and population density accounted for one one-third of the differences in bronchitis mortality observed between 83 county boroughs in England dnd Wales.
Although differences in local levels of air pollution may account for some of the differences in local bronchitis mortality rates, it is difficult to to determine the relative importance of smoke and of sulphur dioxide pollution in the causation of mortality from bronchitis. Further studies will be required to investigate this problem. Such studies should be pros-pective in nature and might be most usefully undertaken in a city, such as Belfast, in which the Local Authority is about to designate certain districts as smoke control areas. This suggestion is based on the assumption that the burning of smokeless fuels by the domestic consumer will lead to a relatively greater reduction in smoke than in sulphur dioxide pollution. Comparison could then be made of future changes in bronchitis mortality rates in relation to changes in the relative levels of smoke and of sulphur dioxide.
SUMMARY
During the five year period 1961-65, air pollution due to smoke and to sulphur dioxide was consistently higher in the inner than in the outer part of Belfast.
Average annual death rates from all causes, and in males from bron-chitis, were significantly higher in the inner zone despite the fact that smoking habits were very similar between the two zones.
Domestic overcrowding (average number of persons per room) was higher in the inner than in the outer zone and may explain, in part, the differences observed in the local mortality rates. However, differences in local air pollution were considered to be a more important factor than overcrowding in the causation of death from bronchitis.
ACKNOWLEDGEMENTS
records. Professor John Pemberton and Dr. Peter Froggatt gave much useful advice in the preparation of the study. The tabulations of mortality and smoking data were carried out by Mrs. J. McCabe and the typing by Miss L. McCune. Part of the expenses of the study of smoking habits were defrayed from a grant from the World Health Organisation.
REFERENCES
BURN, J. L. and PEMBERTON, J. (1963). Air pollution, bronchitis and lung cancer in
Salford. Int. J. Air Wat. Poll., 7, 5-16.
BOYD, J. T. (1960). Climate, air pollution and mortality. Brit. J. prey. soc. Med., 14, 123-135.
DALY, C. (1954). Air pollution and bronchitis. Brit. med. J., 2, 687-688.
DALY, C. (1959). Air pollution and causes of death. Brit. J. soc. prev. Med., 13,14-27. DEAN, G. (1966). Lung cancer and bronchitis in Northern Ireland, 1960-62. Brit. med.
J., 1,1506-1514.
Department of Scientific and Industrial Research. The measurement of air pollution. 1957, H.M.S.O., London.
DOLL, R. and HILL, A. B. (1956). Lung cancer and other causes of death in relation to smoking, Brit. med. J., 2,1071-1081.
HEWITT, D. (1956). Mortality in London Boroughs, 1950-52. Brit. J. soc. prev. Med., 10,45-57.
Ministry of Health: Mortality and morbidity during the London fog of December, 1952.
1954, H.M.S.O., London.
TABLE I
SMOKE (micrograms per cubic metre of air): AVERAGE MONTHLY LEVELS AND RANGE AT 4 SITES IN INNER AND 4 SITES IN OUTER ZONE.
BELFAST COUNTY BOROUGH: YEARS 1961-65 INCLUSIVE
Month January February March ... October November December
Winter mean (c)
April May June
July ... ... August... September
Summer mean (d)
(c)l(d)% Inner Zone Mean (a) 300 274 219 210 309 322 274 145 93 58 54 66 101 86 319 Range 265^06 195-354 188-269 165-260 218^11 250-467 252-292 96-207 70-125 43- 67 39- 63 58- 73 90-114 73-102 — Outer Zone Mean® 199 163 123 118 187 199 165 77 54 36 32 45 61 51 324 Range 169-240 116-207 108-160 100-161 131-250 170-265 156-172 56-115 44- 67 28- 41 26-37 .3.5-55 55- 66 46- 56 — 151 - 168 178 178 165 162 166 188 172 161 169 147_ 166 169 • -• — : TABLE II
SULPHUR DIOXIDE (micrograms per cubic metre of air): AVERAGE MONTHLY LEVELS AND RANGE AT 4 SITES IN INNER AND 4 SITES IN OUTER ZONE.
BELFAST COUNTY BOROUGH: YEARS 1961-65 INCLUSIVE
Month January February March October November December
Winter mean (c)
April May June July August September
Summer mean (d)
TABLE III
MEAN AND RANGE OVER 5 YEAR OBSERVATION PERIOD FOR 6 WINTER AND 6 SUMMER MONTHS (see text) FOR LEVELS OF SMOKE (ngm./cu. m.)
AND SULPHUR DIOXIDE (ngm/cu. m.) AT 8 SITES IN BELFAST: YEARS 1961-65 INCLUSIVE
Location of Samples
Inner Zone—
College St. (Health Dept.) ... ... Grosvenor Rd. (Inst. of Clinical Science)... Templemore Ave. ... Mountcollyer St.
Outer Zone— . North Rd. .-.''. Balmoral Ave. Falls Rd. (City
Ceme-tery)
Antrim Rd. (Low-wood Park)...
Winter Months (Jan.-Mar. and Oct.-Dec.)
Smoke
Mean
243
232 331 292
154 143
183
178
Range
202-264
209-284 308-348 268-323
150-156 135-150
172-193
163-202
Sulphur Dioxide
Mean
201
153 174 202
98 83
83
123
Range
178-238
117-209 162-184 168-229
88-113 72- 99
72- 97
103-133
Summer Months (April-Sept, incl.)
Smoke
Mean
71
72 104 95
49 44
58
52 Range
44- 88
51- 87 84-119 86-109
41- 60 40-51
54- 62
47- 62
Sulphur Dioxide
Mean
77
81 82 82
42 36
40
51
Range;
62-84
65-99 74-97 76-98
37-47 27^6
29-49
TABLE IV
AVERAGE ANNUAL NUMBER OF DEATHS AND DEATH RATES PER 1,000 FROM ALL CAUSES, BY AGE, SEX AND AREA OF RESIDENCE.
BELFAST COUNTY BOROUGH: YEARS 1961-65 INCLUSIVE
Sex
Males
Females
Age-group (years)
0-44
45-64
Over 65
All ages
0-44
45-64
Over 65
AH ages
Inner Zone
No. deaths (mean)
166-8
452-8
; 741-0
1,360-4
133-0
, 274-2
9040
1,311-2 Rate
per 1,000 (mean)
2-3
19-4
88-1
13-2
1-9
9-8
66-0
11-6 S.E.
of rate
0-18
0-91
3-24
0-36
0-16
0-59
2-19
0-32
Outer Zone
No. deaths (mean)
116-4
330-6
643-0
1,0900
90-2
197-0
767-2
1,054-4 Rate
per 1,000 (mean)
1-8
15-3
85-0
11-7
1-3
7-4.
61-8
9-9 S.E.
of rate
0-17
0-84
3-35
0-35
0-14
0-53
2-23
0-30
Difference between • mean rates
± S.E.
0-5* ±0-24
4-l*±l-24
3-1 ±4-66
1-5 ±0-50
0-5*±0-21
2-4* ± 0 79
4-2 ±3-13
1-7* ±0-44
TABLE V
AVERAGE ANNUAL NUMBER OF DEATHS AND DEATH RATES PER 1,000 FROM BRONCHITIS (LCD. No. 500-502) BY AGE, SEX AND AREA OF RESIDENCE. BELFAST COUNTY BOROUGH: YEARS 1961-65 INCLUSIVE
Sex
Males
Females
Age-grpup (years)
(M4
45-64
Over 65
All ages
0-44
45-64
Over 65
All ages
Inner Zone
No. deaths (mean)
2-6
52-2
9*8
151-6
-. 1-4
14-0
51-2
66-6 Rate
per 1,000 (mean)
004
2-3
11-3
1-5
002
0-5
3-7
0-6
S.E. of rate
002
0-32
1-16
012
002
0-13
0-52
0-07
O
No. deaths (mean)
1-8
27-0
53-4 ..
82-2
1-8
6(5
29-6
380
uter ZOE
Rate per 1,000 (mean)
0-03
1-3
7-1
0-9
003
0-3
2-4
0-4
le
S.E. of rate
002
0-24
0-97
010
002
010
0-44
006
Difference between mean rates
±S.E.
001 ±003
.". 1-0* ±0-40
4-2* ±1-51
0-6* ±0-15
—001 ±003
0-2 ±0-16
1-3 ±0-68
0-2 ±010
TABLE VI
AVERAGE ANNUAL NUMBER OF DEATHS AND DEATH RATES PER 1,000 FROM VASCULAR LESIONS AFFECTING CENTRAL NERVOUS SYSTEM (LCD. No. 330-334) BY AGE, SEX AND AREA OF RESIDENCE.
BELFAST COUNTY BOROUGH: YEARS 1961-65 INCLUSIVE
Sex
Males
Females
; Age-group (years)
0-44
45-64,
Over 65
All ages
0-44
45-64
Over 65
All ages
Inner Zone
No. deaths (mean)
3-0
30-8
840
117-8
4-8
33-8
169-4
2080 Rate
per 1,000 (mean)
0:04
1-3
100
M
007
1-2
12-4
1*8
S.E. of rate
002
0-24..
M0
011
003
0-21
0-95
0-13
Outer Zone
No. deaths (mean)
. 2-4
20-4
91-8
114-6
1-6
30-6
157-2
189-4 Rate
per 1,000 (mean)
004
0-9
12-2
1-2
002
1-1
12-7
1-8
S.E. of rate
002
0-21
1-27
0-12
002
0-22
1*01
0-13
Difference between mean rates
± S.E.
0 0 ±0-03
0-4 ±0-32
-2-2 ±1-67
-0-1 ±0-16
005+0-03
01 ±0-29
—0-3 ±1-41
TABLE VII
SMOKING HABITS OF 1/80 RANDOM SAMPLE OF 1961 POPULATION OF BELFAST AT AGES 45-54, 55-64 AND 65-74 BY SEX AND AREA OF
RESIDENCE (EX-SMOKERS EXCLUDED)
Age-group (yesrs) 45-54 55-64 65-74 Tobacco (gm./day) None 1-14 15-24 . Over 25
Total None 1-14 15-24 Over 25 Total None 1-14 15-24 Over 25 Total Males Inner 17 37 44 36 134 15 34 42 21 112 9 28 16 7 60 Outer 15 31 52 19 117 10 33 23 10 76 9 26 15 2 52 Total 32 68 96 55 251 25 67 65 31 188 18 54 31 9 112 Females Inner 97 44 8 44 153 128 29 2 2 161 88 4 1 93 Outer 98 45 15 7 165 100 24 2 2 128 66 10 4 3 83 Total 195 89 23 11 318 228 53 4 4 289 154 14 4 4 176
Comparison between inner and outer zones—
Males: aged 45-54 xa= 5-4509 aged 55-64 x2= 2-3271 aged 65-74 X2= 2-3271
Females: aged 45-54 x2= 1*6763 aged 55-64 x2= 0-1458 aged 65-74 x2=10-1605
D.F.=3 0-2 > P > 0 1 D.F.=3 0-3 >P>0-2 D.F.=3 0-7 >P>0-5
BELFAST
N
t
MILE
1 | OUTER ZONE
; — WARD BOUNDARIES
SITE No.
II
12
13
14
LOCATION
HEALTH DEPT., COLLEGE STREET ROYAL VICTORIA HOSPITAL TEMPLEMORE AVENUE
NORTH ROAD
SITE No.
15
16
17
18