Design of a measurement device for air pollution
concentrations using an open-source electronics software and
hardware system
Nur Azie Dahari
1, Herman Wahid
2,*, Leow Pei Ling
2, Ruzairi Abdul Rahim
31Faculty of Electrical Engineering
Universiti Teknologi Malaysia, 81310 Skudai, Johor, MALAYSIA.
2Process Tomography and Instrumentation Research Group, Faculty of Electrical Engineering
Universiti Teknologi Malaysia, 81310 Skudai, Johor, MALAYSIA. 3Facultyof Electrical and Electronic Engineering,
Universiti Tuen Hussien Onn Malaysia, 86400 Parit Raja, Batu Pahat, Johor, MALAYSIA
Received 18 September 2017; accepted 18 November 2017, available online 23 November 2017
1.
Introduction
Air pollution is a major concern in both the developing and the developed country. There are many definition of air pollution. Air pollution is defined by World Health Organization (WHO) as indoor and outdoor air pollution is the contamination of the environment by any chemical, physical or biological changes in the natural characteristics of the atmosphere. The Environmental Protection Agency (EPA) defined air pollution as the presence of one or more physical or chemical substance with high concentrations in the air to damage humans, animals, vegetation, etc.
Both organizations have considered that there are six major pollutants in the air. They are divided into two categories such as primary and secondary pollution. The primary pollution directly enters the atmosphere such as sulphur dioxide (SO2), nitrogen dioxide (NO2), carbon monoxide (CO), particulate matter with diameter less than 10-micron (PM10) and lead (Pb). The secondary pollution generated within the atmosphere by a photochemical reaction of hydrolysis or oxidation such as ozone (O3) [1].
In Malaysia, Malaysian Meteorological Department (MetMalaysia) and Department of Environment (DOE) have set five major pollutants of air, which are sulphur dioxide, nitrogen dioxide, carbon monoxide, particulate
matter with diameter less than 10-micron and ozone. The pollutants are briefly discussed as follows:
a) Nitrogen dioxide:
Nitrogen is emitted into the atmosphere as nitrogen oxides and then is transformed into nitrate. Nitrogen dioxide pollutants can be transported away from source areas in association with air flows or dust storms. Worldwide, the sources of nitrogen dioxide gas emissions are coming from industry, power plants, and transportation [2]. The exposure to nitrogen dioxide may increase the risk of asthma, wheezing, ear, nose and throat infections, influenza, and serious colds [3].
b) Carbon monoxide:
Carbon monoxide is a colorless gas. Carbon monoxide is known as a critical toxicant [4]. The lifetime of carbon monoxide is short about a few weeks to two months. It is all depending on the ambient hydroxide (OH) concentrations [5]. The main sources of carbon monoxide emissions are from incomplete combustion of fossil fuel, biofuel, wildfires and agricultural biomass burning [6]. Rapid growth in industrial, automotive and mining sector also produces carbon monoxide gas. The exposure to carbon monoxide may lead to hearing and vision problem [7], Parkinsonism disease [8] and Ischemic stroke [9].
Abstract: Contaminates air killed million people each year and incurs a cost of living on medical treatment. Normally, the authority manages the environmental control by practicing the air quality monitoring strategy by using high-end instrumentations which were very costly and requires periodical maintenance. In this paper, a low-cost air quality monitoring system has been proposed to monitor the air quality. The system is an Arduino based device which is consisting of carbon monoxide sensor, ozone sensor, dust sensor, sulphur dioxide sensor, nitrogen dioxide sensor, temperature and humidity sensor and anemometer. The system is capable to monitor air quality such as carbon monoxide, sulphur dioxide, nitrogen dioxide and meteorological condition such as temperature and humidity. The average level of gas pollution, such as NO2 and ozone was recorded at 10.31 ppm and 17.31 ppm respectively. The developed device will help to monitor air quality in the residence and workplace environment. This system fills the gap between cost efficiency and reliability of other system architectures.
c) Ozone:
Ozone is gas that blue in color and one of the greenhouse gases (GHG). Ozone acts as a main component of urban smog. The acid forms can damage the building surfaces and sculptures. Ozone can act as reagent for the ultrafine particles (UFPs) formation with the presence of volatile organic compounds (VOCs) [10].
Formation of ozone is depending on meteorological variables such as temperature, wind speed and wind direction [11]. Temperature gives effect on the ozone formation in three ways such as reaction rates, VOCs emissions and humidity levels. Higher temperature speeding photochemical reaction rates and lower the atmospheric lifetime [12]. Ozone gases are produced from human activity such as traffic pollution and forest fire for agricultural purposes. Forest fire is common in Southeast Asia especially in Indonesia. The fire used to clean and convert the land into other agricultural purposes mainly for palm oil plantation [13]. This activity produces the sickening and deadly cloud of smoky pollution caused by widespread burning of land and forests in Indonesia, which not only threaten the nation but also neighboring countries such as Malaysia and Singapore [14].
Chronic impact exposures to ozone gas are such as reduced in lung growth, reduced in small airway function, chronic bronchitis, lung cancer [15], asthma, chronic obstructive pulmonary disease, pneumonia and tuberculosis [16].
d) Particulate matter:
Particulate matter can be divided by four groups such as total suspended particulate, particulate matter with 10 micrometers or less in diameter (also known as thoracic particles), particulate matter with 2.5 micrometers or less in diameter (also known as fine particles) and particulate matter with 0.1 micrometers or less in diameter (also known as ultrafine particles) [17]. Particulate matter occurs from human activity such as combustion of fossil fuels, emissions from industrial production, biomass burning, and vehicle exhaust [18]. The effect of particulate matter released in the air will cause asthma, cardiovascular disease, lung cancer, birth defects, and premature death [19].
Air Pollutant Index (API) is an indicator for the air quality status at any area. The API value is calculated based on average concentration of five key pollutants, i.e. carbon monoxide, sulphur dioxide, ozone, nitrogen dioxide and particulate matter. For each pollutant, a sub-index is calculated from a segmented linear function that transforms ambient concentrations onto a scale extending from 0 through 500. The breakpoints used in defining each of the five pollutant sub-indices are listed Table 1. The breakpoints between index values are different for each pollutant and different averaging periods are used for different pollutants.
The air pollutant with the highest concentration (dominant pollutant) will determine the API value. Regularly, the concentration of particulate matter is the
highest among other pollutants and determines the API value. The air pollutant index can be calculated using the following formula: LO LO P LO HI LO HI
P C BP I
BP BP
I I
I
( ) (1)
In equation (1), Ip is the air pollutant index, Cp is the
rounded concentration of pollutants p, BPHI is the
breakpoint greater or equal to Cp, BPLO is the breakpoint
less than or equal to Cp, IHI is the AQI corresponding to
BPHI and ILO is the API corresponding to BPHI.
Table 1 The air pollutant standard index (API)
CO NO2 O3 (1-h) PM SO2
0-4.5 - 0-0.06 0-50 0-0.03
4.5-9 - 0.06-0.12 50-150 0.03-0.14 9-15 - 0.12-0.20 150-350 0.14-0.30
15-30 1.2-6 0.20-0.40 350-420 0.30-0.60 >30 >6 >0.40 >420 >0.60
Table 2 shows the API status reference colour. Good is symbolized by blue. Good mean low pollution without any bad effect on health. Moderate is symbolized by green. Moderate means moderate pollution that does not pose any bad effect on health. Unhealthy is symbolized by yellow and mean worsen the health condition of high-risk, i.e. people with heart and lung complications. Very unhealthy is symbolized by orange and mean worsen the health condition and low tolerance of physical exercises for people with heart and lung complications and also affect public health. Hazardous is symbolized by red and means hazardous to high risk people and public health.
Table 2 API status reference colour
STATUS API
GOOD Below 50
MODERATE 51-100
UNHEALTHY 101-200
VERY UNHEALTHY 201-300
HAZARDOUS More than 300
Besides, in Annaba City, a Wireless Sensor Networks (WSNs) architecture which equipped with gas, temperature and dust sensors and Arduino Uno as microcontroller have been designed for monitoring air quality. The system is capable to monitor such as carbon monoxide, temperature and humidity [23].
This paper will describe on the development of a low-cost air quality monitoring system that can be used to monitor the air quality. This system is different from other developed systems as it caters both pollution monitoring as well as local weather trend (meteorological) monitoring which may influent the air movements. For example, when the strong winds blow, pollutants disperse quickly and resulting in lower pollutant concentrations.
The system is an Arduino based device which is consisting of carbon monoxide, nitrogen dioxide, ozone, dust and sulphur dioxide sensor (i.e. used as air pollutants sensors); while anemometer, temperature and humidity sensor (used as ambient meteorological sensors). For recording the measurements data, a data logger is added to the system. For the validation process, the data collected by the system will be compared with the data from trusted sources such as data from Department of Environment (DOE) stations.
2.
The materials and sensors used to build
up the system
2.1 Microcontroller board
The main component in the system is the Arduino Mega board. The board acts as a microcontroller of the system. The board based on ATmega2560. It has 54 digital inputs and output pins which 15 can be used as Pulse Width Modulation (PWM). PWM is a technique for getting analog results with digital means. Digital control is used to create a square wave, a signal switched between on and off. The board has 16 analog inputs, a 16 MHz quartz crystal, a power jack, an ICSP header and a reset button [24]. The board can be easily powered up through USB cable or by using AC-to-DC adapter. For this system, the board is power up using 12 V adapters.
Fig. 1 Arduino Mega board
2.2 MQ7 Sensor
This system uses a MQ-7 sensor for sensing carbon monoxide concentration in the air. The sensor can detect carbon monoxide gas concentrations in the range of 20 ppm to 2000 ppm. The sensitivity of the sensor can be adjusted by the potentiometer. The required power supply is 5 V DC. The interface type of the sensor is analog and
the size of the sensor is about 40x20 mm [25]. It has three connection pins; pin 1 will be connected to signal output, pin 2 will be connected to the power supply and pin 3 will be connected to the ground.
Fig. 2 MQ-7
2.3 MQ131 Sensor
For monitoring ozone concentration, the system uses an MQ-131 sensor. The sensor can detect ozone concentrations in the range of 10 ppb to 2 ppm. The power supply needed is 5 V. The size of the sensor is 32 mm (length) x 22 mm (width) x 30 mm (height). It has four connection pins; pin 1 will be connected to 5 V of power supply, pin 2 is unused, pin 3 will be connected to analog output and pin 4 will be connected to ground.
Fig. 3 MQ131
2.4 Dust sensor
The dust sensor measures particulate matter level in air by counting the Lo Pulse Occupancy Time (LPO time) in given time unit. The LPO time is proportion to particulate matter concentration. The sensor can detect the particle that has diameter size of one micrometer. The supply voltage needed is 5V and the size of the sensor is 59 mm (width) x 45 mm (height) x 22 mm (depth) [26]. Pin connections are as follows; pin 1 will be connected to ground, pin 2 is unused, pin 3 will be connected to the power supply and pin 4 will be connected to digital output.
Fig. 4 Dust sensor
2.5 Sulphur dioxide sensor
(height). Pin connections are as follows; pin 1 will be connected to ground, pin 2 will not be connected, pin 3 will be connected to analog output and pin 4 will be connected to 5V of power supply.
For this sensor, the analog output voltage increases with the concentration hence the higher the concentration the higher the voltage. The approximated weight of the sensor is 15 g. The working temperature and humidity of the sensor are between -10 to 50 °C (with nominal temperature of 20 °C) and humidity is 95% RH (with nominal humidity of 65% RH).
Fig. 5 Sulphur dioxide sensor
2.6 Nitrogen dioxide sensor
The WSP1110 nitrogen dioxide sensor is sensors that use in the system to detect nitrogen dioxide gas present in the air. It can detect ozone concentrations in the range of 0.1 ppm to 10 ppm [27]. The power supply needed for it to work is 5 V. Pin connections are as follows; pin 1 will be connected to ground, pin 2 will not be connected, pin 3 will be connected to analog output and pin 4 will be connected to 5 V of power supply.
Fig. 6 Nitrogen dioxide sensor
2.7 DHT-22
The DHT-22 is a humidity and temperature sensor with a single wire digital interface. The sensor is calibrated and used to measuring relative humidity (RH) and surrounding ambient temperature. The sensor will detect humidity from 0100% RH and temperature range -40°C - 80 °C. It needs 3.3 V power supplies [28]. Pin connections are as follows; pin 1 will be connected to power supply, pin 2 will be connected to digital output, pin 3 will not be connected and pin 4 will be connected to ground.
Fig. 7 DHT-22 sensor
2.8 Anemometer Kit
It is an instrument in the system which can measure the wind speed. It has made from aluminum alloy. This anemometer is made of shell, wind cups and circuit module. The anemometer is high strength, weather resistance and corrosion resistance. The weight of the anemometer is one kilogram. The mode of its output signal or voltage signal is 5 V. The supply voltage need is 12 V. Effective wind speed measurement is in range 0-30 m/s. It working temperature is in range of -40 to 80 °C and it working humidity is in range of 35% - 85% [29]. Pin connections are as follows; pin 1 will be connected to the power supply, pin 2 will be connected to ground, pin 3 will be connected to voltage signal and pin 4 is will not be connected to current signal.
Fig. 8 Anemometer kit
2.9 Liquid Crystal Display (LCD)
An LCD is used to display the reading obtained from the sensor. The LCD can display 16 x 2 characters. It comes with yellow backlight and character in black color [30]. The approximated price is RM18.
Fig. 9 LCD
2.10 Data Logger
In this system, the data logging shield is used as a data logger. The data logger helps to save the data to file on a formatted SD card [31]. The FAT16 formatted SD card is used for saving the measurement data. The data logger will record each measurement and stores it in memory along with the time and date so the data are easy to be retrieved back and analyzed.
Fig. 10 Data logger module
2.11 Multiplexer Circuit
as a data selector. It has two signal inputs, one control input, and one output. This applied the 2-1 multiplexer concept.
Fig. 11 Multiplexer board
2.12 Power Adapter
This system is powered up by a switching type adapter. The input and the output of the adapter are 100-240V ~ 50/60Hz 0.4A and +12VDC 2A, respectively.
Fig. 12 Adapter
3.
Method for Sensor Calibration
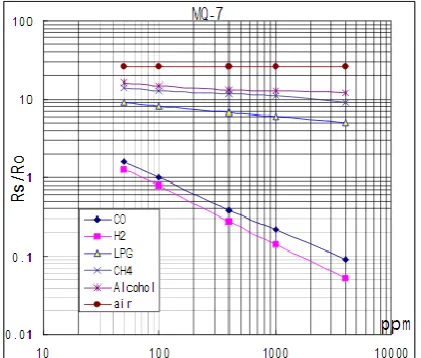
Basically, the calibration of the sensor is based on the data sheet provided. For example, the data sheet for MQ-7 (sensor for detecting carbon monoxide) is shown in Fig. 13. It shows the sensitivity characteristics of the MQ-7 for several gases in the temperature: 20 °C, humidity: 65%, O2 concentration: 21% and RL=10kΩ. The vertical axis of the graph shows the Rs/Ro where the Ro is a sensor resistance at 100 ppm carbon monoxide in the clean air and the Rs is a sensor resistance at various concentrations of gases. The horizontal axis of the graph shows the concentration of gases in ppm.
From the Fig. 13, we choose the carbon monoxide value as we want the MQ-7 sensor to monitor the carbon monoxide level. The carbon monoxide values are re-plotted in an Excel spreadsheet with the natural logarithm function.
The graph of the carbon monoxide concentration is shown in Fig. 14. The linear equation is obtained from the graph is y = -0.6237x+2.86 and the coefficient of determination value is 0.99. The linear equation obtained is not the real algorithm; to getting the real value we need to give the base-10 logarithm of the equation. Then, the equation obtained is programmed in the coding.
The similar method of calibration is also applicable for ozone, sulphur dioxide and nitrogen dioxide sensor. The DHT22 and dust sensor is calibrated sensor from the manufacturer, dust sensor and anemometer are coming with provided coding in the data sheet, thus it can be directly applied to the system.
Fig. 13 The typical sensitivity characteristics of the MQ-7.
Fig. 14 The graph of carbon monoxide concentration.
4.
The Working Principle of the System
The system consists of ozone sensor, carbon monoxide sensor, nitrogen dioxide sensor, sulphur dioxide sensor and dust sensor as an air quality sensor and anemometer, temperature and humidity sensor as an ambient meteorological sensor. The ambient meteorological sensor is included as it will affect the performance of the pollutant in the air and the Arduino is used as microcontroller in the system. The overall block diagram of the system is shown in Fig. 15. The system is power up using an adapter and to avoid over current flow, the step-down is added to the system.
Fig. 15 The block diagram of the system.
The system is capable to monitor a wide variety of ambient conditions such as temperature, humidity and wind speed and able to detect the level of pollutant gas such as carbon monoxide, ozone and particulate matter. The system is accomplished to compute the air quality for the selected area with an expected radius up to 15 to 30 meters depending on the sensor placement. If the sensor is placed in an open area, the gas sensor coverage area is almost 30 meters, but if the sensor is placed in mounted on a wall, the gas coverage area is half.
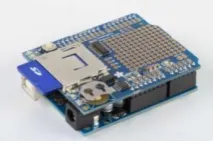
The sensors and materials used are placed in a box to ensure the system looks organized and systematized as shown in Fig. 16. The holes are made into the box and the sensors (e.g.: nitrogen dioxide, ozone and carbon monoxide) are put through the hole to ensure the sensor can monitor the air quality efficiently without any interference from the air in the box. The zoom part of the hole is circled in red in Fig. 16. The schematic diagram of the system is shown in Fig. 17.
(a) (b)
Fig. 16 (a) The system used to monitor the air pollution; (b) The internal look of the system.
The system has been tested for monitoring air pollution in the area Faculty of electrical engineering, Universiti Teknologi Malaysia. The system monitors the air quality almost 9 hours every day, start from 8.00 a.m. until 5.00 p.m. The results are as expected, each of the sensors in the system is functioning well and the given output data such as time, date, level of pollution gas, temperature and humidity surrounding and wind speed as shown in Fig. 18.
The hardware is suitable to work with the weather in this country as it withstands high temperature during a sunny day or even in heavy rain.
Fig. 18 The LCD displays the value of the relative humidity measurement in percentage (%) unit.
5.
Results and Analysis
This section will explain the outcomes for this study. The measurements and results will be discussed in detail in this section.
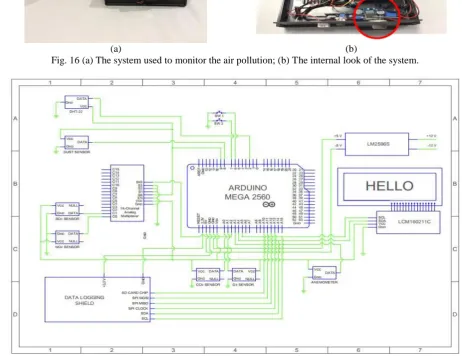
Table 3 show the daily data collected by the system, start from 8.00 until 17.00 pm (within 9 hours). The data collected consist of air quality data such as ozone, nitrogen dioxide, sulphur dioxide, carbon monoxide and ambient meteorological data such as temperature, humidity and wind speed.
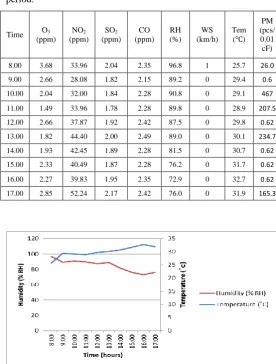
According to Table 3 below, it can be noticed that a temperature change when relative humidity changes. For example, a rise in temperature in early in the morning with no addition of water vapor will lead to decreases in relative humidity as the warm air is capable of holding more water than cooler air as shown in Fig. 19.
Besides, it is clearly shown that the meteorological variable such as time, temperature and humidity will strongly influence the performance of concentration of the pollutant. For example, when the temperature significantly increased in the noon and evening, mostly the concentration of pollutants such as nitrogen dioxide and PM increasing dramatically as shown in Fig. 20.
We expect that the wind speed will give an influence on the pollutant performance. Unfortunately, the results do not support the statement. It is due to small variation of the recorded wind speed level. Hence, wind speed has minor influence to the pollutants performance.
It can be concluded, the performance of the pollutants majorly depended on temperature, humidity surrounding, and time, especially during the noon and evening where the spread of the pollutant is the highest at this time.
Table 3 The collected daily measurement data by hourly period.
Time O3
(ppm) NO2
(ppm) SO2
(ppm) CO (ppm)
RH (%)
WS (km/h)
Tem (℃)
PM (pcs/ 0.01 cF)
8.00 3.68 33.96 2.04 2.35 96.8 1 25.7 26.0
9.00 2.66 28.08 1.82 2.15 89.2 0 29.4 0.6
10.00 2.04 32.00 1.84 2.28 90.8 0 29.1 467
11.00 1.49 33.96 1.78 2.28 89.8 0 28.9 207.5
12.00 2.66 37.87 1.92 2.42 87.5 0 29.8 0.62
13.00 1.82 44.40 2.00 2.49 89.0 0 30.1 234.7
14.00 1.93 42.45 1.89 2.28 81.5 0 30.7 0.62
15.00 2.33 40.49 1.87 2.28 76.2 0 31.7 0.62
16.00 2.27 39.83 1.95 2.35 72.9 0 32.7 0.62
17.00 2.85 52.24 2.17 2.42 76.0 0 31.9 165.3
Fig. 19 The daily trend for relative humidity and temperature data.
Fig. 20 The daily trend for pollutant concentrations data.
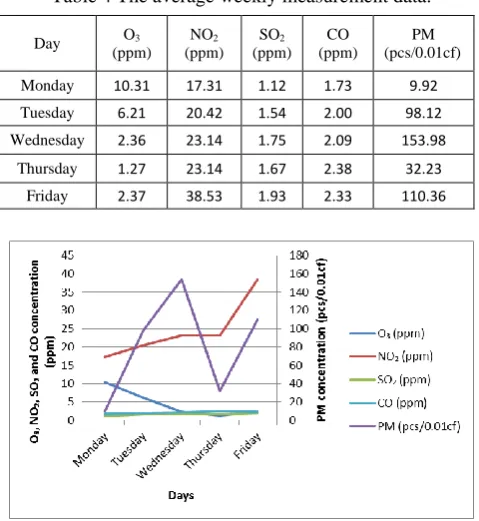
among the pollutants. The average of the weekly measurement data pattern for the pollutants is shown in Fig. 21. From the graph, it is clearly shown mostly the average for each of the pollutants is increasing from Monday to Friday except for the ozone.
Table 4 The average weekly measurement data.
Day O3
(ppm) NO2
(ppm) SO2
(ppm) CO (ppm)
PM (pcs/0.01cf)
Monday 10.31 17.31 1.12 1.73 9.92
Tuesday 6.21 20.42 1.54 2.00 98.12
Wednesday 2.36 23.14 1.75 2.09 153.98
Thursday 1.27 23.14 1.67 2.38 32.23
Friday 2.37 38.53 1.93 2.33 110.36
Fig. 21The average weekly measurement data pattern.
Next, Table 5 shows the maximum weekly measurement data from Monday to Friday. Again, the data are focused on the spread of pollutant such as ozone, nitrogen dioxide, sulphur dioxide, carbon monoxide and particulate matter. It can be stated that the PM concentration shows the highest maximum value for the five days. The results obtained are strongly supporting the statement that the concentration of particulate matter is the highest among other pollutants and determine the API value.
The maximum weekly measurement data pattern for the pollutants is shown in Fig. 22. By referring to the graph, it is obviously showing the maximum value for NO2 and PM concentration pollutant increasing dramatically from Monday to Friday.
Table 5 The maximum weekly measurement data.
Day O3
(ppm)
NO2
(ppm) SO2
(ppm) CO (ppm)
PM ( pcs/0.01cf)
Monday 13.63 17.63 1.16 1.77 37.81
Tuesday 13.98 24.81 2.06 2.35 1380.83
Wednesday 4.5 24.81 2.06 2.35 1380.83
Thursday 2.31 26.12 1.82 2.85 140.75
Friday 3.68 52.24 2.17 2.49 467
Fig. 22 The maximum weekly measurement data pattern.
Lastly but not lease, Table 6 shows the minimum weekly measurement data pattern from Monday to Friday. The data are focus on the minimum spread of pollutant such as ozone, nitrogen dioxide, sulphur dioxide, carbon monoxide and particulate matter. It can be stated that the PM concentration shows the minimum value for the five days. The minimum values are constantly at 0.62 pieces per 0.01cubic feet (pcs/0.01cf).
The minimum weekly measurement data pattern for the pollutants is shown in Fig. 23. From the graph, it shows that the minimum value for the PM concentration is constant and for NO2, it is increasing for the five days. It is also noticed that the SO2 and carbon monoxide show slightly increasing pattern in minimum value for the five days.
Table 6 Minimum weekly measurement data.
Day O3
(ppm) NO2
(ppm) SO2
(ppm) CO (ppm)
PM ( pcs/0.01cf)
Monday 8.12 16.98 1.08 1.71 0.62
Tuesday 1.31 16.98 1.24 1.83 0.62
Wednesday 1.31 21.55 1.47 1.96 0.62
Thursday 0.9 20.9 1.55 2.09 0.62
Friday 1.49 28.08 1.78 2.15 0.62
6.
Conclusion
As a conclusion, an air quality monitoring system has been designed successfully. It is a low-cost system which consists of several combinations of low-cost sensors in the development of the system. The system is capable to monitor air pollution as well as the meteorological data in which the captured trends are following the theoretical rules, for e.g. the ozone data will show higher value following the increment of temperature value. For the future work, we would further verify the measurement data collected by the system with the trusted data source such as data from Department of Environment (DOE) stations.
Acknowledgement
The authors would like to acknowledge the UTM-GUP Grant from Universiti Teknologi Malaysia (UTM) and Malaysian Government with vote number Q.J130000.2523.11H49 for supporting this work.
References
[1] Khodakarami, J., & Ghobadi, P. Urban pollution and solar radiation impacts. Renewable and Sustainable Energy Reviews, Volume 57, (2016), pp. 965-976.
[2] Qu, Y., An, J., He, Y., & Zheng, J. An overview of emissions of SO 2 and NO x and the long-range transport of oxidized sulfur and nitrogen pollutants in East Asia. Journal of Environmental Sciences, Volume 44, (2016), pp. 13-25.
[3] Clark, N. A., Demers, P. A., Karr, C. J., Koehoorn, M., Lencar, C., Tamburic, L., & Brauer, M. Effect of early life exposure to air pollution on development of childhood asthma. Environmental health perspectives, Volume 118(2), (2010), pp. 284.
[4] Lange, J. H., & Condello III, A. V. Neurological Impacts from Carbon Monoxide Poisoning. Journal of Headache & Pain Management. (2016).
[5] Lawrence, M.G., Rasch, P.J., Von Kuhlmann, R., Williams, J., Fischer, H., De Reus, M., Lelieveld, J., Crutzen, P.J., Schultz, M., Stier, P. and Huntrieser, H. Global chemical weather forecasts for field campaign planning: predictions and observations of large-scale features during MINOS, CONTRACE, and INDOEX. Atmospheric Chemistry and Physics Discussions, Volume 2(5), (2003), pp.267-289. [6] Lawrence, M. G., & Lelieveld, J. Atmospheric
pollutant outflow from southern Asia: a review. Atmospheric Chemistry and Physics, Volume 10(22), (2010), pp. 11017.
[7] Mehrparvar, A. H., Davari, M. H., Mollasadeghi, A., Vahidi, M. R., Mostaghaci, M., Bahaloo, M., & Shokouh, P. Hearing loss due to carbon monoxide poisoning. Case reports in otolaryngology, 2013 (2013).
[8] Chang, C. C., Hsu, J. L., Chang, W. N., Huang, S. H., Huang, C. W., Chang, Y. T., ... & Hsu, S. W.
Metabolic covariant network in relation to nigrostriatal degeneration in carbon monoxide intoxication-related Parkinsonism. Frontiers in neuroscience, (2016), pp.10.
[9] Lin, C. W., Chen, W. K., Hung, D. Z., Chen, Y. W., Lin, C. L., Sung, F. C., & Kao, C. H. Association between ischemic stroke and carbon monoxide poisoning: a population-based retrospective cohort analysis. European journal of internal medicine, volume 29, (2016), pp. 65-70.
[10] Fung, C. C., Shu, S., & Zhu, Y. Ultrafine particles generated from coloring with scented markers in the presence of ozone. Indoor air, Volume 24(5), (2014), pp. 503-510.
[11] Dimitriou, K., & Kassomenos, P. Three year study of tropospheric ozone with back trajectories at a metropolitan and a medium scale urban area in Greece. Science of The Total Environment, Volume 502, (2015), pp. 493-501.
[12] Hinks, M. L., Brady, M. V., Lignell, H., Song, M., Grayson, J. W., Bertram, A. K., ... & Nizkorodov, S. A. Effect of viscosity on photodegradation rates in complex secondary organic aerosol materials. Physical Chemistry Chemical Physics, Volume 18(13), (2016), pp. 8785-8793. [13] Vadrevu, K. P., Lasko, K., Giglio, L., & Justice, C.
Analysis of Southeast Asian pollution episode during June 2013 using satellite remote sensing datasets. Environmental Pollution, Volume 195, (2014), pp. 245-256.
[14] Kusumaningtyas, S. D. A., & Aldrian, E. Impact of the June 2013 Riau province Sumatera smoke haze event on regional air pollution. Environmental Research Letters, Volume 11(7), (2016), pp. 075007.
[15] Khafaie, M. A., Yajnik, C. S., Salvi, S. S., & Ojha, A. Critical review of air pollution health effects with special concern on respiratory health. Journal of Air Pollution and Health, Volume 1(2), (2016), pp. 123-136.
[16] Laumbach, R. J., & Kipen, H. M. Respiratory health effects of air pollution: update on biomass smoke and traffic pollution. Journal of allergy and clinical immunology, Volume 129(1), (2012), pp. 3-11.
[17] Meng, X., Zhang, Y., Yang, K. Q., Yang, Y. K., & Zhou, X. L. Potential Harmful Effects of PM2. 5 on Occurrence and Progression of Acute Coronary Syndrome: Epidemiology, Mechanisms, and Prevention Measures. International journal of environmental research and public health, Volume 13(8), (2016), pp. 748.
[18] Cao, J., Xu, H., Xu, Q., Chen, B., & Kan, H. Fine particulate matter constituents and cardiopulmonary mortality in a heavily polluted Chinese city. Environmental health perspectives, Volume 120(3), (2012), pp. 373.
of asthma from birth to age 10 years. European Respiratory Journal, ERJ-00746. (2016).
[20] Theophanides, M., Anastassopoulou, J., & Theophanides, T. Air Polluted Environment and Health Effects. In Indoor and Outdoor Air Pollution. InTech. (2011).
[21] Liu, X. M., F. F. Wang, and Z. B. Zeng. Design and Implementation of Indoor Environmental Quality Monitoring System Based on ZigBee. International Conference on Computer Information Systems and Industrial Applications (CISIA 2015). (2015). [22] Chaudhryl, V. Arduair: air quality
monitoring. International Journal of Environmental Engineering and Management, Volume 4(6), (2013), pp. 639-646.
[23] Fezari, Mohamed, et al. "WSN for AIR Quality Monitoring in Annaba City." ICIT 2015. The 7th International Conference on Information Technology. (2015).
[24] Arduino - ArduinoBoardMEGA.
[25] Carbon Monoxide Gas Sensor (MQ7) (SKU: SEN0132).
[26] Reed. Grove - Dust Sensor User Manual.
[27] WSP1110 WSP2110 Nitrogen Dioxide Sensor NO2 0.1 10pm Detection Module Detector Fast Response Reset Function, simple Drive Circuit-in AC/DC Adapters from Home Improvement on Aliexpress.com | Alibaba Group. Aliexpress.com. [28] Aosong Electronics Co.: 1-10. Digital-output
Relative Humidity & Temperature Sensor/module. http://www.myduino.com/index.php?route=product/ product&product_id=609&search=dht22
[29] Anemometer Kit (0-5V). DFRobot.
http://www.myduino.com/index.php?route=product/ product&product_id=583&search=anemometer+kit [30] LCD (16x2). Cytron Technologies.
https://www.cytron.io/p-ds-lcd-162a?search=lcd&description=1
[31] Adafruit Data Logger Shield. Overview. https://learn.adafruit.com/adafruit-data-logger-shield/overview