THE INFLUENCE OF COFFEE CONSUMPTION TO DECREASE URIC ACID LEVEL AN EXPERIMENTAL
STUDY ON
1
Rosa Lelyana,
2Noor Wijayahadi,
1
Nutrition Department of Medical Faculty Diponegoro University, Semarang, Central Java, Indonesia
2
Pharmacology Department of Medical Faculty Diponegoro
3
Biochemical Department of Medical Faculty Diponegoro University, Semarang, Central Java, Indonesia
4
Clinical Pathology Department of Medical Faculty Diponegoro University, Semarang, Central Java, Indonesia
5
Physiology Department of Medical Faculty Diponegoro University, Semarang, Central Java, Indonesia
6
Dermatology and Venereology Depart
ARTICLE INFO ABSTRACT
Background:
decrease the blood uric acid level. Study about the influence of coffee on the blood uric acid level has never been conducted in Indonesia.
Objective: rat. Method:
into 4 groups. On the 1
were given coffee, too. Group 1 were given 0.36 ml coffee solution/ day, the other group were given 0.72 ml/ day; 1.14 ml/ day and 2.16 ml/ day. Blood
diet were given, before and after coffee treatment. The blood uric level were examined using spectrophotometry. Data were analyzed using Pair
Results:
coffee solution/day. Conclusions:
Copyright © 2015 Rosa Lelyana et al. This is an open access article distributed under distribution, and reproduction in any medium, provided the original work is properly cited.
INTRODUCTION
Some people drink coffee as one of their favorite drinks, whereas some other do not like drinking coffee because they worry about health effect resulted from this kind of drink (Fredholm et al., 1999; James, 1984). Generally speaking, coffee can prevent us from exhaust and lethargy, as well as improve uric acid content. However, according to scientific studies, coffee decreases the uric acid content in blood (Kiyohara et al., 1999; Choi and Curhan, 2007
conclusion goes with assumption that coffee contains polyphenol, in form of chlorogenic acid (Johnston
Paynter et al., 2006; Andersen et al., 2006; Morton Mojzisova and Kuchta, 2001; Svilaas et al
et al., 1999; Choi and Curhan, 2007a,b; Clifford
*Corresponding author: Puguh Riyanto
Dermatology and Venereology Department of Medical Faculty Diponegoro University, Semarang, Central Java, Indonesia
ISSN: 0975-833X
Article History:
Received 28th May, 2015
Received in revised form 18th June, 2015
Accepted 03rd July, 2015
Published online 21st August,2015
Key words: Coffee, Purine, Blood, Uric Acid, Level.
Citation:Rosa Lelyana, Noor Wijayahadi, Kusmiyati, D. K., Purwanto, A. P., Hardian
consumption to decrease uric acid level an experimental study
Research, 7, (8), 19147-19153.
RESEARCH ARTICLE
THE INFLUENCE OF COFFEE CONSUMPTION TO DECREASE URIC ACID LEVEL AN EXPERIMENTAL
ON
HIPERURICEMIA
WISTAR STRAIN RAT
Noor Wijayahadi,
3Kusmiyati, D. K.,
4Purwanto,
A. P.,
*
,6Puguh Riyanto
Nutrition Department of Medical Faculty Diponegoro University, Semarang, Central Java, Indonesia
Pharmacology Department of Medical Faculty Diponegoro University, Semarang, Central Java, Indonesia
Biochemical Department of Medical Faculty Diponegoro University, Semarang, Central Java, Indonesia
Medical Faculty Diponegoro University, Semarang, Central Java, Indonesia
Physiology Department of Medical Faculty Diponegoro University, Semarang, Central Java, Indonesia
matology and Venereology Department of Medical Faculty Diponegoro University, Semarang,
Central Java, Indonesia
ABSTRACT
Background: There was still a controversial effect of coffee, whether coffee could increase or decrease the blood uric acid level. Study about the influence of coffee on the blood uric acid level has never been conducted in Indonesia.
Objective: To prove that coffee could decrease uric acid level in the hyperuricemia blood
Method: A pre and post test design has been done on 24 wistar strain rats that were divided randomly into 4 groups. On the 1st and 2nd week all groups were fed high purin diet. On the 2
were given coffee, too. Group 1 were given 0.36 ml coffee solution/ day, the other group were given 0.72 ml/ day; 1.14 ml/ day and 2.16 ml/ day. Blood were drawn at the beginning before high purin diet were given, before and after coffee treatment. The blood uric level were examined using spectrophotometry. Data were analyzed using Pair- t test and One Way Anova.
Results: There were decreased blood uric acid level in the group receiving 0,72 ml /day and 2,16 ml coffee solution/day.
Conclusions: Coffee is able to reduce blood uric acid level in experimental rats.
is an open access article distributed under the Creative Commons Attribution License, which distribution, and reproduction in any medium, provided the original work is properly cited.
Some people drink coffee as one of their favorite drinks, whereas some other do not like drinking coffee because they this kind of drink James, 1984). Generally speaking, coffee can prevent us from exhaust and lethargy, as well as improve uric acid content. However, according to scientific studies, coffee decreases the uric acid content in blood ., 1999; Choi and Curhan, 2007a,b). This conclusion goes with assumption that coffee contains polyphenol, in form of chlorogenic acid (Johnston et al, 2003; ., 2006; Morton et al., 2007;
et al., 2004; Kiyohara
., 1999; Choi and Curhan, 2007a,b; Clifford et al., 2003a).
Dermatology and Venereology Department of Medical Faculty Diponegoro
Even though drinking coffee, from the scientific viewpoint, may decrease the uric acid in the blood, one must control his or her daily coffee consumption in order to produce positive effects on body. In other words, safe coffee drinking is recommended (Lanchane, 2006; Fredholm
1984; Whitney and Rolfes, 2002; Mycek 2006).
Coffee contains complex compounds including caffeine (Lanchane, 2006; Fredholm et al
chlorogenic acid. Caffein is an alkaloid (C
chemical identity of 1,3,7-trymethylxantine. It is diuretic feature, whereas chlorogenic acid is a polyphenol compound, which functions as strong antioxidant within the substances. A cup of 10 grams robusta coffee powder contains approximately 100 mg caffeine and 200 mg chlorogenic acid (Lanchane, 2006; Fredholm et al., 1999; James, 1984).
International Journal of Current Research Vol. 7, Issue, 08, pp.19147-19153, August, 2015
Rosa Lelyana, Noor Wijayahadi, Kusmiyati, D. K., Purwanto, A. P., Hardian and Puguh Riyanto
consumption to decrease uric acid level an experimental study on Hiperuricemia wistar strain rat”, International Journal of Current
THE INFLUENCE OF COFFEE CONSUMPTION TO DECREASE URIC ACID LEVEL AN EXPERIMENTAL
WISTAR STRAIN RAT
A. P.,
5Hardian and
Nutrition Department of Medical Faculty Diponegoro University, Semarang, Central Java, Indonesia
University, Semarang, Central Java, Indonesia
Biochemical Department of Medical Faculty Diponegoro University, Semarang, Central Java, Indonesia
Medical Faculty Diponegoro University, Semarang, Central Java, Indonesia
Physiology Department of Medical Faculty Diponegoro University, Semarang, Central Java, Indonesia
of Medical Faculty Diponegoro University, Semarang,
There was still a controversial effect of coffee, whether coffee could increase or decrease the blood uric acid level. Study about the influence of coffee on the blood uric acid level has
To prove that coffee could decrease uric acid level in the hyperuricemia blood serum of
A pre and post test design has been done on 24 wistar strain rats that were divided randomly week all groups were fed high purin diet. On the 2nd week all group were given coffee, too. Group 1 were given 0.36 ml coffee solution/ day, the other group were given
were drawn at the beginning before high purin diet were given, before and after coffee treatment. The blood uric level were examined using
t test and One Way Anova.
uric acid level in the group receiving 0,72 ml /day and 2,16 ml
Coffee is able to reduce blood uric acid level in experimental rats.
ribution License, which permits unrestricted use,
fee, from the scientific viewpoint, may decrease the uric acid in the blood, one must control his or her daily coffee consumption in order to produce positive effects on body. In other words, safe coffee drinking is recommended (Lanchane, 2006; Fredholm et al., 1999; James, 1984; Whitney and Rolfes, 2002; Mycek et al., 1995; Davey,
Coffee contains complex compounds including caffeine
et al., 1999; James, 1984) and
Caffein is an alkaloid (C8H10O2N4.H2O) with
trymethylxantine. It is diuretic feature, whereas chlorogenic acid is a polyphenol compound, which functions as strong antioxidant within the substances. A cup of 10 grams robusta coffee powder contains approximately caffeine and 200 mg chlorogenic acid (Lanchane,
., 1999; James, 1984).
OF CURRENT RESEARCH
and Puguh Riyanto, 2015. “The influence of coffee
Caffeine effect in prohibiting adenosine reception results in deteriorating effect on human body (Lanchane, 2006). One of significant effects of coffee, which become controversy among scientists is one that causes the increase or decrease of uric acid. On one hand, theories suggest that coffee containing caffeine will increase the uric acid development. Caffeine (1,3,7-trimethylxantine) will be degraded into 1,3-dimethylxantine; 3,7-dimethylxantine; and 1,7-dimethylxantine. These degraded chemical bounds are capable of developing methylxantine. Xanthenes produce uric acid through oxidation (Lanchane, 2006; Fredholm et al, 1999).
On the other hand, several studies report that polyphenol compound within coffee, chlorogenic acid, concluded that coffee antioxidant contents, i.e. chlorogenic acid, could prevent oxidative damages (James, 1984; Andersen et al., 2006). In an in vivo and in vitro study, proves that the specific antiradical coffee activities are able to decrease the uric acid in the body (Morton et al., 2007; Mojzisova and Kuchta, 2001). It has capability of hampering oxidation of xanthin enzyme activities so that uric acid contents decrease. This result is in line with another study performed in Japan, in which an individual who drinks 3 to 5 cups of coffee in one day has lower uric acid. In addition,there was a study concluded that coffee antioxidant contents, i.e. chlorogenic acid, could prevent oxidative damages (James, 1984; Andersen et al., 2006; Svilaas e al.,
2004; Kiyohara et al., 1999; Choi et al., 2007a,b; Clifford
et al., 2003a; Whitney and Rolfes, 2002; Mycek et al., 1995;
Davey, 2006, Marks et al., 2000). Furthermore, the total consumption of caffeine, including that of the coffee contains, does not have any relationship with the higher risk of the uric acid increase. Condition in which uric acid in the blood increases is called hyperurichemy (Fredholm et al., 1999). The normal rate of uric acid during this condition is 2.1 – 8.4 mg/dL (Fredholm et al., 1999). Uric acid is subjected to a synthesis within human body. High purine diet causes the increase of the uric acid contents (Lanchane, 2006; Fredholm et al., 1999). Therefore, beliefs that constitute coffee as substance with ability of decreasing the uric acid in the human body should be taken into further studies.
Studies on the effect of coffee on uric acid have never been done in Indonesia, so far either on experimental animals or on human. Hence, this study begins with the experimental animal,
Rattus norwegicus Wistar strain rat species. This species was
chosen because of its adaptability to the study treatments. This study used robusta coffee based on results from the previous studies done by the researcher that robusta coffee has higher polyphenol contents than Arabica and other varieties (Svilaas
et al., 2004; Kiyohara et al., 1999; Choi et al., 2007a,b;
Clifford et al., 2003a; Whitney and Rolfes, 2002; Mycek et al., 1995; Davey, 2006, Marks et al., 2000).This study aimed at proving whether coffee consumption to the experiment animal, hyperuchemical Rattus norwegicus Wistar Strain Rat, decreases the uric acid in the blood serum (Svilaas e al., 2004; Kiyohara et al., 1999; Choi et al., 2007a,b; Clifford et al., 2003a; Whitney and Rolfes, 2002).
MATERIALS AND METHODS
Population of Experimental AnimalPopulation used during the study was male Wistar rats (from the species Rattus norwegicus) granted from Trial Animal
Developmental Laboratory and Pre Clinic Research Service Department, The Faculty of Mathematics and Science, Semarang State University.10 week old male Wistar rats weighing 180 to 200 grams/ind, were used the inclusion criteria: healthy (having good agility) having no anatomy disorders, having normal weight (180 – 200 grams/ind.), and aged 10 month old and exclusion criteria: suffering from diarrhea (Daglia et al, 2000; Richelle et al., 2001).
This study was divided into four treatments, in which each treatment employed six individuals, making a total sample of 24 individuals (Donatus et al, 1992; Soehardjono, 1990).The rat division by simple randomization technique resulted in four study groups. Each group was marked by different number. The other materials are CP12 rat feeds and water, and pure robusta coffee powder.
RESEARCH VARIABLES
This study employed three variables: independent variable (coffee with varied doses), dependent variable (uric acid in blood serum of Wistar rats), and control variables (age and sex).
Coffee dose consumption went with table of body surface square comparison of the experimental animals: dose for 200g rat was equal to 0.018 dose for human (Daglia et al., 2000; Richelle et al., 2001). Based on the previous studies, coffee consumption will decrease the uric acid contents within the blood when an individual drinks 3 to 5 cups of coffee daily, in which a cup of coffee has volumes of 200mg with 10g robusta coffee powder, containing 100mg caffeine and 200mg chlorogenic acid (James, 1984; Andersen et al., 2006; Svilaas e al., 2004; Kiyohara et al., 1999; Choi et al., 2007a,b; Clifford
et al., 2003a; Whitney and Rolfes, 2002).
In human, a 200ml cup of coffee drink consists of 10mg coffee powder (one time concentration), and the conversion dose of the solution volume for the rat equal to 200ml water 0.018 x 200ml will be 3.6ml. Therefore, two cups of coffee solution will result in 7.2ml solution; four cups = 14.4ml; and six cups = 21.6ml.
EXPERIMENTAL TREATMENTS
This study used 100g coffee solution (ten times concentration) in 200ml water. This composition resulted in the following treatments: treatment 1 (P1): purin high diet + 0.36 ml coffee
solution + aqua, producing 3ml solution; treatment 2 (P2): purin
high diet + 0.72 ml coffee solution + aqua, producing 3ml solution; treatment 3 (P3): purin high diet + 1.44 ml coffee
solution + aqua, producing 3ml solution; and treatment 4 (P4) :
purin high diet + 2.16 ml coffee solution + aqua, producing 3ml solution. The minimum dose used for this study was 0.36 ml coffee solution, which was equal to 1 (one) cup of coffee. The coffee powder was served by a warm water and fed to the rats using gaster sonde. The solution volume of each feeding was 3 ml.
Preparation of Experimental Animals
with preparing a total of 24 of the 10 week old male rats for a seven day acclimatization process for standard CP12 feeding. These experimental rats were then randomly divided into four groups, each group consisted of six rats. Each group was subjected to initial uric acid measurement after they were given standard CP12 diets (the first observation). After a seven day purin high diet treatment, the second observation for measuring the acid uric content was performed. Whereas the third observation of the acid uric content took place after the experiment animals were fed by coffee in varied doses. The standard diet, purine high diet, and water were given by ad
libitum.
Diet Preparation
Standard CP12 pure diet given to all of the experimental rats seven days long during the adaptation process. The purine high diet consisted of goat brains (with the composition of 50% standard diet and 50% goat brains). This diet was given to experimental rats for seven days long to all treatment groups. Finally, in the following week, a seven day coffee solution diet with varied doses and purine high diet were given to the experimental rats. This study took place from March to April 2008 at the Biological Laboratory of the Faculty of Mathematics and Science, Semarang State University, and the Pharmacological Laboratory of the Faculty of Medicine, Diponegoro University Semarang.
Data Analysis
This study performed two data analyses: descriptive statistical analysis and inferential statistical analysis. Normality test on the data distribution was performed by Saphiro-Wilks test. This technique was done due to small number of the samples for the experiment. Besides, the data were normally distributed, so that the difference in uric acid contents before and after the addition of coffee solution could be tested by a t-pairing test. The difference in blood serum uric acid after the addition of coffee solution in varied doses were subjected to a One Way ANOVA test and, in turn, Post Hoc Bonferroni test. The difference of the change in blood serum uric acid (the ratio of the blood serum uric acid before and after the treatments) was also observed by One Way ANOVA and Post Hoc LSD tests. The difference was considered significant if p value < 0.05 with trust rate interval of 95%.
RESULTS
Caffein and Polyphenol Content
According to the analysis, caffeine content within the coffee resulted in 48mg/10g, whereas polyphenol content resulted in 4.9% 4.9g/100g 0.49/10g = 490mg/10g.
General Description of Experimental Animals
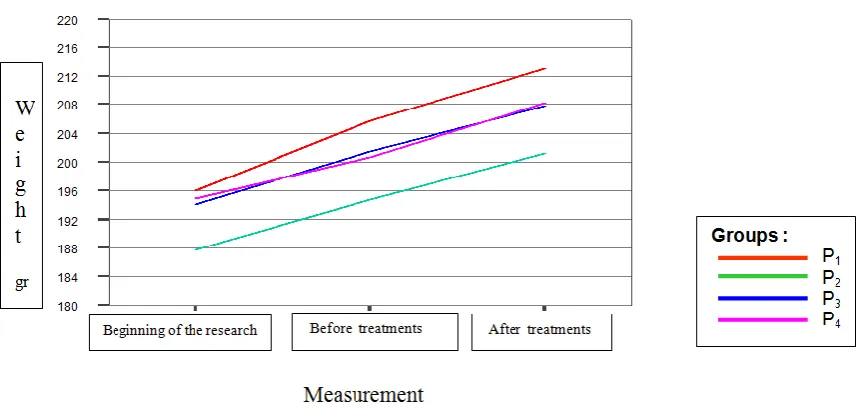
Weight of the animals at the beginning of the research (before purine high diet feeding) and before the treatment (coffee solution feeding)
At the beginning of the research and before the treatments, all experiment animals (24 individuals) were subjected to scaling, which resulted in the following Table 1.
According to normality and homogeinty tests, weights at the beginning of the research and before the treatments were normally distributed (p>0.05) and homogenous (p>0.05). Result of the pair t-test showed that the experiment animals experienced a healty development. This was marked by a normal weight gains. Based on One Way Anova, the research concluded that growth rate of the experiment rats were not affected by high diet and that experiment rats in the four treatments had equal diet appetite.
Weight at before and after seven days coffee solution feeding
Weight scaling was also done before and after seven days
coffee solution feeding, which resulted in the following Table 2.
According to normality and homogeinty tests, weights at the beginning of the research and before the treatments were normally distributed (p>0.05) and homogenous (p>0.05). Result of the pair t-test showed that the experiment animals experienced a healthy development. This was marked by a normal weight gains. Based on One Way Anova, the research concluded that growth rate of the experiment rats were not affected.
Table 1. Average and median weights (gram) of experiment animals at the beginning of the research (before purine high diet feeding) and before the treatments (before coffee solution feeding)
Groups n Beginning of the research Before Treatments
Avg. + SD Avg. + SD p*
P1 6 195.9 + 6.26 205.8 + 8.20 0.05
P2 6 187.7 + 8.01 194.6 + 10.46 0.03
P3 6 193.9 + 7.83 201.6 + 9.85 0.001
P4 6 194.9 + 5.85 200.7 + 11.17 0.01
*pair t-test
[image:3.595.87.509.717.776.2]**One Way ANOVA p=0.2** p=0.2*
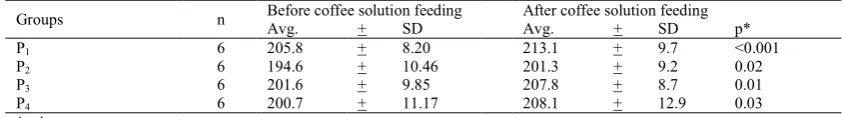
Table 2. The weight comparison at the beginning of the research (before purine high diet feeding), before coffee solution feeding (after purine high diet feeding), and after seven days coffee solution feeding
Groups n Before coffee solution feeding Avg. + SD After coffee solution feedingAvg. + SD p*
P1 6 205.8 + 8.20 213.1 + 9.7 <0.001
P2 6 194.6 + 10.46 201.3 + 9.2 0.02
P3 6 201.6 + 9.85 207.8 + 8.7 0.01
P4 6 200.7 + 11.17 208.1 + 12.9 0.03
*pair t-test
The above figures explained that no weight gain was found in the treatment groups either at the beginning of the research, before the treatments, or after the treatments.
Diet residuals
Diet residuals were also scaled at the same time as the weight scaling was performed, at the beginning of the research, before and after the treatments. Result from the distribution normality test showed that the diet residuals were abnormally distributed (p<0.05) thus, the research needed to implement a non-parametric analysis. Diet residuals at the beginning of the research and before the treatments are presented in the Table 3. From Kruskall-Wallis test also proved that the difference in the quality of the diets did not affect the number of diet consumption of the experiment animals.
Table 3. The average and median of diet residuals of the experimental animals at the beginning of the research
Groups N
Beginning of the
research
Before Treatments
Avg. + SD Avg. + SD p*
P1 6 0.5 + 0.45 0.4 + 0.49 0.6
P2 6 0.7 + 0.47 0.3 + 0.39 0.1
P3 6 0.6 + 0.38 0.3 + 0.60 0.2
P4 6 0.5 + 0.45 0.3 + 0.41 0.2
*Wilcoxon **Kruskall-Wallis
p=0.6** p=0.9*
Table 4. The average and median of diet residuals of the experimental animals before and after the treatments
Groups n
Before treatments After treatments
Avg. + SD Avg. + SD p*
P1 6 0.4 + 0.49 0.4 + 0.49 0.8
P2 6 0.3 + 0.39 0.3 + 0.38 0.9
P3 6 0.3 + 0.60 0.4 + 0.36 0.5
P4 6 0.3 + 0.41 0.3 + 0.38 0.6
*Wilcoxon **Kruskall-Wallis
p=0.9** p=0.9*
Table 4 showed data of diet residuals before and after the treatments. From the table, it was proven that there was not any significant difference in diet residuals before and after the treatments (p>0.05). Accordingly, diet quality and coffee solution feeding did not affect the difference in the number of diet consumption of the experiment animals on daily basis.
Uric acid in experiment animals
The examination of uric acid in the experiment animals took place three times: at the beginning of the research, before and after the treatments.
Uric acid at the beginning of the research and before the treatments
The normality and homogenity tests showed a normal distribution of the uric acid are presented in the Table 5. In addition, both tests also resulted in homogeinty characteristics (p>0.05). The pair t-test in the Table 5 showed that the average of uric acid before the treatments was higher than that of at the beginning of the research and after the treatments, with only significant difference found in treatment P4 (p=0.03).
Table 5. The average and median of uric acid of the experiment animals at the beginning and before the treatments following the purin high diet
feeding (mg/dL)
Groups N
Beginning Before treatments
Avg. + SD Avg. + SD p*
P1 6 3.13 + 0.38 3.19 + 0.29 0.8
P2 6 3.03 + 0.32 3.42 + 0.49 0.1
P3 6 3.08 + 0.41 3.27 + 0.36 0.4
P4 6 2.86 + 0.21 3.37 + 0.32 0.03
*pair t-test
**One way
Anova
p=0.3* p=0.7*
The above table showed the higher average of uric acid of the experiment animals at the beginning of the research
(hyperuchemy) than the normal average of uric acid in male
[image:4.595.81.513.55.265.2]Wistar rats, 1.99 mg/dL (Yanagimoto et al., 2004).
Uric acid before and after the treatments
[image:5.595.35.293.138.245.2]Table 6 illusrated data on uric acid of the experiment animals before and after coffee solution giving, as follows:
Table 6. The average and median of uric acid of the experiment animals before and after coffee solution feeding
Groups N
Before treatments (purin high diet, without coffee solution)
After treatments (purine high diet, with
coffee solution)
Avg. + SD Avg. + SD p*
P1 6 3.19 + 0.29 3.25 + 0.28 0.8
P2 6 3.42 + 0.49 2.84 + 0.19 0.04
P3 6 3.27 + 0.36 2.87 + 0.31 0.3
P4 6 3.37 + 0.32 2.94 + 0.16 0.04
*pair t-test
**One way
Anova
p=0.7* p=0.02*
The pair t-test in the Table 6 showed that the average of uric acid before the treatments was found lower in treatment P2
(p=0.04) and treatment P4(p=0.04).
Change in uric acid average
Table 7 explained the result of the pair t-test, where the difference in the uric acid average was found. The biggest and the most significant difference was found in treatment P4
(p=0.03). The One Way Anova test showed a significant difference in acid uric average before and after the treatments (p=0.04).
Table 7. The average and median of the change in uric acid of the experiment animals (mg/dL)
Groups N
Beginning – before Treatments
After – before treatments
Avg. + SD Avg. + SD p*
P1 6 -0.11 + 0.46 0.03 + 0.43 0.6
P2 6 0.38 + 0.51 0.56 + 0.65 0.08
P3 6 0.11 + 0.24 0.24 + 0.52 0.3
P4 6 0.52 + 0.43 0.43 + 0.38 0.03
*pair t-test
**One way Anova p=0.07* p=0.04*
The above table also showed that the dose effect of coffee giving on the decrease in uric acid was inconsistent provided that coffee contained caffeine, which meant that this substance was diuretic and likely to increase the uric acid.
Above is Figure 2, in which likelihood of the uric acid increase after purin high diet (coffee solution) feeding was employed to all groups, and decrease after coffee solution feeding to treatments P2, P3, P4, despite a significant increase only found
in treatments P2 and P4.
DISCUSSION
General Description of Experimental Animals
Diet feeding in this study was treated as one of controlled and homogenous variables in order to give a minimum effect during the research. When the experimental animals undergo a good development, weight gain must occur to them.
Purine high diet feeding in seven days long refered to previous studies on the experimental animals. According to those studies, the purin high diet feeding must consist of 50% portion of goat brain and 50% portion of standar diets (Daglia et al., 2000). This composition will increase the uric acid in the blood. This study showed that the purine high diet feeding gave increase uric acid in blood only treatment P4. This might be due
to excessive excretion of uric acid in the other treatments caused by the increase in coffee solution consumption. Another cause was that the purine high diet feeding for the remaining treatments did not result in stress so that their body metabolism was still able to foster an excessive uric acid development in their bodies.
[image:5.595.93.483.481.733.2]Coffee solution was given by gaster sonde in order to produce an appropriate volume for the experiment animals in line with the research design. Result of this study was yet consistent, however, to decrease uric acid according to the dose of the coffee solution given as it might be found in treatment P3.
The condition occurred because treatment P3 experienced a
stressful condition due to frequent sonde application, so that even though they were subject to coffee solution treatment, their polyphenol substances (i.e, clorogenic acid) could not perform their antioxidant functions due to the attack of oxidative stress. Therefore, the animals’ body metabolism improved and uric acid increased in excessive manner (uric acid did not significantly decrease for treatment P3).
During the study, either when the samples were given purine high diet or coffee solution, no side effects, i.e. mild fasces or hair fall, found. I addition, all animals survived their lives.
The effect of coffee solution feeding on uric acid in the blood
The average uric acid in blood before and after the treatments showed a significant decrease for treatment P2 (0.53 mg/dL or
15%), treatment P3 (0.24 mg/dL or 5.9%), and P4 (0.43 mg/dL
or 12.1%). Whereas treatment P1 experienced a slight decrease
(0.06 mg/dL or 6.2%) due to lower consumption of the coffee (0.36 ml or 2.8%).
The decrease in uric acid in theblood after the treatments was largely found in treatment P2 (0.53 mg/dL). Such figure
showed that the effect of 0.72 ml coffee solution, or equal to 2 cups of coffee, was capable of decreasing the uric acid in the blood. This result was consistent with the findings that 2 to 5 cups of coffee daily consumption decrese the uric acid in the blood. There was a probability that polyphenol compounds effects contained by the coffee solution are capable to work out stronger in hampering the works of xanthin enzyme oxidation. If this condition happens, uric acid in the body will decrease (Daglia et al., 2000, 2004; Richelle et al., 2001; Castillo et al., 2002; Yanagimoto et al., 2004; Clifford, 1999; Jassim and Naji, 2003).The caffeine effects are not able to keep pace with the polyphenol compounds (i.e., clorogenic acid) because a cup of coffee contains approximately 100 mg caffeine and 200 mg chlorogenic acid. In this case, caffeine content is lower than chlorogenic acid content. In addition, robusta, according to in vitro and in vivo studies, contains higher antioxidant contents than other species, such as arabica, making it capable of combatting the oxidative stress (Johnston et al., 2003; Daglia
et al., 2000, 2004; Richelle et al., 2001; Castillo et al., 2002;
Yanagimoto et al., 2004; Clifford, 1999; Jassim and Naji, 2003).
After coffee treatments, the uric acid resulted in a significant difference on the One Way Anova test between the treatments. This result was consistent with the studies reported previously that the decrease of uric acid in the body begins with a consumption of two cups of coffee on daily basis.In treatments P2 and P4 the uric acid decreased. Furthermore, the result also
agreed with findings that the consumption of 2 to 5 cups of coffee on daily basis will decrease the uric acid in the body (Choi and Curhan, 2007a).
The above results explained that uric acid decreased when subjected to purine high diet treatment and increased when subject o coffee solution treatment. It applied to all treatments of the research, except for treatment P1, in which the increase
could only took place as much as 0.36 ml. Consistent with result of a study held in Japan on humans (to the present day, there has not been similar study on the experiment animals with the similar problem), an individual who drinks two to five cups of coffee per day has the lower uric acid (Kiyohara et al., 1999). Another probability is that the lower coffee consumption will decrease the polyphenolic contents, so that this substance will not inhibit the xanthin oxidase.
Today some people consume a cup of coffee, in form of 10 g coffee poweder, which contains 100mg caffeine and 200mg chlorogenic acid. As explained above, chlorogenic acid is a polyphenolic group that is capable of inhibiting the development of uric acid and will increase in the coffee if more consumed (Johnston et al., 2003; Daglia et al., 2000,2004; Richelle et al., 2001; Castillo et al, 2002; Yanagimoto et al., 2004; Clifford, 1999; Jassim and Naji, 2003).A previous study also showed that antixoidant contents in the coffee, such as chlorogenic acid, were capable of preventing human body from oxidative damages as well as decreasing uric acid in the body built in excessive number (Yanagimoto et al., 2004). Finally, in vivo and in vitro study concluded that activities of specific antiradical of the coffee might decrease the uric acid in the blood derived from the more severely oxidative stress (Daglia
et al., 2004).
Results of this study, that decrease in uric acid more likely occurred in coffee consumption higher than 0.72ml of the solution (equal to two cups of coffee for the human drinks), agreed with the previous studies that the consumption of more than two cups of cofee on daily basis would decrease the uric acid. The consumption of 2.16ml coffee solution (equal to six cups of coffee) also decreased the uric acid. This explanation agreed with previous findings that a consumption of three to five cups of coffee daily was good for decreasing the uric acid.
Conclusion
Treatment with 0.72 ml and 2.16 doses of coffee solution decreased the uric acid in blood of the experimental animals.
Suggestions
This study recommended a further study with treatment duration longer than seven days, incorporation of control (+) and control (-) groups, and using of chlorogenic acid extracts from the robusta coffee with the similar materials in order to know which components in the coffee significant to decrease the uric acid.
Acknowledgements
Thanks to all my lecturer from Faculty of Medicine, Diponegoro University Semarang, and Biological Laboratory of the Faculty of Mathematics and Science, Semarang State University.
REFERENCES
Diseases in the Iowa Women's Health Study,
Am.J.Clin.Nutr., 83(5):1039-46.
Baron D.N. 1984. Asam Urat. Senyawa-Senyawa Nitrogen. In: Kapita Selekta Patologi Klinik.Edisi ke-4. Jakarta : EGC Penerbit Buku Kedokteran.
Becker 1997. Chemical Components in Serum of The Normal Albino Rat. Chemical Biochemical Reference Values. 160 Castillo MD, Ames JM, Gordon MH. 2002. Effect of Roasting
on the Antioxidant Activity of Coffee Brews.
J.Agric.Food.Chem., 19;50(13):3698-703.
Choi HK, Curhan G. 2007a. Coffee, Tea and Caffeine Consumption and Serum Uric Acid Level. The Third National Health and Nutrition Examination Survey,
Arthr.Rheum., 57(5):816–21.
Choi HK, Willett W, Curhan G. 2007b. Coffee Consumption and Risk of Incident Gout in Men: a Prospective Study,
Arthr Rheum., 56(6):2049-55.
Clifford MN 1999. Chlorogenic Acids and Other Cinnamates-nature, Occurrence and Dietary Burden. J.Sci.Food.Agric., 79: 362-72.
Clifford MN. 2003b. The Analysis and Characterization of Chlorogenic Acids and Other Cinnamates. In : Santos-Buelga,G. Williamson G, editors. In: Methods in Polyphenol Analysis. Cambridge: Royal Society of Chemistry. 314–337.
Clifford MN, Johnston KL, Knigh S, Kuhnert N 2003a. Hierarchical Scheme for LC-MSn Identification of Chlorogenic Acids. J.Agricul.Food.Chem., 51: 2900-11. Daglia M, Papetti A, Gregotti C, Berte F, Gazzani G 2000. In
Vitro Antioxidant and Ex Vivo Protective Activities of Green and Roasted Coffee. J.Agric.Food.Chem., 48(5):1449-54.
Daglia M, Racchi M, Papetti A, Lanni C, Govoni S, Gazzani G (2004). In Vitro and Ex Vivo Antihydroxyl Radical Activity of Green and Roasted Coffee. J.Agric.Food.Chem., 52(6):1700-4.
Davey P. 2006. At a Glance Medicine. Jakarta: Penerbit Erlangga. 57.
Djatmika F 2007. Pengaruh Infusa Herba Meniran (Phyllantus niruri Linn) Terhadap Penurunan Kadar Asam Urat Serum Darah Tikus Putih Jantan Galur Wistar Hiperurisemia. Donatus IA, Suhardjono D,Nurlaila, Sugyanto, Hakim L,
Wahyono D et al. 1992. Petunjuk Praktikum Toksikologi Edisi 1. Yogyakarta: Laboratorium Farmakologi dan Toksikologi, Fakultas Farmasi, Universitas Gajah Mada. Farah A, Donangelo MC 2006.Phenolic Compounds in Coffee
with Antioksidan Inhibit Xanthine Oxidase,
Braz.J.Plant.Physiol., 18:23-26.
Fredholm BB, Battg K, Holmen J, Nehlig A, Edwin E, Zvartau 1999. Actions of Caffeine in the Brain with Special Reference to Factors That Contribute to Its Widespread Use Pharmacol Rev. 51(1):83-133.
James JE 1984. Caffeine and Health. In : Spiller GA, Liss AR, editors. Progress in Clinical and Biological Research, Volume 158. New York: Academic Press.
Jassim SAA, Naji MA 2003. Novel antiviral agents: a medicinal plant perspective. J.Appl.Microbiol., 95(3):412-27.
Johnston K.L, Clifford M.N, Morgan LM 2003. Coffee Acutely Modifies Gastrointestinal Hormone Secretion and Glucose Tolerance in Humans: Glycemic Effects of
Chlorogenic Acid and Caffeine, Am.J.Clin.Nutr., 79(4):728–33.
Kiyohara C, Kono S, Honjo S, Todoroki I, Sakurai Y, Nishiwaki M, et al. 1999. Inverse Association Between Coffee Drinking and Serum Uric Acid Concentration in Middle Age Japanese males, Br.J .Nutr., 82(2):125-30. Lanchane MP. 2006. The Pharmacology and Toxicology of
Caffeine. J.Food.Safety.
Marks DB, Marks AD, Smith CM. 2000. Biokimia Kedokteran Dasar Ed ke-1.Penterjemah : Pendit BU. Jakarta : Penerbit EGC. 523-24.
Milius S. 2007. Uric Acid. Chemical Compound : Encyclopædia Britannica Inc. 169 (5). p.70.
Mojzisova G. and Kuchta M. 2001. Dietary flavonoids and risk of coronary heart disease, Physol.Res., 52:59-61.
Morton, Lincoln W, Rima AAC, Ian BP, Kevin DC. 2007. Chemistry and Biological Effects of Dietary Phenolic Compounds: Relevance to Cardiovascular Disease,
Clin.Exp.Pharmacol.and.Physiol., 27 (3): 152-59.
Mycek MJ, Harvey RA, Champe PC. 1995. Stimulan Susunan Syaraf Pusat. Farmakologi Ulasan Bergambar Edisi ke-2. Jakarta : Penerbit Widya Medika. Jakarta.
Nardini M, Cirillo E, Natella F, Mencarelli D, Comisso A, Scaccini C 2002. Detection of Bound Phenolic Acids: Prevention by Ascorbic Acid and Ethylenediaminetetraacetic Acid of Degradation of Phenolic Acids During Alkaline Hydrolysis, Food.Chem., 79:119-24.
Natella F, Nardini M, Giannetti E, Dattilo C and Scaccini C 2002. Coffee Drinking Increases Plasma Antioxidant Capacity in Humans. J.Agric.Food.Chem., 50: 6211-216. Paynter, Nina P, Hsien CY, Sari V, Maria IS, Gerardo H, et al.
(2006).Coffee and Sweetened Beverage Consumption and the Risk of Type 2 Diabetes Mellitus. Am J Epid., 164(11):1075-84.
Richelle M, Tavazzi I, Offord E 2001. Comparison of the Antioxidant Activity of Commonly Consumed Polyphenolic Beverages (Coffee, Cocoa, and Tea) Prepared per cup Serving. J.Agric.Food.Chem., 49(7):3438-42. Ryan Kate 2004. Uric Acid. Chemical Compound:
Encyclopædia Britannica Inc. 27(29):1-54.
Soehardjono J 1990. Petunjuk Laboratorium : Percobaan Hewan Laboratorium. Yogyakarta. 197-217.
Sotillo RD, Hadey M 2007. Nonmutagenic Antioxidant with Potential Antimicrobial Activity. J.Food.Sci., 63(5):907. Svilaas A, Sakhi A, Andersen L, Svilaas T, Ström E, Jacobs D,
Ose L and Blomhoff R 2004. Intakes of Antioxidants in Coffee, Wine, and Vegetables are Correlated with Plasma Carotenoids in Humans. J.Nutr., 134:562-7.
Whitney EN, Rolfes SR 2002. Water and The Major Minerals. Understanding Nutrition. 9th Ed. Belmont: Wadsworth/ Thomson Learning Inc.
Yanagimoto K, Ochi H, Lee KG, Shibamoto T. 2004. Antioxidative Activities of Fractions Obtained From Brewed Coffee. J.Agric.Food.Chem., 52(3):592-6.
Yildirim A, Altinkaynak K, Aksoy H, Sahin YN, Akcay F 2004. Plasma xanthine oxidase, superoxide dismutase and glutathione peroxidase activities and uric acid levels.
J.Cell.Biochem.Funct., 22:173-7.a