ISSN Online: 2160-6927 ISSN Print: 2160-6919
DOI: 10.4236/wjcmp.2018.84012 Nov. 12, 2018 171 World Journal of Condensed Matter Physics
Interaction in the Steady State between
Electromagnetic Waves and Matter
Aidan L. Gordon, Giovanna Scarel
*Department of Physics and Astronomy, James Madison University, Harrisonburg, VA, USA
Abstract
It is common experience that our eyes do not perceive significant changes in color when we observe for long time an object continuously exposed to light. We always see plants to be green in summer until in autumn factors external to our vision, such as changes in the length of daylight and temperature, cause the break-down of chlorophyll and, in turn, spectacular changes in plant’s colors. Likewise, the photocurrent produced in solar panels or field effect transistors achieves a steady state magnitude shortly after the start of the illumination. The steady state photocurrent lasts until the illumination stops. Understanding the origin of the steady state response of a device or light harvesting (LH) system to illumination with electromagnetic (EM) waves motivates the research presented in this work. In our experiments, we used capacitors as LH systems and illuminated them with infrared (IR) light over an 80 hours time period. We investigated the interaction between light and matter by monitoring versus time the voltage output of the capacitors. By combining modeling and experimental observations, we concluded that the steady state voltage is established soon after the start of the illumination as the consequence of the law of conservation of energy. We also found that the magnitude of the voltage in the steady state depends on the power and period of the illuminating IR light, and on the capacitance of the capacitor. When light’s power undergoes fluctuations, also the voltage produced by the capa-citor and the surface charge density on the capacapa-citors do so. These findings suggest that the law of conservation of energy has a significant repercussion when light is absorbed by matter in the steady state, for example in the me-chanism of vision in vertebrates. Likewise, these findings are true when light is emitted from matter, for example in the mechanism of formation of the Cosmic Microwave Background (CMB).
Keywords
Infrared, Light-Matter Interaction, Conservation of Energy, Steady State
How to cite this paper: Gordon, A.L. and Scarel, G. (2018) Interaction in the Steady State between Electromagnetic Waves and Matter. World Journal of Condensed Mat-ter Physics, 8, 171-184.
https://doi.org/10.4236/wjcmp.2018.84012
Received: October 19, 2018 Accepted: November 9, 2018 Published: November 12, 2018
Copyright © 2018 by authors and Scientific Research Publishing Inc. This work is licensed under the Creative Commons Attribution International License (CC BY 4.0).
http://creativecommons.org/licenses/by/4.0/
DOI: 10.4236/wjcmp.2018.84012 172 World Journal of Condensed Matter Physics
1. Introduction
Is exposure time important in light-matter interaction? The question arises na-turally when considering light as a wave. In this case, the energy transferred to matter is P t∆ , where ∆t is a time interval [1]. The average power P∝ E2, where E is the wave’s electric field, can easily be measured with a power
sen-sor. Therefore, because of the dependence on ∆t of the transferred energy,
when matter is exposed to light, two scenarios might occur: in the first scenario, the energy transferred from light to matter increases with time. In the second scenario, the energy transferred from light to matter reaches a steady state. By exploring the first scenario, we unveil outstanding consequences. One is that a prolonged and continuous exposure of a field effect transistor (FET) to light would increase with time the magnitude of the produced photocurrent. Another consequence is that the passing of time would change all year long the color of plants exposed to light, not just in autumn when chlorophyll breaks down due to the shortening of daylight and to temperature decrease. An additional conse-quence is that prolonged exposure to solar light of the photoreceptor cells (rods, cones and photosentitive retinal ganglion cells) in vertebrate’s eyes would in-crease the magnitude of the action potential Vap produced in the process
enabl-ing vision. This increase would be such that 2
ap
P t V∆ ∝ [1]. A further conse-quence would be the increase with exposure time ∆t of a rotation rate ρrot
such that 1 2
2 exp rot
P t∆ ≈ I ρ , where Iexp is a moment of inertia. Such a situation
could occur to a support plate in a microwave oven irradiated by microwaves [1].
As a final consequence, we mention that the frequency νCMB of the cosmic
mi-crowave background (CMB) radiation would increase with time after its initial
emission since 2
CMB
t ν
∆ ∝ , as we will discuss elsewhere.
Considering experimental results, however, leads to conclusions different than those just described. For example, Sarker et al. [2] suggest that photocurrent production in FETs reaches a steady state rather than indefinitely increasing with time. Our own experience indicates that no significant changes in color occur in plants in the three-month summer period, until in autumn the signifi-cant and steady variations in temperature and daylight change this trend. In general, from our own experience of vision, we know that colors remain steady unless something happens in the environment. Thus, we must admit that a drift in the magnitude of the action potential Vap with time of exposure to light of the photoreceptor cells does not occur. We can explain this fact either by assuming that Vap reaches a steady state upon hyperpolarization of the photoreceptor cells, or via other phenomena, such as thermal energy dissipation or mechanical mo-tion, arising to keep Vap constant. We will show elsewhere that the steady state value of the action potential Vap upon hyperpolarization is the result of the evo-lutionary adaptation of the vertebrate’s vision to the average power of solar light
(136 mW/cm2[3] [4]). Moreover, everyday experience shows us that the rotation
rate ρrot of the support plate in a microwave is not accelerated by a prolonged
DOI: 10.4236/wjcmp.2018.84012 173 World Journal of Condensed Matter Physics
the CMB radiation convey that it peaks at νCMB =160.23 GHz, which makes the
CMB radiation uniquely identifiable [5]. These experimental evidences strongly
suggest that with time the energy transferred from light to matter reaches a steady state in agreement with the second scenario.
In this work, we embrace the second scenario and show that achieving a steady state illumination (ssi) follows from the description of light-matter interaction through the law of conservation of energy. To achieve this conclusion, we study
experimentally and through modeling the magnitude of the voltage V t
( )
andtemperature difference ∆T t
( )
versus time produced by the interaction ofinfrared (IR) light with a capacitor. We observe that, upon illuminating with IR light the capacitor for hours or days, the voltage V t
( )
levels off in the ssi regime at a value Vssi=limt→∞V t( )
. We assume that in the ssi the voltage V t( )
produced by the capacitor, the temperature difference ∆T t( )
and the surfacecharge q t
( )
are constant. However, fluctuations can occur in the averagepower P t
( )
of the IR light due to the operation of the Q301 globar source as described in Ref. [6]. These fluctuations trigger perturbations of V t( )
, ∆T t( )
and q t( )
. The perturbations in V t( )
and ∆T t( )
can experimentally be ob-served [1] [6] [7], but those in q t( )
and in the surface charge density σ( )
t cannot be detected. Nevertheless, literature results support evidences for the ex-istence of such perturbations. For instance, light with wavelength from 1600 nm to 700 nm was found to trigger changes in the surface charge density σ( )
t inpolyethylene [8] with magnitude dependent upon the IR light’s power over area,
i.e. the intensity, and with a charge responsivity of about 5.3 pC/W [8]. The fluctuations in the charge density were found not to be related to heating effects, in agreement with results of Ref. [1]. Thus, supported by experimental observa-tions and by modeling, we incorporate into the energy conservation equation describing the interaction of IR light with matter [1] [6] the experimentally ob-served sinusoidal fluctuations of the average power P t
( )
of the IR light, and, consequently, of the voltage V t( )
and temperature difference ∆T t( )
. Then,we derive the surface charge density
( )
( )
cs
q t t
A
σ = versus time [1], where Acs
is the illuminated area with diameter D of the capacitor, from the best match
between the voltage V t
( )
derived from the energy conservation equation andthe experimentally observed V t
( )
. This result extends to the ssi regime the va-lidity of the law conservation of energy for the transfer of energy from light to matter. The role of this law was initially established in the exponential perturba-tion regime (EPR) immediately following the start of the illuminaperturba-tion with IR light [1] [7]. The importance of these findings is that they help understanding several natural phenomena such as the generation of the CMB and the mechan-ism of vision in vertebrates that we will discuss elsewhere.2. Experimental Set-Up
vol-DOI: 10.4236/wjcmp.2018.84012 174 World Journal of Condensed Matter Physics
tage V t
( )
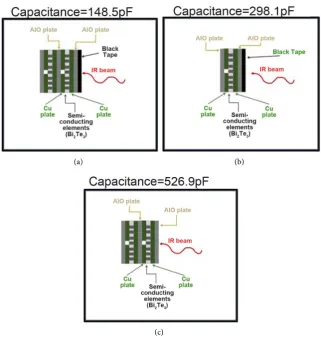
produced in time t by a 07111-9L31-04B device manufactured byCustom Thermolectric Inc. The basic device, illustrated in Figure 1, is a ther-moelectric device consisting of a sequence of layers: 1) an insulating alumina (AlO) plate on the face exposed to the IR light, 2) a metallic Cu plate, 3) a layer of pillars made of a doped semiconducting Bi2Te3-based alloy, 4) another Cu plate, and 5) another AlO plate. This multi-layer structure resembles that of a capacitor, as shown in previous research [1][6] [7]. To change the capacitance C
of the capacitor we combined the capacitors in series or added a layer of insulat-ing tape (IT) on the face exposed to the IR light. The IT consists of heavy cotton cloth pressure sensitive tape with strong adhesive and tensile properties. In this research we used three specific structures: two capacitors in series with IT as in
Figure 1(a) featuring C=148.5 pF, one capacitor with IT as in Figure 1(b) with C=298.1 pF, and two capacitors without IT as in Figure 1(c) enabling
526.9 pF
C= .
Infrared light: We used the continuous broadband IR light in the 350 - 7500
cm−1 wavenumber (28,600 nm - 1300 nm wavelength or 95.33 fs - 4.33 fs period)
range produced by a Q301 globar source in a N2-purged Bruker Vertex 70
spec-trometer [6] [7]. The beam diameter is D=10 mm. The average power is
25 mW
P= between 700 - 7500 cm−1 (14,286 nm - 1300 nm, or 47.62 fs - 4.33
fs period, the middle IR (MIR) range) and about 21.2 μW between 350 - 700 cm−1 (28,600 nm - 14,286 nm or 95.33 fs - 47.62 fs, the far IR (FIR) range). We placed a polyethylene polarizer (Pike Technologies) with a 500 - 10 cm−1 spectral range between the IR light and the capacitor to achieve the 21.2 μW average power in the FIR range. We monitored versus time t the average power P t
( )
of the IR light in the MIR range using a power-meter sensor Coherent Power-Max RS PS19, sensitive to the 300 - 11,000 nm wavelength range and to the 100 μW to 1 W power range.Temperature measurements: We measured the temperatures of the illumi-nated (Tlight
( )
t ) and non-illuminated (Tno light-( )
t ) faces of the capacitors usingOMEGA type E Ni-Cr/Cu-Ni thermocouple probes [1][6] [7].
Data collection: We exposed the capacitors to IR light for ~80 hours after starting the illumination, and collected the voltage V t
( )
, the temperature dif-ference ∆T t( )
, the Tlight( )
t ) and Tno light-( )
t temperatures versus time t forthe entire duration of the measurements in the ssi. The data were collected using LabView 2012 and a National Instruments PXI-1042q communications chassis
[1][6] [7].
3. Results
To investigate the magnitude of the voltage versus time V t
( )
in the ssi, we collected for ~80 hours the voltage V t( )
generated by a capacitor interacting with IR light. This amount of time assures that fluctuations can be observed. Without fluctuations of the average power P t( )
we expect the voltage in the ssi to be Vssi=V0+ ∆V, where V0 is the voltage before the start of theDOI: 10.4236/wjcmp.2018.84012 175 World Journal of Condensed Matter Physics (a) (b)
[image:5.595.213.535.68.407.2](c)
Figure 1. The cross-section of the capacitors used in this research consists of a layer of
Bi2Te3 semiconducting elements embedded between alumina (AlO) and Cu plates.
Con-figuration (a) illustrates two capacitors in series with insulating tape (IT) on the illumi-nated face. This combination features a capacitance C=148.5 pF. Configuration (b) de-picts one capacitor with IT on the face exposed to the IR light which enables
298.1 pF
C= . Configuration (c) pictures two capacitors in series without IT on the face
exposed to the IR light allowing C=526.9 pF. The IT consists of heavy cotton cloth pressure sensitive tape with strong adhesive and tensile properties.
of tens of seconds [1]. With sinusoidal fluctuations arising in P t
( )
, in time we expect perturbations to occur in the voltage V t( )
, the temperature difference( )
T t
∆ , the surface charge q t
( )
and the surface charge density σ( )
t [1][6] [8]. In particular, the experimentally observable V t( )
is such that V t( )
=Vssi+F t( )
,where F t
( )
is the perturbation transferred by the fluctuations to V t( )
. This perturbation justifies the non-constant trends of the voltage V t( )
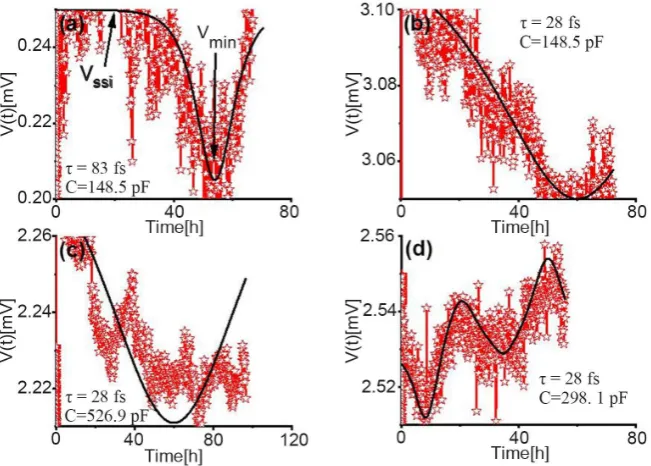
in the ssi, as we observe in Figure 2. Here, all the panels show that V t( )
achieves a mini-mum or various minima over a time interval several hours long. Specifically,Figure 2(a) shows the case of a capacitor with C=148.5 pF placed at an angle
0 0
θ = with respect to the illuminating IR light with period τ ≅83 fs and av-erage power Pssi ≅21.2 Wµ . In this case, Vssi =0.25 mV and the sinusoidal
fluctuations of P t
( )
generate a minimum voltage Vmin =0.20 mV occurring in( )
DOI: 10.4236/wjcmp.2018.84012 176 World Journal of Condensed Matter Physics
Figure 2. The variation of voltage versus time V t
( )
in the time interval of ~80 hoursafter starting the illumination with IR light. The experimental data are presented along with the fitting line (continuous black line) derived from Equation (1). We selected four cases with different angle of incidence θ0, capacitance C, period τ, and average power
P. (a) θ0=0, C=148.5 pF, τ=83 fs, Pssi≅21.2 Wµ , average voltage in the steady state illumination (ssi) Vssi=0.25 mV, and Vmin=0.20 mV occurring 56 hours after the
start of the illumination. The Vssi and the Vmin are labelled in the panel; (b) θ0=0,
148.5 pF
C= , τ =28 fs, P≅25 mW, Vssi=3.10 mV, and Vmin=3.05 mV occurring
60 hours after the start of the illumination; (c) θ0=45, C=526.9 pF, τ =28 fs, 25 mW
P≅ , Vssi=2.27 mV, and Vmin=2.22 mV occurring 60 hours after the start of
the illumination; (d) θ0=45, C=298.1 pF, τ=28 fs, P≅25 mW, Vssi=2.54 mV,
and Vmin=2.51 mV occurring 8 hours after the start of the illumination.
a capacitor with C=148.5 pF and θ =0 0, illuminated with IR light at
28 fs
τ ≅ and Pssi≅25 mW. In this case, Vssi =3.10 mV, and a minimum at
min 3.05 mV
V = emerges in V t
( )
60 hours following the start of the illumination.Figure 2(c), on the other hand, depicts the case for C=526.9 pF, θ =0 45, 28 fs
τ ≅ and Pssi ≅25 mW. In this case, Vssi =2.27 mV, and a minimum at
min 2.22 mV
V = in V t
( )
is produced 60 hours after the start of the illumination.Finally, Figure 2(d) pictures the case for C=298.1 pF, θ =0 45, τ ≅28 fs and 25 mW
ssi
P ≅ . In this case Vssi =2.54 mV, and various minima are generated in
( )
V t , the first of which with Vmin =2.51 mV appears 8 hours after the start of
the illumination.
In each panel of Figure 2, V t
( )
can be fitted using a hyperbolic secant func-tion [6]:( )
sech cV ssi oscV
t t
V t V V
H
−
= +
DOI: 10.4236/wjcmp.2018.84012 177 World Journal of Condensed Matter Physics
where Vosc is the oscillation in the voltage due to the quasi-sinusoidal
fluctua-tions of P t
( )
, tcV is critical time of the voltage, and HV is a time constant [6]. We will use the function in Equation (1) to validate with experimental datathe model we developed for V t
( )
based on the law of conservation of energy[1].
4. Model
To determine 1) the magnitude of Vssi, 2) the surface charge density σ
( )
t , and3) the mechanism that transfers to V t
( )
the fluctuations of P t( )
, we use the law of conservation of energy [1]:( )
( )
( )
2( )
2( )
0
1 1
2 2
q t
E t P t CV t T t
C τ
= = + − Σ ∆ , (2)
where E t
( )
is the energy transferred from the IR light to the capacitor, and0
Σ is the entropy in a closed system derived as in Ref. [1].
1) Determining the magnitude of Vssi
By manipulating Equation (2) we obtain the voltage V t
( )
as:( )
( )
( )
2 0( )
2
2
2 q t
V t P t T t
C τ C C
Σ
= − + ∆ . (3)
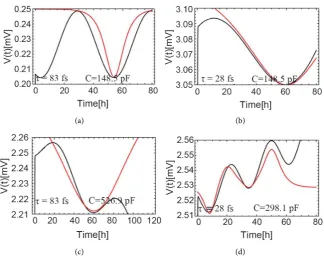
In Figure 3, we display the voltage V t
( )
modeled from Equation (3) along-side the fitting functions obtained with Equation (1) of the experimental voltage( )
V t of the four cases reported in Figure 2. The values of Vssi, viewed as
( )
lim
ssi t
V V t
→∞
= , are derived from the comparison between the panels in Figure 3
and the plateau level achieved by the jump in voltage ∆V at the beginning of
the illumination with IR light (the EPR) for the each of the capacitors under
various illumination conditions. These jumps in voltage ∆V are pictured in
Figure 4. Using the results from Figure 3 and Figure 4 we obtain the following values for Vssi in the four examined cases: a) capacitance C=148.5 pF and
period τ =83 fs yield Vssi ≅0.25 mV, b) C=148.5 pF and τ =28 fs pro-duce Vssi ≅3.10 mV, c) C=526.9 pF and τ =28 fs generate Vssi ≅2.30 mV,
and finally d) C=298.1 pF and τ =28 fs give rise to Vssi ≅2.55 mV. The good match between the values of Vssi extracted from Figure 3 and Figure 4
suggests that the law of conservation of energy in Equation (2) describes in a sa-tisfactory manner the light-matter interaction in the EPR and in the ssi. In both the EPR and the ssi, the unknown variables are Σ0, q t
( )
and σ( )
t . Theen-tropy Σ0 can be derived as in Ref. [1] for the whole time interval that covers
the EPR and the ssi. Whereas, the surface charge q t
( )
and surface charge den-sity σ( )
t in the ssi requires a more dedicated discussion which we present in the next Section.2) Determining the surface charge density variation in time, σ
( )
tDOI: 10.4236/wjcmp.2018.84012 178 World Journal of Condensed Matter Physics (a) (b)
[image:8.595.212.537.70.326.2](c) (d)
Figure 3. Experimental fitting line from Equation (1) (red line) and modeled line (black line)
for different capacitors under various illumination conditions. The experimental fitting lines (red lines) correspond to those in Figure 2. The fluctuations in voltage occurring in the time interval of ~80 hours after starting the illumination with IR light are all of the same size, de-spite different capacitor and illumination conditions. We modeled the four cases reported in the panels using Equation (3) and the following parameters: (a) Angle of incidence θ0=0,
capacitance C=148.5 pF, period τ=83 fs, power in the steady state illumination (ssi) 21.2 W
ssi
P ≅ µ , oscillation in the power in the ssi Posc=17.8 Wµ , entropy 16
0 0.58 10 J C −
Σ = × , temperature difference ∆ =T 0.03 C , initial voltage in modeling
0 mod 0.222 mV
V−
∆ = − , surface charge density in the ssi 0.96 nC m2
ssi
σ = , oscillation in the surface charge density 0.95 pC m2
osc
σ = , critical time of the power tcP=66.6 h [5], and
8 h
p
H = is 1
4 of the period of the sinusoidal function describing the power (see Equation
(4) and Ref. [6]); (b) θ0=0, C=148.5 pF, τ=28 fs, Pssi=25 mW, Posc=0.25 mW,
16 0 25.9 10 J C
−
Σ = × , ∆ =T 0.27 C , ∆V0 mod− =1.608 mV , σssi=8.88 nC m2 ,
2 0.00098 nC m
osc
σ = , tcP=35 h , and Hp=19 h ; (c) θ0=45 , C=526.9 pF ,
28 fs
τ = , Pssi=25 mW , Posc=0.55 mW , Σ =0 87.5 10 J C× −16 , ∆ =T 0.08 C ,
0 mod 0.33 mV
V−
∆ = , 25.58 nC m2
ssi
σ = , 0.00098 nC m2
osc
σ = , tcP=39 h , and
10 h
p
H = ; (d) θ0=45 , C=298.1 pF, τ =28 fs, Pssi=25 mW, Posc=0.25 mW ,
16 0 63.6 10 J C−
Σ = × , ∆ =T 0.11 C , ∆V0 mod− =0.298 mV , σssi=17.98 nC m2 ,
2 0.00005 nC m
osc
σ = , tcP=15.2 h, and Hp=4.3 h.
surface charges q t
( )
on the capacitor with a force f( )
t =q t( ) ( )
E t . Such force displaces the charges away from the location in which the IR waves illuminatethe capacitor, locally decreasing their surface density as
( )
,t 1( )
P t
σ r ∝ . Due to
DOI: 10.4236/wjcmp.2018.84012 179 World Journal of Condensed Matter Physics (a) (b)
[image:9.595.213.536.61.337.2](c) (d)
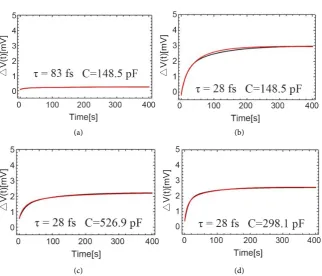
Figure 4. Experimental fitting line (red line) and modeled line (black line) for the jump in
voltage ∆V occurring for different capacitors under various illumination conditions at the beginning of the illumination with IR light. It is noticeable that ∆V depends on capacit-ance C, period τ, and average power P. We performed the modeling for the cases reported in the panels using the following parameters: (a) Angle of incidence θ0=0, capacitance
148.5 pF
C= , period τ=83 fs, power in the steady state illumination (ssi) Pssi≅21.2 Wµ ,
oscillation in the power in the exponential perturbation regime (EPR) Posc EPR− =21.2 Wµ ,
entropy 16
0 0.58 10 J C−
Σ = × , temperature difference ∆ =T 0.03 C , initial voltage in modeling ∆V0 mod− =0.019 mV, surface charge density in the ssi σssi=0.96 nC m2 and oscillation in the surface charge density 0.95 pC m2
osc
σ = ; (b) θ0=0, C=148.5 pF,
28 fs
τ = , Pssi=25 mW , Posc EPR− =25 mW , 0 25.9 10 J C16
−
Σ = × , ∆ =T 0.27 C ,
0 mod 1.06 mV
V−
∆ = − , 8.88 nC m2
ssi
σ = and 0.098 nC m2
osc
σ = ; (c) θ0=45 ,
526.9 pF
C= , τ =28 fs , Pssi=25 mW , Posc EPR− =25 mW , 0 87.5 10 J C16
−
Σ = × ,
0.08 C T
∆ = , ∆V0 mod− = −0.1 mV, σssi=25.58 nC m2 and σosc=0.00098 nC m2; (d)
0 45
θ = , C=298.1 pF , τ =28 fs , 25 mW
ssi
P = , Posc EPR− =25 mW ,
16 0 63.6 10 J C−
Σ = × , ∆ =T 0.11 C , ∆V0 mod− = −0.37 mV , σssi=17.98 nC m2 and
2 0.098 nC m
osc
σ = .
voltage V t
( )
is produced as described in Equation (3). In this process, σ( )
r,t varies in time t as well as in space. The space variable r is a complex variable in the 2D space represented as z= +r irx y, where i is the imaginary unit [1]. Inthe EPR the average power P t
( )
increases exponentially until it achieves the value Pssi selected for the measurement [1]. In the ssi, however, P t( )
sinu-soidally oscillates around Pssi due to the operation of the Q301 globar source
DOI: 10.4236/wjcmp.2018.84012 180 World Journal of Condensed Matter Physics
behavior of the charge density σ
( )
z,t . The behavior of the average power is thus:( )
sin cPssi osc
P
t t
P t P P
H
−
= +
, (4)
where Posc is the amplitude of the sinusoidal oscillations. The critical time of
the power tcP is the point in time in which P t
( )
reaches Pssi, while HP isthe amount of time necessary to move P t
( )
from Pssi to the crest or thetrough of the sinusoidal oscillation, practically 14 of its period [6]. According to the prediction that the surface charge density on the capacitor decreases as
( )
,t 1( )
P tσ r ∝ under the illumination of the IR light, we expect that
( )
, 1( )
1sin cP
P
t
P t t t
H
σ ∝ ∝
−
z .
with z= +r irx y and utilizing the laws of trigonometric functions for complex
variables, we obtain:
( )
( )
(
)
( )
( )
( )
( )
1 1
,
sin , sin ,
sech sech ,
1
sin ,
sin , cosh , sin
x y
y y y
y y
x
x y x x x
x
t RE RE
t r ir t
v t v t r t L r t
r t r t v t v t L
σ
σ
σ ∝ =
+ − = = = − z z (5)
Here, vx and vy are the propagation velocities of the instabilities induced
of the surface charge density σ
( )
r,t along x and y axes, and tσx and tσyare the critical times for their relaxation. The quantities Lx and Ly are such
that Lx = Ly =D, where D is the IR beam’s diameter [1]. Considering σssi
and σosc the average surface charge density in the ssi and the amplitude of its
deviation from equilibrium, respectively, we obtain:
( )
sech sech
,
sin sin
y y y y y y y
y y
ssi osc ssi osc
x x x x x x x
x x
v t v t f v t v t
L L
t
v t v t f v t v t
L L
σ σ
σ σ
σ σ σ σ σ
− − = + = + − − z (6)
Equation (6) suggests that the sinusoidal instability in the average power
( )
P t produces a hyperbolic instability in σ
( )
z,t modulated by a sine function.The dimensionless fractions x
x x
r f
L
= and y
y y
r f
L
= are defined in the next
Section.
3) Determining the mechanism that transfers to the voltage V t
( )
theDOI: 10.4236/wjcmp.2018.84012 181 World Journal of Condensed Matter Physics
While σ
( )
z,t requires a spatiotemporal set of variables, the functions( )
V t
∆ , TIight
( )
t , Tno light-( )
t , and ∆T t( )
are only time-dependent. To decouple z from σ( )
z,t and allow time t to be the only effective variable, we integrate( )
,tσ z over the area A of the capacitor illuminated by the IR light. To achieve this goal, given z= +r irx y, in Equation (6) we write the spatial variables as follows:
x x x
r = f L and ry = f Ly y. Here, x
x x
r f
L
= and y
y y
r f
L
= are dimensionless
fractions varying from 0 to 1 and enabling us to locate any position on the sur-face of area A of the capacitor [1]. For example, by choosing the origin of the reference systems on the lower left corner of a square we have that, when rx=0
and ry=0, then fx =0 and fy =0. When rx =D and ry =D, then
1
x
f = and fy=1. With these variables, in the ssi we integrate Equation (6) over A and obtain:
( )
0 0 0 0
d d d sech d csc
x f yf yf xf
x y y x
f f f f
y y y y x x x x
x y ssi osc y x
y x
f f f f
f v t v t f v t v t
t f f f f
L L
σ σ
σ
=σ
+σ
− −
∫
∫
∫
∫
(7)To solve the integrals in Equation (7) we make a substitution of the variables
such that x x x x
x
f v t v t
L σ
−
Χ = , and y y y y
y
f v t v t L
σ −
Ζ = . Thus we have d x d
x x
L f
v t
= Χ,
0
0 x x x x x
f v t v t
L σ
−
Χ = , and xf x x x
f
x
f v t v t L
σ −
Χ = . Similarly, d y d
y y
L f
v t
= Ζ ,
0
0 y y y y
y
f v t v t L
σ −
Ζ = , and yf y y y
f
y
f v t v t L
σ −
Ζ = . With these substitutions of
va-riables, the charge density σ
( )
t becomes:( )
( )
( )
( )
(
)
(
( )
)
(
)
( )
( )
(
)
(
( )
( )
)
(
)
0 0 0 2 0 0d sech d csc
arctan sinh arctan sinh
ln csc cot ln csc cot
f f
y x
ssi osc
y x
y x
ssi osc f
y x
f f
L L
t
v t v t L L v v t
σ σ σ
σ σ
Ζ Χ
Ζ Χ
= + Ζ Ζ Χ Χ
= + Ζ − Ζ
∗ − Χ + Χ + Χ + Χ
∫
∫
(8)
For
(
fx0,fxf)
=( )
0,1 and(
fy0,fyf)
=( )
0,1 , the surface charge density( )
tσ evolves with time as:
( )
20
arctan sinh arctan sinh
ln csc cot
ln csc cot
y x y y y y y
ssi osc
y y
y x
x x x x x x
x x
y y y y
y
L L v t v t v t t
L L
v v t
v t v t v t v t
L L
v t v t L
σ σ
σ σ
σ σ
σ =σ +σ − − −
− − ∗ − + − − + +
Ly
(9)
To know the value of q t
( )
in the ssi requires estimating σssi, σosc, vx, yDOI: 10.4236/wjcmp.2018.84012 182 World Journal of Condensed Matter Physics
modeling of the panels shown in Figure 4. All the remaining parameters, i.e.
osc
σ , vx, vy, tσx, and tσy, are derived from the best fit of the experimental
data from Equation (1) to the model for V t
( )
in Equation (3). The quality of the fit, shown in Figure 3, is remarkable: it highlights the effectiveness of our model for the charge density σ( )
t in the ssi based on the law of conservationof energy in Equation (2). The magnitude of q t
( )
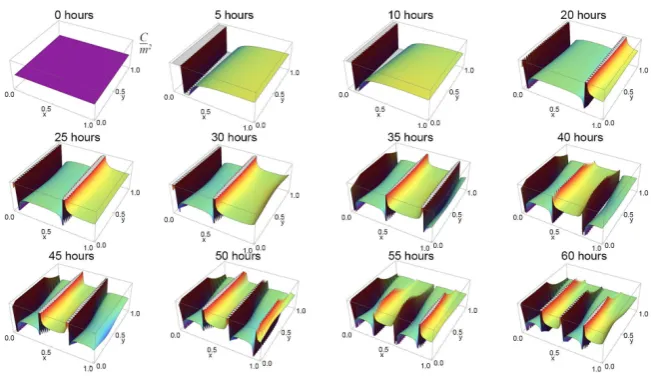
is of the order of fC(femto-Coulomb) [7]. In Figure 5, we used Equation (9) to picture the evolution in time of the surface charge density σ
( )
t in the case corresponding to Figure2(b), Figure 3(b) and Figure 4(b) with θ =0 0, C=148.5 pF, τ =28 fs,
25 mW
P≅ , Vssi =3.10 mV , Posc =0.25 mW , Σ =0 25.9 10 J C× −16 ,
0.27 C
T
∆ = , 8.88 nC m2
ssi
σ = , 0.00098 nC m2
osc
σ = , tcP =35 h , and
19 h
p
H = . In Figure 5 we clearly observe the periodic oscillations of σ
( )
t mixed with non-periodic functions. The interaction between the periodic and non-periodic functions makes the evolution of σ( )
t very complex. In particu-lar, we note an increase with time of the density of the oscillations over the capa-citor area.5. Conclusion
[image:12.595.211.537.401.589.2]Capacitors respond to electromagnetic waves producing a voltage. The voltage rapidly achieves a steady state value which we derive from the law of conserva-tion of energy. This result is important because it enables the estimaconserva-tion of the
Figure 5. Here we report the surface charge densities σ
( )
t evolution over the ~80hours duration of our measurements for the case of panel (b) in Figure 2, Figure 3 and
Figure 4. The parameters for this case are: θ0=0 , C=148.5 pF , τ =28 fs,
25 mW
P≅ , Vssi=3.10 mV, Vmin=3.05 mV occurring 60 hours after the start of the
illumination, Posc=0.25 mW, 0 25.9 10 J C16 −
Σ = × , ∆ =T 0.27 C , 8.88 nC m2
ssi
σ = ,
2 0.00098 nC m
osc
σ = , tcP=35 h, and Hp=19 h. The x and y axes represent the di-mensionless fractions fx and fy, respectively. The z axis represents the surface charge density in units of nC/m2. The surface charge density is described by Equation (9). Each
DOI: 10.4236/wjcmp.2018.84012 183 World Journal of Condensed Matter Physics
steady state value of the voltage in other phenomena involving the interaction of electromagnetic waves with capacitors (e.g. vision in vertebrates). The result however facilitates the understanding of other phenomena in which the electro-magnetic waves transfer their energy to mechanical energy or when rotational energy is transferred into the energy of the electromagnetic wave emitted in the rotation (e.g. the generation of the cosmic microwave background radiation). The relationship with the law of conservation of energy enables to track the overall effects of changes and perturbations in the various variables occurring in the phenomena. For example, we show that changes in the average power of the incident infrared light affect the surface charge density on the capacitor and thus the produced voltage.
Acknowledgements
This work was supported by the U.S. Office of Naval Research (awards # N000141410378 N000141512158), the JMU 4-VA Consortium (2016-2017), the Madison Trust—Fostering Innovation and Strategic Philanthropy—Innovation Grant 2015, the JMU Center for Materials Science, and the JMU Department of Physics and Astronomy.
Conflicts of Interest
The authors declare no conflicts of interest regarding the publication of this pa-per.
References
[1] Boone, D.E., Jackson, C.H., Swecker, A.T., Hergenrather, J.S., Wenger, K.S., Kok-han, O., Terzić, B., Melnikov, I., Ivanov, I.N., Stevens, E.C. and Scarel, G. (2018) Probing the Wave Nature of Light-Matter Interaction. World Journal of Condensed Matter Physics, 8, 62-88. https://doi.org/10.4236/wjcmp.2018.82005
[2] Sarker, B.K., Cazalas, E., Chung, T.-F., Childres, I., Jovanovic, I. and Chen, Y.P. (2017) Position-Dependent and Millimeter-Range Photodetection in Phototransis-tors with Micrometer-Scale Graphene on SiC. Nature Nanotechnology, 12, 668-674.
https://doi.org/10.1038/nnano.2017.46
[3] University of Colorado at Boulder. The Average Solar Irradiance Is 136.05 mW/cm2
according to Data Provided by the Laboratory for Atmospheric and Space Physics. [4] Soum-Glaude, A., Le Gal, A., Bichotte, M., Escape, C. and Dubost, L. (2017) Optical
Characterization of TiAlNx/TiAlNy/Al2O3 Tandem Solar Selective Absorber
Coat-ings. Solar Energy Materials & Solar Cells, 170, 254-262.
https://doi.org/10.1016/j.solmat.2017.06.007
[5] Gawiser, E. and Silk, J. (2000) The Cosmic Microwave Background Radiation.
Physics Reports, 333-334, 245-247. https://doi.org/10.1016/S0370-1573(00)00025-9 [6] Gordon, A.L., Schwab, Y., Lang, B.N., Gearhart, G.P., Jobin, T.R., Kaczmar, J.M., Marinelli, Z.J., Mann, H.S., Utter, B.C. and Scarel, G. (2015) Decoupling the Elec-trical and Entropic Contributions to Energy Transfer from Infrared Radiation to a Power Generator. World Journal of Condensed Matter Physics, 5, 301-318.
DOI: 10.4236/wjcmp.2018.84012 184 World Journal of Condensed Matter Physics
[7] St. John, T.C., Marinelli, Z.J., Kaczmar, J.M., Given, R.P., Wenger, K.S., Utter, B.C. and Scarel, G. (2016) Conversion of Infrared Light into Usable Energy. Proceedings of SPIE, 9927, 99270C.
[8] Vermeulen, L.A. and Wintle, H.J. (1970) Infrared Photoelectric Effects in Polyethy-lene. Journal of Polymer Science Part A-2: Polymer Physics, 8, 2187-2195.