Identifying Risk at the Conceptual Product Design Phase:
A Web-Based Software Solution and Its Evaluation
Katie Grantham, Cassandra Elrod, Barry Flaschbart, William Kehr
Missouri University of Science and Technology, Rolla, USA Email: [email protected]
Received January 31, 2012; revised February 24, 2012; accepted March 5, 2012
ABSTRACT
This paper introduces a web-based application that enables engineers or designers to identify risks during the concep-tual phase of a product design. This software application was developed based on the Risk in Early Design (RED) method developed by Author, Stone, and Tumer. The RED method demonstrates that risks can be identified in the early phase of product design by relating recorded historical failure information to product functions. Based on the concept of RED theory and current industry needs, the goals of a web-based RED application were defined. These goals are the intended benefits or functionalities that the web-based RED application would provide. In addition, a multi-level evaluation framework was adopted to determine how well the application meets the needs of various organizations. As part of the evaluation, a questionnaire was developed and administered to a sample industrial and academic user group. The results of the evaluation indicate that the web-based RED software application meets many of the goals to help an organization in performing product risk analysis.
Keywords: Product Design; Design Management; Risk Management; Risk Modeling
1. Introduction
The purpose of this paper is to present a knowledge based conceptual design software tool (the RED software appli- cation) to promote failure free design and to demonstrate its effectiveness through an evaluation. A knowledge base of recorded historical information is vital in preventing past failures of engineering products from recurring in future designs. Risk in Early Design (RED) is a knowl- edge based probabilistic risk assessment method that lev- erages historical failures to identify and quantify product risks even in their conceptual stage of development. The early availability of risk information allows improvements to be made to the design at a stage when the penalty for change is minimal. RED also prevents the need for having expert teams using expensive resources for risk identifica- tion and enables them to focus on risk mitigation, a better use of their expertise. This paper describes a web-based software solution to enable RED theory to be utilized by a multitude of entities for early risk identification and pre- vention. Further, the paper also presents an evaluation schema and a preliminary industrial evaluation to ensure the software solution meets the needs of it target users.
Current industry risk assessment tools require experts to identify potential failures of a product [1-8]. Expert- driven analysis, though valuable, is not flawless because of personal biases, cost and time constraints [9]. The RED method and subsequent software application was
developed to overcome these issues. This application plays a vital role between the product designers and fail- ure prevention. RED leverages design knowledge such as product functions and components and links them through a knowledge base to historical failure reports. This unique linkage enables even inexperienced designers or engineers to easily perform a risk analysis during the conceptual phase of product design.
evaluation tool to gather users’ feedback on the RED software application. Finally, the feedback results from users were analyzed to verify that the goals of the soft- ware application have been met.
2. Background
2.1. Risk Analysis Software
Current risk software available generally involves large- scale automation of the systems, in the form of enter- prise-wide risk management systems. These software systems also regularly use several techniques for predic- tion, estimation and risk diagnosis. The RAP (Risk Analy- sis Prototype) system was developed internally by the Jet Propulsion Laboratory for space exploration missions. It was designed for specially trained project teams and re-quires input from technical specialty areas. It considers risk throughout the design process, emphasizing commu-nication among experts. Resources required are consid-erable, including other specialty software applications, input from subsystem experts, and a complex communi-cation architecture [2].
IRMAS (Intelligent Risk Mapping and Assessment System) was developed through a collaboration between business and academic experts and is not available to the general public. IRMAS appears to be industry independ- ent, seeking to manage both the project life cycle and associated risks. It is a complex system, with wide data collection needs, designed for use by project managers as opposed to persons active in the early conceptual phases of new product development. The sytem requires input from many organizational levels, addressing eight dif- ferent areas of risk, and can capture and reuse lessons learned from previous projects [12].
Certus is a commercially available software system that can be purchased from Neohapsis, Inc., which also provides product training. Major customers include the federal government along with companies in the follow- ing industries: financial services, healthcare, insurance, manufacturing, and power/energy. Certus is part of Neo- hapsis’s risk consulting business and training; imple- mentation of the software includes training, planning, and assessment activities. The software is offered as a sin- gle system to minimize complexity. Aimed at company- wide day-to-day operations, Certus consolidates risk man- agement and a variety of compliance issues [13].
Designsafe is used in a wide range of industries; how- ever, packing machinery and robotics associations were instrumental in creating the software. Potential users can download a free demo. Training is available on DVD for $325. Designsafe improves product designs by letting design engineers complete risk/hazard assessment for their products and proesses while also allowing ongoing assessments and scenario investigations. The system is
customizable, and includes networking and library and file sharing [4].
CORA is a software system available for purchase from All Hazards Management, a company that concen- trates on emergency preparedness. CORA is one of three major software systems available; the other two deal with information management and assessment and emergency response management; CORA deals with costs. The sys- tem can recycle the efforts of risk experts whle using field personnel to collect data. It is primarily aimed at on-going operations threats and planning for emergencies; it demonstrates the financial impacts of risks, and allows scenarios [7].
CHAMPS, Inc. began as a nuclear power plant con- struction and startup engineering firm. The CHAMPS product is a commercial software system. Customers listed on the company’s web site include four electric power generation/distribution companies and Quaker Oats. The system is advertised as an enterprise asset management, customer relationship management, and business intelli-gence tool. CHAMPS offers free on-line product training seminars [8].
2.2. Software Evaluation Methods
Organizations often procure and use software without considering any sort of evaluation of that software [11]. When software systems are considered for institutional use, it is critical to determine the effects the software will have on the organization. During software product evalua- tion, the ability of the software product to meet the user’s needs of that product are determined [14]. Rombach states that in order for measurement to be successful, ef- fective “top-down” strategies that derive metrics and asso- ciated measures from goals and interpret measurement data in the context of goals are needed [15]. Approaches using a “top-down” manner of identifying useful metrics from goals include the Software Quality Metrics (SQM) approach by Murine [16], which is based on prior work by Boehm [17] and McCall [18], the Quality Function Deployment (QFD) approach by Kogure and Akao [19], and the Goal/Question/Metric (GQM) approach by Basili [20,21].
vidual measurements, metrics, and they are decided in response to the necessity for each criteria chosen.
QFD is a method for developing a design quality aimed at satisfying the consumer and then translating the consumers’ demands into design targets and major qual- ity assurance points to be used throughout the production stage [4]. In planning a new product, QFD starts with the customer requirements, which are identified and defined through market research. This is called a product devel- opment process, which includes program planning, con- ceptualization, optimization, development, prototyping, testing, and manufacturing functions. The development process is very complex and often cannot be performed by one individual. It is precisely the complexity of QFD that all too often causes the product development process to create a product that fails to meet the customer re- quirements.
The GQM approach is based upon the assumption that for an organization to measure in a purposeful way it must first specify the goals for itself and its projects, then it must trace those goals to the data that are intended to define those goals operationally, and finally provide a framework for interpreting the data with respect to the stated goals [7]. Thus it is important to clearly under- stand what informational needs the organization has, so that these needs for information can be quantified and the quantified information can then be analyzed as to whether or not the goals are achieved. The GQM approach pro- vides the three key elements embodied in its name: Goal, Question, Metrics. At a conceptual level, a goal is de- fined for an object, for a variety of reasons, with respect to various models of quality, from various points of view, relative to a particular environment [7]. At an operational level, a set of questions is used to characterize the way the assessment or achievement of a specific goal is going to be performed based on some characterizing model [7]. At the quantitative level, a set of data is associated with every question in order to answer it in a quantitative way [7].
On comparing the three approaches, SQM and QFD are limited to product quality, whereas GQM can be used for process as well as product quality [22]. QFD is a complex and long process. The GQM approach is a sys- tematic way to tailor and integrate an organization’s ob- jectives into measurement goals and refine them into measurable values [23]. GQM was developed for use with software improvement projects, and it is used in a majority of research and development software projects [11]. The GQM paradigm prescribes setting goals in op- erational and tractable ways where goals are refined into a set of quantifiable questions that specify metrics. Data are tied to specific metrics that, in turn, are tied to spe- cific goals [11]. An example to show how goal, question and metrics can be tied based on GQM is presented be-
low. The GQM method was used to identify the most appropriate metrics for assessing the software inspection process conducted by AT&T developers [24].
Goal: Monitor and control.
Question: What is the quality of inspected software? Metrics: Avg. faults per KLOC, Avg inspection rate. Note: KLOC (thousands of lines of code) is a tradi- tional measure of software size; it is often related via empirical formulas to or how long or how many people it will take to complete a software development project.
The above metrics are defined for the technical or algo- rithm level software evaluation. Technical or algorithm level evaluation determines the quality of a product. RED evaluation primarily focuses on organizational needs and to ensure if the needs are fulfilled via the software solu- tion. Therefore, technical or algorithm level evaluation was not a major concern in the web-based RED software evaluation. Further, industry feedback about the web- based RED software application will be taken into con- sideration; performing a quality evaluation will be mean- ingful at that time. Since SQM and QFD primarily focus on quality, therefore, they were not chosen for the web-based RED software evaluation. GQM is one of the most widely used methods of its class; it focuses on proc- ess in addition to quality. After consideration, though, none of these methods were used directly. The software evaluation did, however, recognize the benefits of the GQM methodology and its multi-level evaluation frame- work. The objective of the web-based RED software evaluation in this paper is not to perform technical or al- gorithm level evaluation but to provide a way to decide and define “what to measure” and “how to measure” the software solution in order to conclude that the organiza- tional needs are met. Therefore, the multi-level frame- work was adopted, which provides measures that differ- entiate conceptual elements from implementation-specific elements that GQM does not provide [11]. These ele- ments are considered as further refinements to the GQM methodology. Here, the conceptual measure helps to identify the type of data to be collected (what to measure) and the implementation-specific measure helps to identify the collection method (how to measure). The data collec- tion results conclude whether or not the goals of the solu- tion are met.
3. Risk in Early Design (RED) Software
3.1. RED Theory
EC × CF = EF (1)
The matrices in Equation (1) are the function-compo- nent matrix (EC), the component-failure matrix (CF), and the function-failure matrix (EF). These are the critical matrices that make up the knowledgebase that the soft- ware performs risk calculations on.
RED uses matrix-based risk assessment to easily iden- tify specific function-failure mode combinations that have historically occurred and to quantify that informa- tion into consequence and likelihood based on the out- come of the historical events [25]. Because this method uses documented historical function-failure combinations, even novices will be able to use it to determine potential risks in the products. Also, RED’s historical foundation helps to remove personal bias [25]. RED can be applied even in the conceptual phases of product design. Avoid- ing risks at this stage is less costly because the product’s physical form has not yet been determined.
Communication of the risks generated by RED is ma- nipulated so that the risks are compatible with the risk fever chart [25]. The risk fever chart was originated by Defense Acquisition University (DAU) [26]. This chart consists of a plot of consequence versus likelihood of risks. The RED method is mapped such that both cones- quence and likelihood have integer values ranging from one to five.
The categories in the RED heuristics are: system level, subsystem level, human centric, and unmanned. System Level is a design state that considers the product as a whole; Subsystem Level is a design stage that considers subsystems or smaller pieces of the product; Human cen- tric is a product that requires human input for its opera- tion; and unmanned product is a product that does not require direct human interaction during operation.
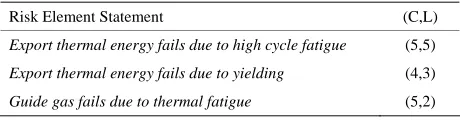
Author et al. [25] illustrated a RED risk assessment performed on a functional model of a Thermal Control Subsystem. From the functional model of the Thermal Control Subsystem the functions from the functional ba- sis were collected and used to select entries of the func- tion-component (EC) matrix. Using the EC matrix thus formed, the product-specific function failure (EFprod) matrix was determined. Next, the risk likelihood and con- sequence calculationswere performed using the function- component (EC) matrix and component-failure severity (CF’) matrix. The sample of risks identified from the RED risk assessments performed on the thermal control sub- system risk assessments are shown in Table 1. A soft- ware application to perform these risk calculations will greatly improve the usability of the RED method and the reliability of electro-mechanical products.
3.2. RED Software Goals
[image:4.595.308.538.111.171.2]The evaluation in this paper is aimed at establishing the
Table 1. Sample risks from thermal control subsystem RED risk assessments.
Risk Element Statement (C,L)
Export thermal energy fails due to high cycle fatigue (5,5)
Export thermal energy fails due to yielding (4,3)
Guide gas fails due to thermal fatigue (5,2)
RED software application’s effectiveness, that is, how well the RED software application fits the needs of an organization with respect to product risk analysis during conceptual design. Looking at organizational factors af- fecting acceptance of new technology, Meyer [27] lists 4 factors that are important in achieving implementation of a new technology. First are the expectations of the or- ganization and employees; how the product performs in relation to what they were lead to believe, thought or hoped for. Second is the performance of the innovation, in this case the RED application. Third is conflict within the organization, not dissimilar to the situation discussed above. Finally is the extent of adaptation to the existing organization that is needed when bringing in the new technology or, in this case, software.
With all these considerations, a generic software solu- tion is developed to perform risk analysis of any Indus- trial product. This provides features for the users to per- form risk analysis for any product as long as it complies to the RED input data format. Hence, a careful and thoughtful consideration is given to the choice of evalua- tion framework to define the goals of the RED software application, wherein these goals are not biased to any specific industry (i.e. they are industry-independent goals). The web-based RED application leverages the multilevel evaluation framework developed by Jean Scholtz and Michelle Potts Steves from the National institute of Stan- dards and Technology, USA [11]. This is a multilevel framework that helps to structure evaluations by mapping system goals to evaluation objectives, metrics, and meas- ures. Five goals of the RED software application were defined as follows as part the development framework. Along with the listing of these goals, their relationship to the state-of-the art (RSOA) in available risk assessment tools is provided.
Goal 1: To provide a widely accessible risk assess- ment tool.
RSOA: The tools described in Section 2.1 are either unavailable to the public or must be purchased.
Goal 2: To provide an independent risk assessment tool.
RSOA: While some of the systems discussed were not closely tied to any industry, most had a somewhat narrow applicability.
RSOA: The complexity of the commercially available systems is a major drawback. Further, the reliance on experts to identify the risks prior to analysis is also an inhibitor for designers.
Goal 4: To provide a risk assessment tool that can be used as early as the conceptual phase of product design.
RSOA: The systems identified in Section 2.1 require detailed product designs as minimum to perform and/or track product risks.
Goal 5: To provide a tool that reduces resources re- quired to perform a risk analysis.
RSOA: The complexity and cost of the available risk assessment tools do little or nothing to reduce the man- hours or machine power to assess risks.
These goals were used to design the web-based RED software as described in Section 3.3.
3.3. RED Software Design Features
The first goal of the web-based RED application was to provide a widely accessible risk assessment tool. By its nature, a web-based solution satisfies this need better than an application to be installed and run in each situation. Further, a web-based application can be accessed from anywhere, with the help of the Internet. The second goal of the RED application focuses on providing a risk as- sessment tool that can be used by many industries. To achieve this goal, the application provides options for performing risk analysis based on user-defined data. User-defined data are the historical failure reports from the industry. The only requirement is that they must ad- here to the RED matrix data format. Uploading options on the web-based application fulfill the goal. As a result, any industry can upload their product historical failure reports to perform risk analysis. The third goal was to provide a tool that enables even inexperienced engineers to assess risk. Hence the application’s ease of use and expressive capability were major concerns here. Expressive capabil- ity is the presence or absence of various options in the application. Therefore, the application had to be devel-
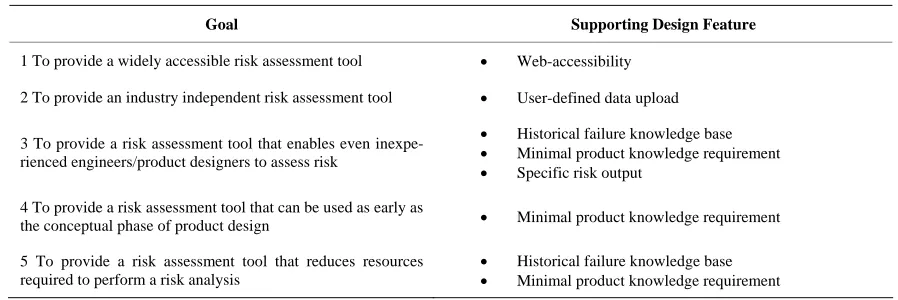
oped with all the basic functions and capabilities that an inexperienced user would expect it to have. In addition, to avoid complexity, the solution must help the user to ac- complish the risk analysis task in a few steps as well as be easy to learn and understand. The fourth goal was to pro- vide a risk assessment tool that could be used as early as the conceptual phase of product design. The application provides results with essential information that enables users to make better decisions during the early phase of product design. The fifth goal of the RED application was to provide a risk assessment tool that reduces resources required to perform the analysis. Therefore, the applica- tion is designed to reduce cost in terms of time and per- sonnel. Table 2 provides a mapping that shows how spe- cific design features of the software support the goals.
3.3.1. Web-Accessibility
A free web-based solution was chosen as the design fea- ture to provide a widely accessible risk assessment tool. Access to a knowledgebase of electromechanical product failures enables product designers to focus on risk miti- gation during their design process rather than failure re- search. Also, internet accessibility allows the RED soft- ware users to access the most up to date knowledgebase and perform risk assessments without the need for in- stalling software, checking computer compatibility, or checking for updates to the failure knowledgebase.
3.3.2. Historical Failure Knowledgebase
As stated previously, RED enables risk identification with the use of a knowledgebase of historical product failures. The derived engineering languages for functions [28], components [29], and failures [30] are the backbone for effective construction of a RED knowledgebase. Pre-vious research efforts focused on the construction of the electromechancial product failure knowledgebase [31] which is available for use in the RED program. The fail-ure reports currently cataloged in the knowledgebase
[image:5.595.72.521.581.731.2]ome from National Transportation and Safety Board c
Table 2. Goal based RED software design features.
Goal Supporting Design Feature
1 To provide a widely accessible risk assessment tool Web-accessibility 2 To provide an industry independent risk assessment tool User-defined data upload
3 To provide a risk assessment tool that enables even inexpe-rienced engineers/product designers to assess risk
Historical failure knowledge base
Minimal product knowledge requirement
Specific risk output 4 To provide a risk assessment tool that can be used as early as
the conceptual phase of product design Minimal product knowledge requirement 5 To provide a risk assessment tool that reduces resources
required to perform a risk analysis
Historical failure knowledge base
(NTSB) reports, consumer product failure reports, ASM handbooks, etc. The benefit of having a historical know- ledgebase of product failure available from which to identify risks allows even novice product designers “ex- perience” that allows them to make critical design deci- sions early in the process thus saving time, resources, and eventually consumers from harm.
3.3.3. User-Defined Data Upload
Since risk exists in all domains, it is not sufficient to simply be able to calculate the risk of electromechanical products. The general equations for RED can be applied to other domains for assessing risk [25]. All that is nec- essary for the risk domain change is an appropriate data- base of historical failures. For example, Vucovich, et al. [32], used RED theory to calculate the risks of software products. Furthermore, Patil, et al. [33] have used RED to perform risk assessments in the business domain, and Author et al. [31] have leveraged the RED theory to pre- dict risks for the implementation of lean manufacturing products [34] as well. Therefore, the web-based RED software includes a feature that enables users to upload their own database (or user-defined data) to assist in their risk assessments.
User-defined data are historical failure reports that must adhere to the RED matrix data format. Uploading options on this web-based application allow this capabil- ity and fulfill the goal. As a result, any industry can up- load their product historical failure reports to perform risk analysis should they want to use their own electrome- chanical product database or analyze risk in a different domain. If the user-defined input data fails to meet the formatting requirements, then the user will be prompted with error messages. The messages were designed to in- dicate the type of error, in order to ease upload for the user. For example, matrix dimensional errors and file type errors are called out to the user.
3.3.4. Minimal Product Knowledge Requirement The product-specific knowledge required to perform a risk analysis with RED is minimal. This feature primarily allows risk analyses to be performed earlier in the design process, an important quality not found in other available risk assessment software. The product-specific knowl- edge required to use RED includes product functionality, product type (human-centric or unmanned), and the de- sign level of risk analysis desired (sub-system or system level). The first two required areas of product knowledge can be derived directly from customer needs that often initiate the design process for new products [28]. The final product knowledge requirement is most often inter- nal to the organization performing the risk analysis. For example, if the risk analysis is being performed on the drive train of an automobile, the subsystem risk analysis
would be selected by the RED user to identify the most risky areas in the drive train. However, if the user desires to perform a risk analysis on the entire vehicle, perhaps to determine its feasibility to continue through the design process, that user would select a system level risk analy- sis. Though detail design criteria such as material selec- tion, performance parameters, etc. are not needed to ini- tiate a risk assessment through RED, it is intended that the user will incorporate this information to update the risk analysis as it becomes available.
3.3.5. Specific Risk Output
The RED software application outputs the risk results in two forms. The first is a Fever Chart [26] where the green area represents low risk, the yellow area represents moderate risk, and the red area represents high risk. The chart shows consequence on the horizontal axis and like- lihood on the vertical axis. The number displayed in the color-coded area represents the number of risk elements with that likelihood and consequence value. This com- mon graphical representation of risk enables users to quickly gage the risk status of their system.
The second type of risk output is a text file featuring specific risk statements. The risk statement provides a clear, concise, and informative message so a user easily understands the risk. Every risk statement is displayed in a the following format:
“Function fails due to Failure Mode at (Consequence Value, Likelihood Value)”.
The risk statement file groups the risk statements into the high, moderate, and low categories and is formatted so it is compatible with spreadsheet software.
The application, as developed, provides a menu with instructions for the user. The instructions take the form of a series of steps, with “clickable” selections to carry out appropriate actions. The instructions/steps are listed below:
Step 1: Engineers must prepare functions of the prod- uct design that are to undergo risk analysis.
Step 2: Start the RED application.
Step 3: If the risk analysis is for an electromechanical product, the designer may choose the S&T database to perform risk analysis.
(Note: The S&T database supports electromechanical products only. If not an electromechanical product, the user can upload user-defined data that is populated based on historical product failure information. User-defined data must comply with RED matrix dimension standards.)
Step 4: If the S&T database is the choice for perform- ing risk analysis, then go to Step 9; else, go to Step 5.
Step 6: After uploading user-defined data, it confirms file upload the matrix dimension.
Step 7: If the verification status is successful, then go to step 8; otherwise, go to step 5.
(Note: Verification may fail due to a wrong input file type or if the input data does not comply with the RED input data format.)
Step 8: User-defined data is now available to undergo risk analysis.
Step 9: The RED application displays product func- tions and the user can choose the desired product func- tions that must undergo risk analysis.
Step 10: The user must now choose the appropriate design level and product type for the product under risk analysis.
Step 11: The application displays the fever chart and generates a risk file to be downloaded by the user.
Step 12: The user can review the risk statement to help make decisions about the product design.
Step 13: Termination of the RED application.
4. RED Software Evaluation
After the development of the web-based RED application, the next step was to ensure that the goals defined in the evaluation framework were met. To perform this assess- ment, a questionnaire-based evaluation model was adopted. The questions were framed based on the goals defined in the RED evaluation framework. User responses to these questions help determine whether the web-based RED application meets the defined goals.
4.1. Software Evalutaion Metrics
The evaluation framework consists of five elements or levels: system goals, evaluation objectives, conceptual metrics, and measures, both conceptual and implementa- tion-specific. The framework element system goal is the intended benefit or functionality the software system will provide. This goal may reflect a technical performance goal for the software system or an organizational goal. The next level of framework is the evaluation objective level. Each objective drives a particular part of an evaluation, within the context of its associated system goal. Evaluation objectives (EO) partition evaluation concerns in the overall assessment of a particular goal. A metric is the interpretation of one or more contributing elements, examples, measures or other metrics, corre- sponding to the degree to which the set of attribute ele- ments affects its quality. A measure is an observable value, while a metric associates meaning to that value by applying human judgment, often through a formula based on weighted values using the contributing measures. Each evaluation goal will have one or more conceptual metrics. Metrics, when assessed with their associated
measures, will contribute to an assessment of how well a particular system goal was met. The lowest two levels in the framework constitute measures: conceptual and im- plementation-specific. Conceptual measures identify the type of data to be collected. Implementation-specific measures identify the specifics about a particular collec- tion instance, for example, data element(s), associated tool, collection method [11].
4.2. Evaluation Questionaire Development
Each goal has one evaluation objective and every evalua- tion objective has at least one metric defined. Every met- ric, in turn, has its own measures wherein user ratings are considered and has an implementation-specific measure in every goal. Thus, a questionnaire was considered as an effective tool for collecting user ratings. Questions are mapped to the appropriate goals.
The questionnaire was designed to measure the goals using the evaluation metrics presented in Section 4.1. Two set of questionnaires were given to the students—a User Evaluation Questionnaire and a RED Tool Evalua- tion Questionnaire.
User Evaluation Questionnaire—Questions were
framed with an aim of understanding the user experi- ences and knowledge about Risk analysis concepts and tools. These questions were designed to assist in the un- derstanding of the skill levels in the sample population.
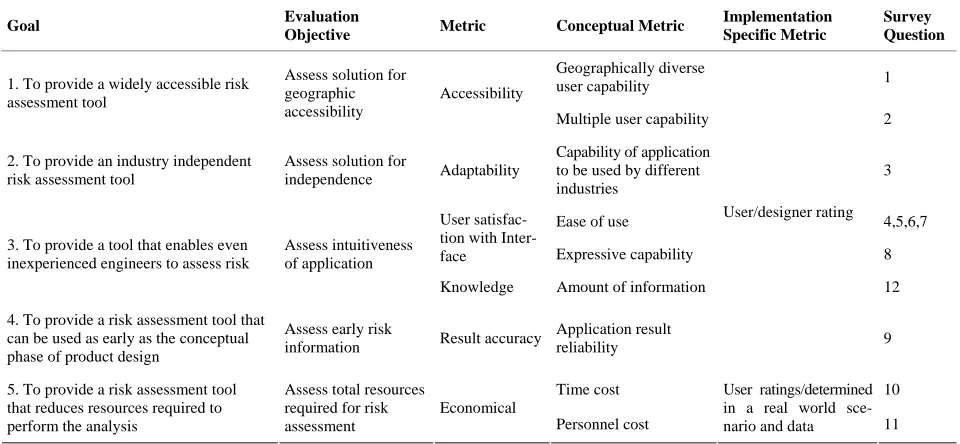
RED Tool Evaluation Questionnaire—These ques- tions were framed in order to enable mapping to the goals of the web-based RED application. Questions found in the questionnaire were actually framed based on the RED solution goals. Table 3 shows how questions were mapped to the goals of the RED solution. For easy refer-ence, only the goal and question numbers are listed in the table. For example, Questions 1 and 2 of the RED tool evaluation questionnaire were mapped to goal 1: “To provide a widely accessible risk assessment tool”. The respondents were asked to rate each question on a 5-point Likert scale of 1 to 5, where 1 represents strong dis- agreement (which is the least user satisfaction rating) and 5 represents strong agreement (which is the maximum user satisfaction rating for any question).
5. Evaluation Results
Ideally, the evaluation would be performed by a large and diverse group of engineers. An initial smaller group was utilized in order to obtain rapid feedback. Additional evaluations need to be pursued in the future.
5.1. Respondent Knoledge Level
Table 3. RED tool evaluation question mapped to goals.
Goal Evaluation
Objective Metric Conceptual Metric
Implementation Specific Metric
Survey Question
Geographically diverse
user capability 1 1. To provide a widely accessible risk
assessment tool
Assess solution for geographic accessibility
Accessibility
Multiple user capability 2 2. To provide an industry independent
risk assessment tool
Assess solution for
independence Adaptability
Capability of application to be used by different industries
3
Ease of use 4,5,6,7 User satisfac-
tion with Inter-
face Expressive capability 8 3. To provide a tool that enables even
inexperienced engineers to assess risk
Assess intuitiveness of application
Knowledge Amount of information 12 4. To provide a risk assessment tool that
can be used as early as the conceptual phase of product design
Assess early risk
information Result accuracy
Application result reliability
User/designer rating
9
Time cost 10 5. To provide a risk assessment tool
that reduces resources required to perform the analysis
Assess total resources required for risk assessment
Economical
Personnel cost
User ratings/determined in a real world sce-nario and data 11
in the Function Based Failure Analysis course offered at Missouri S & T were considered as respondents for this evaluation. This course provides a solid knowledge of Risk analysis techniques or methods on any product. The students were graduate students who were employed full time at both Boeing and Lockheed Martin. Their range in industrial experience was 5 - 25 years. The user evalua- tion results for question 1 indicates that the users chosen to evaluate this RED application possess a good knowl- edge of product risk analysis concepts. 50% of the users have rated themselves as having “Very Good Knowl- edge” and 50% have rated themselves as “Good”. Hence, these users would be ideal to evaluate the application and appreciate its value.The user evaluation results of ques- tion reveals that no experts were chosen to evaluate this application. However, 40% of the users are advanced, 40% of the users are intermediate, and 20% have no ex- perience with other risk analysis tools. Prior to evaluating the web-based RED application, most of the sample population were given some knowledge of the applica- tion. Thus the sample population’s level of experience with this RED tool ranges from expert to basic. 33% of the users were basic, 33% were intermediate, 17% were advanced, and 17% were expert.
5.2. RED Application Evaluation Results
The overall sample population’s responses were then verified against the goals. In evaluation of Goal 1, 67% of the responses were “strongly agreed”, 25% “agreed” and 8% “do not know”. Hence, we conclude that the ap- plication has met the goal to provide a widely accessible risk assessment tool.The evaluation of Goal 2 was also overwhelmingly positive in that the users believe that the
RED tool is industry independent with the following re- sults: 67% of the sample population “strongly agreed”, 17% “agreed” and 17% “do not know”.
In the evaluation of Goal 3 (providing a tool that en- ables even inexperienced engineers to assess risk), 47% of the sample population “strongly agreed”, 43% “agreed”, 7% “do not know” and 3% “disagree”.Therefore, 90% of users validated the RED applications utility for inexperi- enced engineers.
Goal 4’s evaluation scores were the following, where 33% of the population “strongly agreed” and 67% of the sample population “agreed”. In this case, the result is totally positive because the sample population had a strong understanding of RED concepts. We also saw that the sample population possesses good knowledge of product risk analysis concepts. Thus, they were able to appreciate the value of this application in assessing early risk information.
In the evaluation results of Goal 5, 52% of the sample population “strongly agreed”, 42% “agreed” and 8% “do not know”. These scores indicate that the RED tool re- duces resources required to perform risk assessments.
6. Conclusions and Future Work
The majority of user feedback is positive. These evalua- tion results indicate that the goals of the RED application have been met for the users who evaluated it. However, the evaluation group was small and contained only a few individuals with significant “industry” experience. Fur- ther work to have additional evaluations carried out by industry organizations is needed.
should be made available for rapid download and use, making the tool even more broadly useful.
7. Acknowledgements
The authors would like to thank Karthik Sundaram for the tremendous effort he put forth in coding the RED program. Also, we would like to thank Dan Nieters for his efforts in making the program available on the web.
REFERENCES
[1] L. Rosenberg, T. Hammer and A. Gallo, “Continuous Risk Management at NASA,” Proceedings of Quality Week Conference, San Francisco, May 1999.
[2] L. Meshkat, S. Cornford and T. Moran, “Risk Based De- cision Tool for Space Exploration Missions,” Proceed- ings of the AIAA Space Conference, Long Beach, Sep- tember 2003.
[3] Securac Incorporated. http://www.securac.com
[4] Design Safety Engineering Web Site. http://www.designsafe.com/dsesoftware.php
[5] http://www.ist-usa.com/
[6] http://www.safetyscorekeepers.com/
[7] All Hazards Management Web Site.
http://www.allhazardsmanagement.com/cora.htm
[8] Champs, Incorporated Web Site. http://www.champsinc.com
[9] S. Karthik, C. Abhishek and D. Derek, “Identifying Risk at the Conceptual Phase of Product Design: A Software Solution,” ASME Conference Proceedings, Vol. 2, 2007, pp. 291-298. doi:10.1115/DETC2007-35473
[10] L. Meskhat, S. Cornford, L. Voss and M. Feather, “An Integrated Approach to Risk Assessment for Concurrent Design,” IEEE Aerospace Conference, Big Sky, 5-12 March 2005, pp. 80-88.
doi:10.1109/AERO.2005.1559301
[11] S. Jean and P. S. Michelle. “A Framework for Real-World Software System Evaluations,” Proceedings of the 2004 ACM Conference on Computer Supported Cooperative Work, Vol. 6, No. 3, 2004, pp. 600-603.
doi:10.1145/1031607.1031710
[12] B. Kayis, M. Zhou, Y. B. Khoo, A. Ahmed, R. Kusumo and A. Rispler, “IRMAS—Development of a Risk Man- agement Tool for Collaborative Multi-Site, Multi-Partner New Product Development Projects,” Journal of Manu- facturing Technology Management, Vol. 18, No. 4, 2007, pp. 387-414. doi:10.1108/17410380710743770
[13] Neohapsis Web Site. http://www.riskgovernance.com/
[14] T. Punter, R. Van Solingen and J. Trienekens, “Software Product Evaluation—Current Status and Future Needs for Customers and Industry,” 4th Conference on Evaluation of Information Technology, Delft, 30-31October 1997, pp. 1-11.
[15] M. P. Steves and J. Scholtz, “Metrics Mapping Concepts,” NISTIR 7061, National Institute of Standards and Tech-
nology, Gaithersburg, 2003, pp. 1-12.
[16] G. E. Murine, “Applying Software Quality Metrics in the Requirements Analysis Phase of a Distributive System,” Proceedings of the Minnowbrook Workshop, Blue Moun- tain Lake, New York, 1980.
[17] B. W. Boehm, J. R. Brown and M. Lipow, “Quantitative Evaluation of Software Quality,” Proceedings of the 2nd International Conference on Software Engineering, Los Alamitos, 1976, pp. 592-605.
[18] J. A. McCall, P. K. Richards and G. F. Walters, “Factors in Software Quality, (RADC TR-77-369),” National Technical Information Service, Alexandria, 1977.
[19] M. Kogure and Y. Akao, “Quality Function Deployment and CWQC in Japan,” Quality Progress, Vol. 16, No. 10, 1983, pp. 25-29.
[20] V. R. Basili and H. Rombach, “Tailoring the Software Process to Project Goals and Environments,” Proceedings of the 9th International Conference on Software Engi- neering, 1987, pp. 345-357.
[21] V. R Basili and D. M. A Weiss, “Methodology for Col- lecting Valid Software Engineering Data,” IEEE Transac- tions on Software Engineering, Vol. SE-10, No. 3, 1984, pp. 728-738. doi:10.1109/TSE.1984.5010301
[22] H. D. Rombach, “Practical Benefits of Goal-Oriented Measurement,” In: N. Fenton and B. Littlewood, Eds., Software Reliability and Metrics, Elsevier Science Pub-lishing Co., London, 1991, pp. 217-235.
[23] F. V. Latum and R. V. Soligen, “Adopting GQM-Based Measurement in an Industrial Environment,” IEEE Soft-ware, Vol. 15, No. 1, 1998, pp. 740 -7459.
[24] GQM Method Application, 2008.
http://www-ivs.cs.uni-magdeburg.de/sw-eng/us/java/GQ M/link3
[25] I. Tumer, “Function Based Risk Assessment: Mapping Function to Likelihood,” Proceedings of DETC’05, Vol. 5a, Long Beach, 24-28 September 2005, pp. 455-467. doi:10.1115/DETC2005-85053
[26] Office of the Under Secretary of Defense, “DSMC Risk Management Guide for DoD Acquisition,” 2nd Edition, Defense Systems Management College Press, Fort Bel- voir, 1999.
[27] A. D. Meyer and J. B. Goes, “Organizational Assimila- tion of Innovations: A Multilevel Contextual Analysis,” Academy of Management Journal, Vol. 31, No. 4, 1988, pp. 897-923. doi:10.2307/256344
[28] J. Hirtz, R. Stone, D. McAdams, S. Szykman and K. Wood, “A Functional Basis for Engineering Design: Rec- onciling and Evolving Previous Efforts,” Research in En-gineering Design, Vol. 13, No. 2, 2002, pp. 65-82.
[29] C. Bryant, R. Stone, J. L. Greer, D. McAdams, T. Kur- toglu and M. Campbell, “A Function-Based Component Ontology for Systems Design,” Proceedings of the 16th International Conference on Engineering Design, Paris, France, 28-31 August 2007, pp. 119-120.
Design, Stockholm, 19-21 August 2003, pp. 109-124.
[31] R. Stone and T I. umer, “Failure Prevention through Ef- fective Cataloguing and Utilization of Historical Failure Events,” Journal of Failure Analysis and Prevention, Vol. 8, No. 5, 2008, pp 469-481.
doi:10.1007/s11668-008-9160-7
[32] J. Vucovich, R. Stone, X. F. Liu and I. Tumer, “Early Identification of Potential Software Failures Using the Software Function-Failure Design Method,” 29th
Inter-national Conference on Software Engineering, Minnea- polis, 20-26 May 2007.
[33] R. Patil, “Business Risk in Early Design (BRED): A Business Risk Assessment Approach,” Engineering Man- agement Journal.