Quantitative Analysis of Formation of Active Avoidance
Behavior in the Hippocampus Coagulated and Intact
White Albino Rats
Sulkhan N. Tsagareli1, Nino G. Archvadze1, Otar Tavdishvili2
1
Biology Department, Faculty of Exact and Natural Sciences, Ivane Javakhishvili Tbilisi State University, Tbilisi, Georgia
2
Department of Applied Systems for Pattern Recognition, Institute of Cybernetics, Georgian Technical University, Tbilisi, Georgia Email: {sulkhan.tsagareli, nino.archvadze}@tsu.ge, [email protected]
Received July 9,2011; revised November 9, 2011; accepted November 30, 2011
ABSTRACT
Unsupervised cluster analysis is proposed for analysis of active avoidance formation in three groups of albino rats: 1) Intact; 2) With electrolytic lesions of neocortex over the dorsal hippocampus; and 3) with electrolytic lesions of dorsal hippocampus. The term “behavior vector” has been introduced to assess quantitatively the behavior of rats while learn-ing. The proposed approach enables to assess active avoidance behavior in rats simultaneously by all the test parameters: 1) Reaction to the light; 2) Reaction to the electric irritation; and 3) Inter-trial spontaneous behavior. The animals were grouped by their behavioral resemblance through the learning process. The proposed method facilitates the assessment of learning capacities in animals and paves way for getting additional information concerning correlative relationships between their learning skills and other neuroethological and neurobiological parameters.
Keywords: Behavior; Learning; Memory; Active Avoidance; Hippocampus; Neocortex; Unsupervised Clustering
1. Introduction
Sometimes it seems difficult to generalize the outcomes of behavioral studies due to a large amount of experi- mental evidence on the features involved in formation of adequate behavioral strategy. Thus, a mathematical ap- proach to the problem in general, and quantification of the measured parameters in particular, should be consid-ered as most reasonable means to identify behavioral fea- tures and interpret obtained numeric data. Nowadays su- ch approach is common to behavioral studies.
A wide range of mathematical methods has been pro-posed for the assessment of cognitive mechanisms invol- ved in adaptive learning, repetitive decision tasks, rein- forcement and strategic changes [1-5]. These references along with the related work have contributed to under-standing in depth the processes underlying behavioral neuropsychology [6]. The clustering methods with dif-ferent approaches and difdif-ferent focuses were used in studies on learning, memory and behavior [7-13]. Mathe- matical methods generally gained a prominent position within behavioral studies over the last centuries [1].
Accordingly, the objective of our study was to exam- ine and confirm possibility of application of unsupervis- ed cluster analysis algorithm for quantitative description of behavioral conformities through active avoidance ac- quisition in different population of albino rats [14,15].
Such approach enables to assess active avoidance acqui-sition revealing behavioral differences and similarities among the animals within groups [16].
Efforts to reveal neuropsychological explanation to dif- ferent behavioral processes were directed towards identi- fication of brain structures involved in different types of learning and memorizing. Hippocampus represents a struc- ture specifically related to learning and mediation of be-havioral processes [17-22]. We intended to contribute to the investigation of functional significance of dorsal hip- pocampus in implementation of different behavioral tasks by cluster analysis.
Animals’ learning abilities assessed by acquisition of active avoidance were found to vary within the test groups. Some of the animals were unable to meet learning crite- ria and consequently, several groups of animals with dif- ferent behavioral capabilities—were identified and each group included the animals with similar behavioral fea-tures. The method of automatic classification (cluster analy- sis) was applied in order to extract such groups from the three populations of white rats: intact (INT); with elec- trolytic coagulation of neocortex above the dorsal hippo- campus (NCC) and with electrolytic coagulation of dor- sal hippocampus (DHPC).
for partitioning of rats according to their behavioral simi- larities were applied [14,15].
The term “behavior vector” for multiparameter descrip- tion of behavior in learning process was introduced. The components of the vector were behavioural parameters measured for each animal and they took different nu- merical values during the experiment.
Such approach enables to classify the animals by their learning abilities into groups according to the degree of behavioral similarity. The behavioral parameters (fea-tures) getting different numerical values during the ex-periment compose the components for the behavior vec-tor.
The observed behavioral parameters assessed experi-mentally were: 1) reactions to the light—avoidance reac-tions; 2) reactions to the painful foot-shock evaluated in frequencies—escape reactions; and 3) inter-trial sponta-neous behavior, measured in numbers of jumping onto shelves. As all the three parameters were targeted and served to preserve from painful stimuli, we characterized the active avoidance learning by general analysis of val-ues encompassing all the three parameters in total.
2. Methods
2.1. Subjects
Three different groups of 31 albino rats of both sexes (with an average body weight of 150 g) were examined. The animals were individually housed in stainless steel cages in a room with natural lightdark cycle and constant temperature of 20˚C ± 1˚C. The rats had free access to food and water throughout the experiment. The animals were numbered before the experiment and divided into three groups designated as Group A (intact; No. 1 - 13; n = 13), Group B (NCC; No. 41 - 49; n = 9), and Group C (DHPC; No. 32 - 40; n = 9).
2.2. Apparatus
The apparatus consisted of a chamber (61 × 36 × 46) with three walls and a lid made of dark opaque plastic with a transparent frontal door. The floor of the chamber was made of stainless steel rods (2 mm in diameter) that were spaced 1 cm apart; the floor of the chamber was electri- fied. Dynamic shelves were attached to the lateral wall at height of 11 cm onto which the animals could jump up performing self-defensive behavior. The apparatus was placed in an acoustically insulated room at constant tem- perature of 20˚C ± 1˚C. Illumination lamp of 60 l× was used as a light stimulus.
2.3. Procedure
The scheme of the research was designed as described by Tsagareli and Djgarkava [23]. The experiment lasted 20
days with 10 trials p.d. In each trial of active avoidance conditioning the avoidance was signaled by a single light stimulus presented for 10 sec. The subjects could avoid the painful foot-shock by jumping onto the shelves. If they did not, after 10 sec on the background of condition stimulus, the foot-shock current (25 mv) was delivered for 5 sec through the grid. The rats could escape the shock by jumping up onto the nearest shelf staying there for 3 sec until they were forced to return to the floor. Inter- trial period was scheduled by special program (method of Monte-Carlo) that had been proposed to ex-plore animals from different populations under identical experimental conditions; during the inter-trial intervals the rats could spontaneously jump up onto the shelves for only 3 sec. since after that the experimenter lowered the shelf and forced the animals to jump down to the floor. The grid of floor and walls of the chamber were washed with acetone, urine and/or feces were removed after completing each test.
As mentioned, three behavioral parameters were used to evaluate active avoidance conformities in albino rats: 1) jumping up onto the shelf as a response to the condi- tional (light) stimulus; 2) escape response to the uncon- ditional stimulus (avoidable painful foot-shock coming through the floor); and 3) spontaneous activity (jumping onto the shelf) during the inter-trial intervals. Each ex- perimental parameter was assessed quantitatively. The frequencies of light-induced avoidance and shock-induced escape behavior were measured for each animal tested for acquisition of active avoidance task. Inter-trial active- ity was measured in numbers relevant to spontaneous jum- ping onto the shelves.
2.4. Surgery
All surgical procedures were performed under aseptic conditions. The rats were anesthetized with sodium pen- tobarbital (Nembutal 55 mg/kg, i.p.) and placed in a stereotaxic instrument. An incision was made in the skin covering the skull and the latter was leveled. The animal had randomly received either electrolytic-induced lesions of the dorsal hippocampus or neocortex over the dorsal hippocampus. Electrolytic bilateral lesions of the hippo- campus and neocortex were performed by passing a rec- tified current of 1.2 mA for 15 sec through stainless-steel electrode (0.2 mm in diameter) uninsulated at the tip (approx. 0.5 mm). The lesion coordinates were identified on the basis of the rat brain stereotaxic atlas [24]. Each animal was given a 7 day recovery period before testing.
2.5. Histology
NS followed by 10% formal saline. The brains were re- moved and stored in 10% formal saline. The brains of all surgered rats were cut into 30 mm-thick horizontal sec- tions. Verifications included estimation of hippocampal and neocortical lesion extent.
3. Experimental Data Analysis
A wide range of statistical methods should be applied for analysis of any behavioral parameters, but besides tradi- tional statistic methods, the paper aims to propose the cluster analysis for assessment of neuroethological data.
3.1. Statistical Analysis
Behavioral data were analyzed using factorial analysis of variance (ANOVA) considering lesion and daily behave- ioral session as grouping factors in order to analyze the higher-order interactive effects of multiple categorical in- dependent variables (factors) and to test for significant effects of the lesion. Additional analysis was performed using post hoc comparisons (LCD test) in cases where significant effects were found. Differences were consid- ered to be statistically significant at p <0.05.
3.2. Cluster Analysis
Each animal placed in cabin was described by the “beha- vior vector” for multiparameter description of behavior in learning process. The components of the vector were behavioural parameters measured for each animal and they took different numerical values during the experiment. Consequently, several groups of animals demonstrating different behaviour along the learning process might exist.
Unsupervised clustering algorithm based on Parzen sta- tistical estimation of probability density function has been used in order to partition the rats according to their behavior similarities. The algorithm considers the case when both the probability density of an initial data set and the number of data classes are preliminary unknown [14,15]. This enables to classify rats’ behavior by their active avoidance acquisition ability [16].
4. Discussion
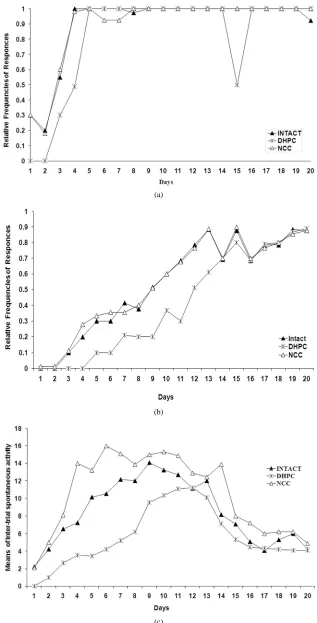
Data reported as the mean values ± S.E.M of three beha- vioral parameters for all the three animal populations are presented in Figure 1. The curves demonstrate daily dy- namics of behavioral parameters during the whole ex- periment (F (2,114) = 11.16, P <0.05).
At the early stages of the experiment it is shown that in contrast to intact or NCC animals DHPC rats are not able to perform escape behavior. During the following days the escape reaction rates are rapidly increasing and reach the criteria level on day 5 that is not observed in cases with DHPC rats—the corresponding rates remained lower for next few days.
The dynamics of avoidance behavior shows that the DHPC rats perform avoidance from the 5th day of the ex- periment and despite the rates of avoidance are progress- sively increasing, they remain lower than those for intact and NCC animals (Figure 1). The intact and the NCC rats reach the learning criteria level by day 13, but the DHPC animals on day 15 (the learning criteria are acce- pted to be within rate ranges of 0.9 and 1).
When assessing inter-trial spontaneous behavior, the NCC were found to be more active than the intact rats, but the NCC were less active in comparison with the intact and the NCC animals. The pattern of dynamics was similar for all the studied groups—low at the begin- ning of the experiment, growing during the next few days with the following decrease of rates (Figure 1).
It is obvious that the escape frequency score signifi-cantly differs between Intact-DHPC and NCC-DHPC groups at the initial stage of the test (A), but avoidance res- ponses score remained significantly different through the whole experiment with lower rate in DHPC rats (B); Mean value of inter-trial spontaneous activity assumes that there is statistically significant difference among all studied groups; Inter-trial behavior is statistically differ-ent in all groups at significance level p < 0.05.
It is obvious from the curve patterns that the rats pro- mptly escape from painful foot-shock stimulus (sharply increasing escape responses), but acquisition of avoid-ance reaction to the light is comparatively slow. Through- out the experiment elaboration of optimal self-defensive behavioral algorithm takes place in experimental animals: the rats begin to learn that staying on shelves helps them to avoid induced painful stimulus (foot-shock) stress and, consequently, the frequencies of avoidance responses are increasing. The variation in dynamics of inter-trial spon-taneous behavior seems to be interesting—the rate of spon- taneous jumping onto the shelves still remains at rather low level until the animals infer that staying on shelves is a self-defense behavior. The avoidance responses corre- late with spontaneous activity causing increase of the latter (beginning from the 5th day and lasting up to the 13th day). On the 14th day, after the learning criteria level has been reached in all the three studied populations, the inter-trial spontaneous activity begin to decrease and such dynamics is maintained up to the end of the experiment.
(a)
(b)
[image:4.595.139.456.84.707.2](c)
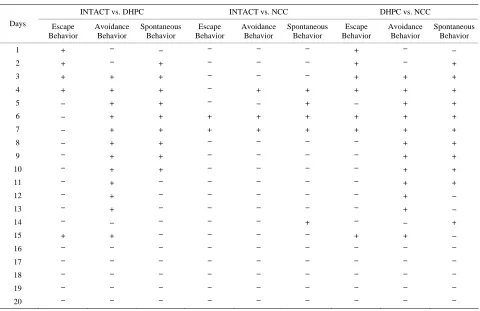
The analysis of 20-day experiment dynamics of three behavioral parameters revealed learning based adapta- tion conformities of animals to the aversive conditions different among the populations. The significance of dif- ferences between the studied populations obtained by factorial analysis of variance considering lesion and daily behaveioral session as grouping factors is shown on Table 1.
In case of finding significant effects additional analy- sis was performed using post hoc comparisons (LCD test) revealing daily differences in escape, avoidance and spon- taneous behavior between the studied groups (“+”: signi- ficant differences, p < 0.05000; “–”: no significant diffe- rences, p > 0.05000) (Table 1).
However, considering differences between the mean values it seems to be the case that these differences do not reflect behavioral patterns for each individual in full. The populations involve animals with either high or low learning abilities. It should also not be excluded that the representatives of different populations might have simi- lar learning skills. Proceeding from that, it seems signi- ficant to apply the relevant approach aimed at grouping animals by their behavioral resemblance.
Cluster analysis for classifying the animals through the learning process into classes by the degree of behavioral similarity throughout multiparameter assessment has be-
en used.
Cluster analysis of experimental data involved all three groups: intact, NCC and DHPC rats (31 animals, in total). The proposed approach enabled us to assess active avoi- dance formation conformities in the studied groups by to- tal analysis subjected to overall parameters. Consequently, as a result of cluster analysis, all the studied rats from different populations were classified into classes accord- ing to their behavioral similarities. Each of them included animals with similar learning abilities.
Distribution of the extracted classes obtained by use of cluster analysis of the 31 rats from different test groups was defined. The class number change dynamics (Figure 2) and relative frequencies of homogeneous classes were assessed (Figure 3).
The relative frequency of appearance of class 1 signi- ficantly differed from the other. As for the classes 2 and 3 (Figure 3), their frequencies were significantly lower than that for class 1, however, they exceeded the other classes not included in the final analysis due to their ex- tremely low frequencies.
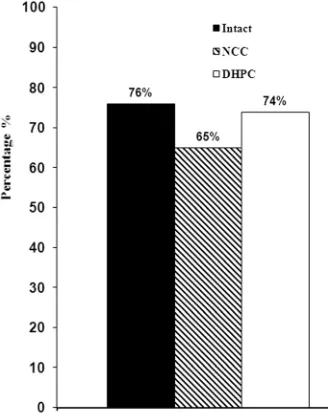
[image:5.595.60.540.424.735.2]The first class involved rats with most resembling be- havioral patterns during active avoidance acquisition and every next class exhibited less similarity to it (Figure 3). We revealed the groups with prevalence of animals of class 1 that was assessed in percentage (Figure 4).
Table 1. The significance of differences among the studied populations obtained by factorial analysis of variance.
INTACT vs. DHPC INTACT vs. NCC DHPC vs. NCC
Days Escape Behavior
Avoidance Behavior
Spontaneous Behavior
Escape Behavior
Avoidance Behavior
Spontaneous Behavior
Escape Behavior
Avoidance Behavior
Spontaneous Behavior
1 + – – – – – + – –
2 + – + – – – + – +
3 + + + – – – + + +
4 + + + – + + + + +
5 – + + – – + – + +
6 – + + + + + + + +
7 – + + + + + + + +
8 – + + – – – – + +
9 – + + – – – – + +
10 – + + – – – – + +
11 – + – – – – – + +
12 – + – – – – – + –
13 – + – – – – – + –
14 – – – – – + – – +
15 + + – – – – + + –
16 – – – – – – – – –
17 – – – – – – – – –
18 – – – – – – – – –
19 – – – – – – – – –
Figure 2. The class number change dynamics in the course of 20 day.
Classes
R
elat
iv
e
F
req
u
en
ci
[image:6.595.154.442.278.475.2]es
Figure 3. Relative frequencies of different classes defined by cluster analysis.
Figure 4. Percentage of the animals involved in class 1 from different test groups.
Proceeding from the analysis of experimental data, it was established that 24% of intact, 35% of NCC and 26% of DHPC rats were not included in class 1 (Figure 4).
Therefore, in order to assess quantitatively individual learning abilities and taking into account the fact that lar- ge majority of the animals were referred to class 1, the rats appearance frequency in class 1 (frequency range 0 - 1) was conditionally divided into four frequency intervals (0.90 - 1; 0.80 - 0.89; 0.70 - 0.79; 0.60 - 0.69).
The number of the appearances in class 1 has been di- vided by the number of days in order to calculate the ap- pearance frequency for each rat. This enabled us to iden- tify the mixed groups each containing the animals with different learning abilities of active avoidance through 20 - day experiment. Distribution of the tested animals (num- bered) within the frequency intervals is shown on Table 2.
[image:6.595.90.254.502.709.2]Per
cen
ta
g
e (
%
[image:7.595.141.455.86.305.2])
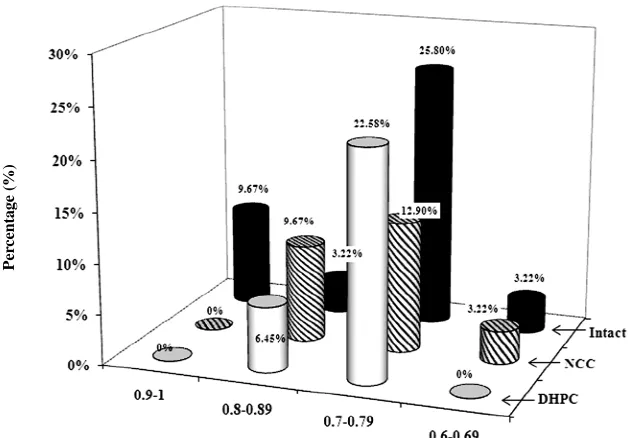
Figure 5. Distribution of the animals (class 1) with different learning abilities in divided frequency intervals.
Table 2. Distribution of tested animals (numbered) within the frequency intervals.
Frequency Ranges Groups
0.9 - 1 0.8 - 0.89 0.7 - 0.79 0.6 - 0.69
INTACT 2, 7, 11 8 1, 3, 4, 5, 6, 10, 12, 13 9
NCC 0 41, 42, 43 45, 46, 47, 48, 49 44
DHPC 0 32, 38 33, 34, 35, 36, 37, 39, 40 0
ones with well performed behavior test (1 intact; 3 NCC and 2 DHPC rats). However, they were less successful than the animals of group 1. Medium learners—8 intact, 5 NCC and 7 DHPC were within the interval of 0.7 - 0.79. The fourth rate interval—inferior learners (0.6 - 0.69) contained only 1 intact and 1 NCC rats. No DHPC rats were found to meet the criteria stipulated for that group.
Percentage of animals from each population included in class 1 was established. Out of all the studied popula- tions, 9.67% of intact animals’ best succeeded at active avoidance behavior. No animals among DHPC or NCC groups could achieve such levels. 3.22% of intact, 9.67% of NCC and 6.45% DHPC rats were found to be good at learning. Lower learning ability was revealed among 25.8% of intact, 12.9% of NCC and 6.45% with DHPC (Figure 5).
5. Conclusion
The proposed approach enables assessment of active avoi- dance behavior in rats by analysis of three or more pa- rameters in total. It enables further grouping of all the stu-
died animals from different populations by their behave- ioral similarities. Besides, the proposed approach is suited for the assessment of learning capacities of animals. It also facilitates getting additional information and defin- ing correlation between the learning skills and other neuro- ethological and neurobiological parameters.
REFERENCES
[1] K. Hausken and J. F. Moxnes, “Behaviorist Stochastic Modeling of Instrumental Learning,” Behavioural Proces- ses, Vol. 56, No. 2, 2001, pp. 121-129.
doi:10.1016/S0376-6357(01)00192-9
[2] C. Kolodziejski, B. Porr and F. Wörgötter, “Mathematical Properties of Neuronal TD-Rules and Differential Heb- bian Learning: A Comparison,” Biological Cybernetics, Vol. 98, No. 3, 2008, pp. 259-272.
doi:10.1007/s00422-007-0209-6
[3] G. McCollum, “Mathematics Reflecting Sensorimotor Organization,” Biological Cybernetics, Vol. 88, No. 2, 2003, pp. 108-128. doi:10.1007/s00422-002-0344-z
[4] M. P. Paulus and M. A. Geyer, “Quantitative Assessment of the Microstructure of Rat Behavior: I. f(d), the Exten- sion of the Scaling Hypothesis,” Psychopharmacology, Vol.113, No. 2, 2005, pp. 177-186.
doi:10.1007/BF02245695
[5] P. E. Rapp, “Quantitative Characterization of Animal Be- havior Following Blast Exposure,” Cognitive Neurody- namics, Vol. 1, No. 4, 2007, pp. 287-293.
doi:10.1007/s11571-007-9027-8
[6] S. Ito, H. Yuasa, Z. Luo, M. Ito and D. Yanagihara, “A Mathematical Model of Adaptive Behavior in Quadruped Locomotion,” Biological Cybernetics, Vol. 78, No. 5, 1998, pp. 337-347. doi:10.1007/s004220050438
[image:7.595.57.287.363.448.2]in a Complex Bird Sound: A Comparison of Three Bio- acoustical Analysis Procedures,” Ethology, Vol. 109, No. 3, 2003, pp. 223-242.
doi:10.1046/j.1439-0310.2003.00866.x
[8] D. Balslev, F. A. Nielsen, S. A. Frutiger, J. J. Sidtis, T. B. Christiansen,C. Svarer, S. C. Strother, D. A. Rottenberg, L. K. Hansen, O. B. Paulsonand I. Law, “Cluster Analy-sis of Activity-Time Series in Motor Learning,” Human Brain Mapping, Vol. 15, No. 3, 2002, pp. 135-145. doi:10.1002/hbm.10015
[9] H. Cohen, J. Zohar, M. A. Matar, Z. Kaplan and A. B. Geva, “Unsupervised Fuzzy Clustering Analysis Supports Behavioral Cutoff Criteria in an Animal Model of Post- traumatic Stress Disorder,” Biological Psychiatry, Vol. 58, No. 8, 2005, pp. 640-650.
doi:10.1016/j.biopsych.2005.04.002
[10] P. Edison, H. A. Archer, A. Gerhard, R. Hinz, N. Pavese, F. E. Turkheimer, A. Y. F. T. Hammers, N. Fox, A. Ken-nedy, M. Rossor and D. J. Brooks, “Microglia, Amyloid, and Cognition in Alzheimer’s Disease: An [11C] (R) PK11195-PET and [11C] PIB-PET Study,” Neurobiolpgy of Disease, Vol. 32, No. 3, 2008, pp. 412-419.
doi:10.1016/j.nbd.2008.08.001
[11] C. Lochner, S. M. J. Hemmings, C. J. Kinnear, D. Nel, S. Seedat, J. C. Moolman-Smook and D. J. Stein, “Cluster Analysis of Obsessive-Compulsive Symptomatology: Iden- tifying Obsessive-Compulsive Disorder Subtypes,” Israel Journal of Psychiatry and Related Sciences, Vol. 45, No. 3, 2008, pp. 164-176.
[12] J. C. McDonagh, R. B. Gorman, E. E. Gilliam, T. G. Horn- by, R. M. Reinking and D. G. Stuart, “Properties of Spi- nal Motoneurons and Interneuronsin the Adult Turtle: Provisional Classification by Cluster Analysis,”The Jour- nal of Comparative Neurology, Vol. 400, No. 4, 1998, pp. 544-570.
doi:10.1002/(SICI)1096-9861(19981102)400:4<544::AID -CNE8>3.0.CO;2-A
[13] M. C. Stevens, D. A. Fein, M. Dunn, D. D. Allen, L. H. Waterhouse, C. M. D. Feinstein and I. M. D. Rapin, “Subgroups of Children with Autism by Cluster Analysis: A Longitudinal Examination,” Journal of the American Academy of Child & Adolescent Psychiatry, Vol. 39, No. 3, 2000, pp. 346-352.
doi:10.1097/00004583-200003000-00017
[14] O. Tavdishvili, “Automatic Classification Algorithm for Observable Data Set,” Proceedings of the Institute of Cy- bernetics, Vol. 3, No. 1-2, 2004, pp. 136-141.
[15] O. Tavdishvili and T. Sulaberidze, “Segmentation Method of 3D Segments Extraction on the Scene Image,” In: J. M. Blackledge and M. J. Turner, Eds., Image Processing III: Mathematical Methods, Algorithms and Applications, Hor- wood Publishing, Chichester, 2001, pp. 82-88.
[16] O. Tavdishvili, N. Archvadze, S. Tsagareli, A. Stamateli and M. Gvajaia, “The Study of Rats’ Active Avoidance Behavior by the Cluster Analysis,” Life System Modeling and Intelligent Computing, Vol. 6330, 2010, pp. 180-188. [17] J. Ferbinteanu and M. L. Shapiro, “Prospective and Ret-
rospective Memory Coding in the Hippocampus,” Neuron, Vol. 40, No. 6, 2003, pp. 1227-1239.
doi:10.1016/S0896-6273(03)00752-9
[18] K. Henke, V. Treyer, E. T. Nagy, S. Kneifel, M. Dursteler, R. M. Nitsch and A. Buckb, “Active Hippocampus during Nonconscious Memories,” Consciousness and Cognition, Vol. 12, No. 1, 2003, pp. 31-48.
doi:10.1016/S1053-8100(02)00006-5
[19] J. Ji, and S. Maren, “Electrolytic Lesions of the Dorsal Hippocampus Disrupt Renewal of Conditioned Fear after Extinction,” Learning Memory, Vol. 12, No. 3, 2005, pp. 270-276. doi:10.1101/lm.91705
[20] K. Longden, “Constraining the Function of CA1 in Asso- ciative Memory Models of the Hippocampus,” Ph.D. Thesis, University of Edinburgh, Edinburgh, 2005.
[21] I. Martınez, G. L. Quirarte, S. Diaz-Cintra, C. Quiroz and R. A. Prado-Alcala, “Effects of Lesions of Hippocampal Fields CA1 and CA3 on Acquisition of Inhibitory Avoi- dance,” Neuropsychobiology, Vol. 46, No. 2, 2002, pp. 97-103. doi:10.1159/000065419
[22] D. Schulz, J. P. Huston, K. Jezek, H. L. Haas, A. Roth- Harer, O. Selbach and H. J. Luhmann, “Water Maze Per- formance, Exploratory Activity, Inhibitory Avoidance and Hippocampal Plasticity in Aged Superior and Inferior Learners,” European Journal of Neuroscience, Vol. 16, No. 11, 2002, pp. 2175-2185.
doi:10.1046/j.1460-9568.2002.02282.x
[23] S. Tsagareli and N. Djgarkava, “The Machine Processing of Experimental Results of the Formation and Mainte- nance of Avoiding and Feeding Habits,” In: R. Zhordania, Ed., Biology and Contemporaneity, Tbilisi University Press, Tbilisi, 2002, pp. 166-177.