Functional (physiological) biodiversity of the soil microbial communities is important information about the soil biological quality. Functional diver-sity is regarded more ecologically relevant than taxonomic diversity and it is usually measured with the BIOLOG system. In general, higher di-versity is positive, because it stabilizes the ecosys-tem functions and lower diversity can be found in the sites disturbed, e.g. by chemical pollutants (Atlas et al. 1991). Firstly, the ability of the BIOLOG system was proved to distinguish among samples from different habitats (Garland and Mills 1991). Further, the BIOLOG system was successfully used for studies of agronomic practice impact (Garland 1996), distinguishing soil types (Zak et al. 1994), degradation of chemicals (Cartwright et al. 2000), and pH effect (Pennanen et al. 1998). The functional diversity has been highlighted from the point of view of ecological risk assessment in soils (Rutgers and Breure 1999) and the BIOLOG assay was used for evaluation of the detrimental effect of heavy metals (Kandeler et al. 1996, Pennanen et al. 1998), PAHs (Juck et al. 2000), chlorphenols (Laine et al. 1997), or phtalates (Cartwright et al. 2000). BIOLOG method is generally known to be sensitive and also rapid. Beyond parameters of microbial biomass (microbial biomass amount – Cbio, basal respiration – BR, and potential respiration – PR), results of functional diversity can undoubtedly give a new information about the soils.
The BIOLOG assay does not rely on the laborious isolation of the organisms but attempts to examine
the distribution of physiological characteristics in sample of intact community (Garland and Mills 1994). It is based on physiological profiling at the community level (CLPP) which is obtained after the community reflects carbon sources in 96-well microtiter plates. Besides substrates, there are essential nutrients and tetrazolium-violet dye in the wells to be reduced in purple formazan if mi-croorganisms grow in the well and the substrate is respired (Garland 1997). Differences in CLPP are believed to be able to distinguish between dif-ferent soil microbial communities, because each community produces a characteristic fingerprint at the microplate (Garland and Mills 1991). The data of BIOLOG microplate EcoPlateTM consists from the set of 31 variables for each sample at each reading time. There has been proposed sev-eral parameters, which could be calculated from the absorbance data (e.g. Garland and Mills 1991, Zak et al. 1994, Haack et al. 1995, Garland 1996, Hackett and Griffiths 1997). The simplest output from the measuring overall rate is AWCD (average well color development) calculated in each time of absorbance reading (Garland and Mills 1991). Classical Shannon diversity index (H) can be cal-culated for BIOLOG data (Zak et al. 1994) or the profiles can be compared by multivariate statistical methods (Choi and Dobbs 1999, Howard 1999). The input parameters into these methods can be raw absorbances or the areas under the kinetic curves can be calculated by trapezoid method (Garland et al. 2001, Hackett and Griffiths 1997).
Evaluation of functional diversity of soil microbial
communities – a case study
J. Hofman, J. Švihálek, I. Holoubek
Faculty of Science, Masaryk University in Brno, Czech Republic
ABSTRACT
In our case study, we measured the functional diversity of the microbial communities of twelve soils from the small natural area to assess if this assay is suitable for routine monitoring of soil biological quality. We found the BIOLOG assay meets especially practical benefits in routine monitoring of soils being simple and quick assay. However, we confirmed the ambiguity about the most appropriate analysis of the BIOLOG multivariate data and about the best pa-rameter, which can be derived from the assay. The different analyses of the data were examined and various parame-ters derived from the BIOLOG assay were comparatively used to contribute to the discussion of how the data should be evaluated. We showed that not-normalized raw absorbances or trapezoid areas should be used for calculation of diversity index if the inoculum was standardized. There was no single answer to what parameter provided more correct results in the multivariate statistical analysis. Evaluating at least one not-normalized (e.g. trapezoid area) and one normalized parameter (e.g. absorbances read in fixed AWCD) was strongly suggested keeping in mind that they reveal different information.
It has been shown that inoculum density has a strong influence on the rate of color develop-ment, because color production is caused especially by growth of bacteria within wells (Garland and Mills 1991, Garland 1996). However, also the actual community physiological activity can confound the comparisons of the community’s functional diversity (Preston-Mafham et al. 2002). Hence, effective analysis of the BIOLOG results strongly requires separation of the effects caused by dif-ferences in the inoculum density or physiological activity from the effects caused by differences in the types of activities of organisms present. To compensate for this, Garland and Mills (1991) proposed to normalize the data by dividing each color score by the AWCD. The second method for compensating these effects is to compare color pat-tern in time points when AWCD reached some fixed level, e.g. 0.50 or 1.00 (Garland 1996). The third solution is to standardize methodically the inoculum according to cell numbers (Haack et al. 1995) or according to microbial biomass activity (Pennanen et al. 1998).
For the purpose of case study, we used twelve sites in small natural area around an industrial source (cement works). Our objective was to evaluate if the use of another biological assay is suitable for routine monitoring of the soils from this area. For that purpose, the functional diversity measured by BIOLOG method was used, because this approach has been many times referred as very informative for assessment of the soil biological quality. The different analyses of the data were examined and various parameters derived from the BIOLOG as-say were comparatively used to resolve how the BIOLOG data should be evaluated.
MATERIAL AND METHODS
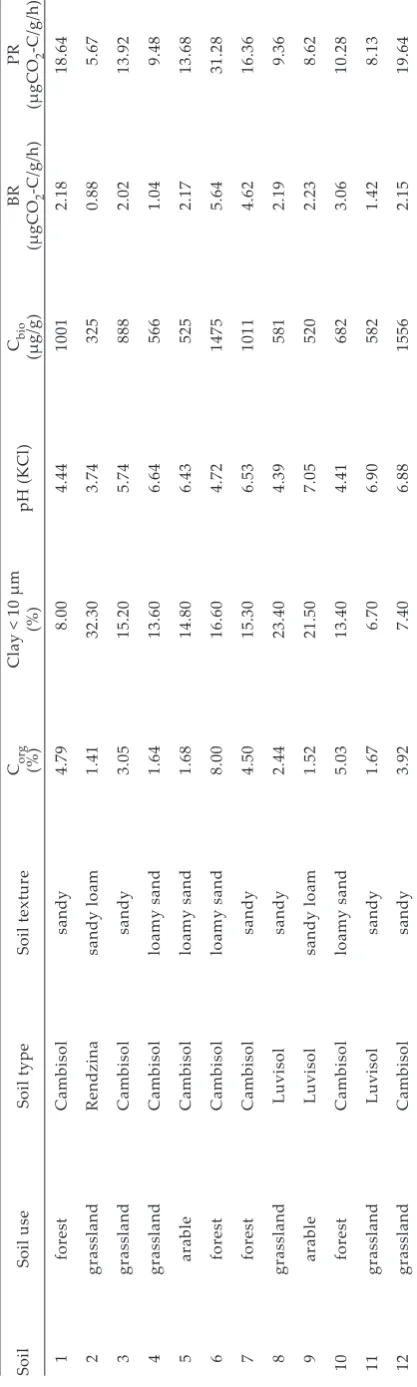
[image:2.595.321.530.76.771.2]RECETOX-TOCOEN consortium is realizing in an ongoing project of soil monitoring in small natural area around cement works, which is a possible source of negative impacts on soils. Contaminant levels, physico-chemical properties and micro-bial characteristics have been measured for soils sampled four times a year. Twelve localities from this project were used for this BIOLOG case study (Table 1). Soils for this study were sampled in April 2002 at the sampling plots 10 × 10 m as 8–12 sub-samples that were homogenized together before transport to the laboratory. Grassland soils were sampled from 0–10 cm depth, arable soils from 0–20 cm depth, and forest soils were sampled as organic humus horizon. Samples were manipu-lated and stored reflecting the biological nature of the samples (ISO 10381-6 1993, Forster 1995): the e 1. S
4°C prior to analyses. Total soil carbon (Corg), pH and particle size distribution were assessed by the standard methods described e.g. in Forster (1995). The amount of microbial biomass (Cbio) in the soil samples was measured with the chloroform fumigation-extraction method (ISO 14240-2 1997). Basal respiration (BR) was measured after 24 h in closed jars with moistened soil without any addition of substrate. Potential respiration (PR) was measured by substrate induced respiration (SIR) method according to ISO 14240-1 (1997). Respiration was measured as CO2 production with GC. All microbiological characteristics were calculated as mean values from three replicated measuring.
CLPP was determined by direct incubation of fresh soil extracts in BIOLOG EcoPlatesTM (BIOLOG Inc., Hayward CA) containing 31 different carbon sources to determine changes in relative and abso-lute rates of utilization of individual substrates. We standardized inoculum density using Cbio assessed with SIR method (ISO 14240-1 1997) according to Pennanen et al. (1998). Each sample was weighted and diluted separately to obtain 1 µg Cbio for each well finally. 100 ml 0.85% NaCl was added to the soil in 250ml flask and shaken for 45 min. Then the final volume was adjusted to 1000 ml with 0.85% NaCl. The portion of 20 ml was centrifuged at 2500 rpm for 10 min. Finally, 150 µl of supernatant was inoculated into each well of the EcoPlateTM. Microplates were incubated at 27°C for 4 days and color development was measured as absorbance using a multi optical reader (SUNRAY TECAN) at 590 nm each day of the microplate incubation. All absorbances were background corrected by subtracting the absorbance of A1 well. The final data consisted of a set of 31 absorbance-versus-time curves for each soil. We used three independently replicated procedures for each soil and BIOLOG parameters were calculated as mean values.
We considered various types of the possible pa-rameters that could be derived from the BIOLOG data for further analyses: raw absorbances (A); absorbances normalized by AWCD (AN) (Garland and Mills 1991); raw absorbances in fixed AWCD level (Garland 1996); trapezoid areas (TA) (Hackett and Griffits 1997); trapezoid areas normalized (TAN) by average trapezoid area (ATA) for all substrates for each microplate (Garland 1997). The average well color development (AWCD) was calculated for each microplate as AWCD = Σ (Aj–Ak)/31, where Aj is raw absorbance in the well j and Ak is absorbance in control A1 well (Garland and Mills 1991). The trapezoid area (TA) under the curves of absorbance development for each substrate was integrated according to Hackett and Griffiths (1997):
where At is absorbance in time t. The functional diversity was calculated according to Zak et al. (1994) as Shannon diversity index using equation:
H = –Σpi (ln pi), where pi is the ratio of the param-eter (absorbance or trapezoid area) for a particular substrate to the sum of parameter values of all substrates. Principal component analysis (PCA) based on a correlation matrix was carried out to observe discrimination of the soils in reduced two-dimensional space and to explore which type of the possible BIOLOG parameters is the most appropri-ate for the evaluation of the functional diversity. Spearman nonparametric correlation was used to compare the ranking of the soils (n = 12) according to the different parameters. Pearson parametric correlation was used when examined relationships between results (n = 31 × 12 = 372) of various types of the possible BIOLOG parameters. All statistical analyses were done with STATISTICA 6 software (StatSoft, Inc. 2001).
RESULTS AND DISCUSSION
At the first overall look, all soils displayed very similar substrate richness (positive reactions). This suggested that only the differences (if there would be any) between substrates should be in the level that they were used (i.e. in color intensity). Choi and Dobbs (1999) concluded that the EcoPlatesTM probably did not represent final and the most optimal selection of the substrates for sensitive discrimination of the microbial communities. It is tempting to omit the group of the commonly used substrates from the further evaluation in order to increase the sensitivity of the assay to the differences between used soils. However, in our opinion such an approach would artificially overestimate the differences among the soils. Thus, all substrates should be further considered and rather the selection of the most appropriate parameter should be focused.
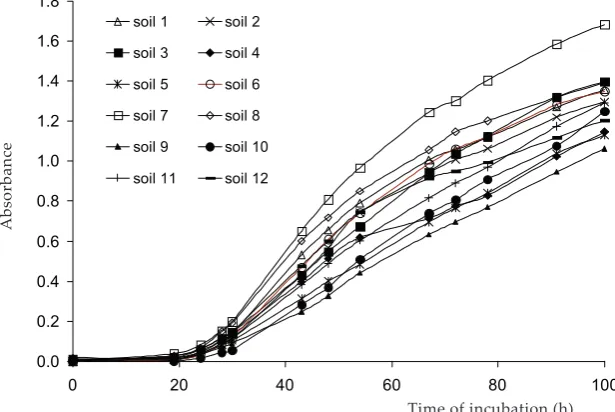
In general, the use of AWCD for the soils discrimi-nation seemed to be very insensitive (Figure 1). With the exception of soil 7, soils displayed very similar AWCD implying that the standardization of the inoculum made the BIOLOG results partially independent on different actual activities of the individual communities. This is confirmed by the fact that AWCD did not correlate with potential respiration, microbial biomass determined by fu-migation-extraction method, or basal respiration (Table 2, sector III). Our inoculum was standardized in order to inoculate each well of the microplate
�
(
)
(
)
�
5
.
0
( 1) ( )1
1 1 t j t j
n j
j j j
A
A
t
t
TA
�
�
� ��
�
��
� �
with 1 µg SIR-Cbio. Pennanen et al. (1998) referred to this method as adjusting the inoculum size to an equal biomass. We emphasize that this should be understood rather as a standardization of the inoculum activity according to principle of SIR method (Anderson and Domsch 1978).
Garland and Mills (1991) proved that overall activity in BIOLOG assay was linked to growth of bacteria in the wells. However, Garland (1996) found that a 10–20% variation in AWCD can still be expected for samples even of identical cell numbers in the inoculum and Haack et al. (1995) and Garland (1996) found that color development was better linked with actively respiring cells than with total cell density. Thus, it is evident that color develop-ment depends on both the number/biomass of cells and their activity reflecting also physiological state of those cells (Preston-Mafham et al. 2002). The AWCD for the soil 7 was higher from other soils strongly suggesting there could be still some factor influencing overall activity even the standardized inoculum was used. This could indicate that color formation was still driven by cell growth even the inoculum potential activity was adjusted a priori. Shortly, it is still a discussion topic whether or not the inoculum should be standardized according to microbial activity or cell density and there ever will be some additional effects on overall color formation in the both approaches.
AWCD expression is loosing much information originating from individual substrates utilization curves and reflects the overall activity rather than functional diversity of the community (Garland and Mills 1991). Hence, it is necessary to consider indi-vidual substrates reactions using multivariate sta-tistical methods or the diversity indices. However, what is the most appropriate type of parameter for
were strongly inter-correlated (Table 3) suggest-ing they revealed very similar information. These generally strong correlations were probably caused with inoculum a priori adjustment in our method. Trapezoid areas were strongly correlated with all other measures confirming they really integrated information from the various times of the curve development (Guckert et al. 1996, Garland et al. 2001). The lowest correlation with other parameters displayed absorbances of the second day (both raw and AWCD normalized) and of the read-ing point at AWCD 0.50 level. These parameters missed much diversity information because the time was too early for nearly half of the wells to develop the color probably due to rare members of community still being in the lag phase of their growth. They should not be used because they could give misleading results.
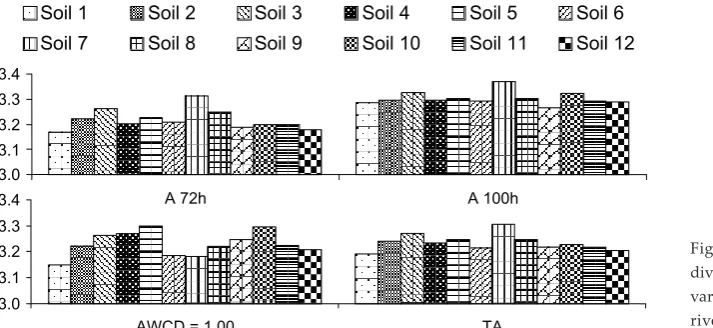
The results of Shannon diversity index showed completely different ranks of soils when using vari-ous types of the parameters (Figure 2). However, at this point it is not clear what classification was more correct. Index calculated from 72 h and 100 h absorbance values displayed similar rank of the soils – Spearman’s correlation was 0.80 (Table 2, sector I). Diversity index calculated from the trapezoid area (TA) showed similar results to those calculated from absorbances read in 72 h and 100 h – Spearman’s correlation was 0.91 and 0.85, respectively (Table 2, sector I). This confirmed the driving force of maximal absorbance in the formation of TA value and that the results of the
[image:4.595.64.372.72.278.2]TA and raw absorbances read in later times pro-vide similar information (Garland et al. 2001). The diversity index calculated from TA and from raw absorbances in 72 h or 100 h did not reflect overall activity differences because they did not correlate Figure 1. Average well color development (AWCD) for the twelve soils used
A
bs
or
ba
nc
e
Time of incubation (h)
0.0 0.2 0.4 0.6 0.8 1.0 1.2 1.4 1.6 1.8
0 20 40 60 80 100
soil 1 soil 2
soil 3 soil 4
soil 5 soil 6
soil 7 soil 8
soil 9 soil 10
(ATA) calculated for each plate (Table 2, sector II). They also did not reflect microbial biomass or its activity related to one plate well (Table 2, sector II). When the absorbance was normalized by read-ing in AWCD equal 1.00, the rank of the soils seemed to be the reverse to overall activity of the soils expressed by AWCD or ATA as indicated by Spearman’s correlation (Table 2, sector II). This suggested that the Shannon index calculated from this parameter reflected more overall activity than any diversity.
It is not appropriate to blindly transform the data to suppress the influence of inoculum density, without first recognizing whether density effects might be an important aspect of differences be-tween microbial communities under consideration (Preston-Mafham et al. 2002). There was found a very close relationship of the Shannon index to the AWCD. This suggested that microtiter plates with high levels of total activity were also likely to show a high number of carbon sources being utilized and hence a large number of carbon sources dominating observed functional diversity. However, the standardized inoculum density was not used in these studies like in our work. Considering absorbances at the fixed AWCD level brought an artificial reciprocal dependence on overall activ-ity into the diversactiv-ity evaluation in our study. We suggest that not-normalized raw absorbances or trapezoid areas should be used for calculation of diversity index if the methodically standardized inoculum was used.
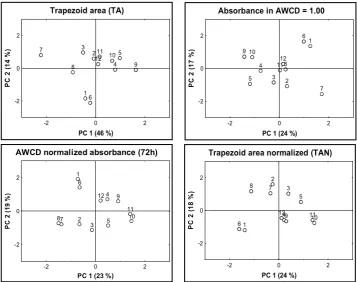
Very distinctive results were obtained when principal component analysis (PCA) for various parameters was carried out (Figure 3). In general, not-normalized parameters (raw absorbances in 72 h or 100 h, and TA) revealed very similar results and TA was chosen as an example in Figure 3. The first principal component displayed almost half of the data variation with little more explanation of the total variability at the second component. A strong common effect of majority substrates was displayed at the first principle component distinguishing the soils especially according to overall color development in each microplate. Thus, PCA extracted a pattern in the structure of the data, which can be explained, in large part, by differences in the rate of color development among plates. The worst effect of the strong re-dundancy for the majority of the substrates is that they outweigh other more independent variables and mask more subtle differences in the individual substrates utilization (diversity) (Campbell et al. 1997). Normalized parameters (AN, TAN, and A read in AWCD = 1.00) displayed quite different results of PCA (Figure 3). Lower Spearman correlation with AWCD or ATA indicated relative independ-ency on the overall activity differences and the
Ta bl e 2. S pe ar m an c or re la tio n be tw ee n so il ra nk s ( n = 1 2) a cc or di ng to A W C D r ea d in 7 2 h an d 10 0 h, a ve ra ge tr ap ez oi d ar ea fo r ea ch p la te ( A TA ), PR r el at ed to o ne w el l, Cbi o r el at ed to o ne w el l, BR r el at ed to o ne w el l, an d Sh an no n di ve rs ity in de x ( H ) c al cu la te d fr om r aw a bs or ba nc es r ea d in 4 8 h, 7 2 h or 1 00 h , f ro m r aw a bs or ba nc es r ea d in ti m e w he n A W C D w as e qu al 0 .5 0 or 1. 00 ( A 0 .5 0, A 1 .0 0) , o r fr om tr ap ez oi d ar ea s un de r th e cu rv es ( TA ) H ( A 7 2 h) 0. 62 Se ct or I H ( A 1 00 h ) 0. 34 0. 80 H ( A 0 .5 0) 0. 65 0. 47 0. 37 H ( A 1 .0 0) –0 .1 3 0. 10 0. 31 0. 62 H ( TA ) 0. 65 0. 91 0. 85 0. 66 0. 31 Se ct or II A TA 0. 38 0. 41 0. 24 –0 .3 6 –0 .7 9 0. 20 A W C D 7 2 h 0. 33 0. 43 0. 28 –0 .4 1 –0 .7 7 0. 21 0. 99 Se ct or II I A W C D 1 00 h 0. 34 0. 53 0. 46 –0 .2 7 –0 .5 9 0. 37 0. 92 0. 93 PR (w el l) –0 .0 3 –0 .0 8 –0 .0 3 –0 .3 4 –0 .4 4 –0 .2 7 0. 38 0. 41 0. 28 Cbi o (w el l) –0 .0 3 –0 .1 3 0. 13 –0 .1 0 0. 04 –0 .0 1 –0 .0 1 0. 01 0. 10 –0 .1 3 BR (w el l) –0 .1 2 0. 27 0. 34 –0 .1 7 0. 07 0. 32 0. 00 0. 10 0. 13 –0 .2 1 0. 06 H ( A 4 8 h) H ( A 7 2 h) H ( A 1 00 h ) H ( A 0 .5 0) H ( A 1 .0 0)
H (TA)
normalization of these parameters also removed the redundancy effect in PCA. Consequently, this also resulted in decreased informative power of the first two principal components – they explained only a small part of the total variance (40%). As apparent from Figure 3, no significant clusters of the similar soils could be identified from the first two principal components of any parameter.
In conclusion, we found the BIOLOG assay not problematic from the methodical point of view. However, its use in routine monitoring could be suitable only if the results would be properly evalu-ated. Unfortunately, there is no single answer what parameter derived from the BIOLOG data provided more correct results. We strongly suggest evaluat-ing at least one non-normalized (e.g. TA) and one normalized parameter (e.g. A 1.00) and to keep in mind that they reveal different information. The normalized parameters ignore differences between overall color formation rates by mathematical
[image:6.595.64.537.118.308.2](AN and TAN) or methodical (A in fixed AWCD) corrections. They bring especially qualitative in-formation about the soils. If both qualitative and quantitative information is considered using the non-normalized parameters, care must be taken for any density effects in the data. We used stand-ardized inoculum in our work and consequently no density effect could be expected. We assume that differences in patterns of BIOLOG substrate oxidation probably originated in really different soil communities. However, a major distinguish-ing feature between communities were the differ-ences of the activity and soils otherwise showed no significant differences in the carbon sources, which can be used. There is also a possibility, that the inoculum in our study should be standardized rather according to cell number than according to activity. However, there has been no referred solution in the literature about which type of the standardization would be more correct and this Table 3. Pearson correlation between results (n = 372) of various types of parameters measured from BIOLOG EcoPLatesTM:
raw absorbances (A) read in 48 h, 72 h or 100 h; absorbances normalized by AWCD (AN); raw absorbances read in time when AWCD was equal 0.50, 0.75 or 1.00 (A 0.50, A 0.75, A 1.00, respectively); trapezoid areas under the curves (TA); trapezoid areas normalized by average trapezoid area (TAN)
AN 48 h 0.93
A 0.50 0.96 0.97
A 72 h 0.89 0.85 0.86
A 100 h 0.66 0.63 0.64 0.90
AN 72 h 0.83 0.89 0.86 0.94 0.86
AN 100 h 0.61 0.65 0.63 0.84 0.96 0.89
A 0.75 0.92 0.95 0.94 0.90 0.74 0.94 0.77
A 1.00 0.81 0.83 0.83 0.92 0.87 0.96 0.91 0.93
TA 0.93 0.88 0.89 0.99 0.89 0.93 0.83 0.92 0.92
TAN 0.86 0.92 0.90 0.94 0.85 0.99 0.88 0.96 0.96 0.95
A 48 h AN 48 h A 0.50 A 72 h A 100 h AN 72 h AN 100 h A 0.75 A 1.00 TA
Figure 2. The results of Shannon diversity index calculated from the various parameters that can be
de-3.0 3.1 3.2 3.3 3.4
A 72h A 100h
Soil 1 Soil 2 Soil 3 Soil 4 Soil 5 Soil 6
Soil 7 Soil 8 Soil 9 Soil 10 Soil 11 Soil 12
[image:6.595.65.422.597.761.2]needs further comparative research with more properly chosen soils.
REFERENCES
Anderson J.P.E., Domsch K.H. (1978): A physiological method for the quantitative measurement of microbial biomass in soil. Soil Biol. Biochem., 10: 215–221. Atlas R.M., Horowitz A., Krichevsky M., Bej A.K. (1991):
Response of microbial populations to environmental disturbance. Microbial Ecol., 22: 249–256.
Campbell C.D., Grayston S.J., Hirst D.J. (1997): Use of rhizosphere carbon sources in sole carbon source tests to discriminate soil microbial communities. J. Microbiol. Meth., 30: 33–41.
Cartwright C.D., Thompson I.P., Burns R.G. (2000): Degradation and impact of phthalate plasticizers on soil microbial communities. Environ. Toxicol. Chem., 19: 1253–1261.
Choi K.H., Dobbs F.C. (1999): Comparison of two kind of Biolog microplates (GN and ECO) in their ability to distinguish among aquatic microbial communities. J. Microbiol. Meth., 36: 203–213.
Forster J.C. (1995): Soil sampling, handling, storage and analysis. In: Alef K., Nannipieri P. (eds.): Methods in soil microbiology and biochemistry. London, Acad. Press: 49–123.
Garland J.L. (1996): Analytical approaches to the charac-terization of samples of microbial communities using patterns of potential C source utilization. Soil Biol. Biochem., 28: 213–221.
Garland J.L. (1997): Analysis and interpretation of community-level physiological profiles in microbial ecology. FEMS Microbiol. Ecol., 24: 289–300.
Garland J.L., Mills A.L. (1991): Classification and char-acterization of heterothrophic microbial communities on the basis of patterns of community-level sole-car-bon-source utilization. Appl. Environ. Microbiol., 57: 2351–2359.
Garland J.L., Mills A.L. (1994): A community-level physi-ological approach for studying microbial communities. In: Ritz K., Dighton J., Giller K.E. (eds.): Beyond the biomass. Chichester, John Wiley & Sons: 77–83. Garland J.L., Mills A.L., Young J.S. (2001): Relative
effectiveness of kinetic analysis vs single point read-ings for classifying environmental samples based on community-level physiological profiles (CLPP). Soil Biol Biochem., 33: 1059–1066.
Guckert J.B., Carr G.J., Johnson T.D., Hamm B.G., Da-vidson D.H., Kumagai Y. (1996): Community analysis by Biolog: Curve integration for statistical analysis of activated sludge microbial habitats. J. Microbiol. Meth., 27: 183–197.
Haack K.S., Garchow H., Klug J.M., Forney J.L. (1995): Analysis of factors affecting the accuracy, reproduc-Figure 3. The score plots derived from the principal component analysis (PCA) carried out for the various parameters that can be derived from the BIOLOG data
�������������������
� � �
� �
� �
� �
�� �� ��
�� � �
�����������
�� � �
��
��
���
��
�
�
��������������������������������
�
� �
�
� �
� �
�
�� �� ��
�� � �
�����������
�� � �
��
��
���
��
�
�
�������������������������������
� �
�
� �
� � �
� ���� ��
�� � �
�����������
�� � �
��
��
���
��
�
�
�������������������������
�
� � � �
�
� �
� �� ����
�� � �
�����������
�� � �
��
��
���
��
�
[image:7.595.118.476.64.346.2]ibility and interpretation of microbial community carbon source utilization patterns. Appl. Environ. Microbiol., 61: 1458–1468.
Hackett C.A., Griffiths B.S. (1997): Statistical analysis of the time-course of Biolog substrate utilization. J. Microbiol. Meth., 30: 63–69.
Howard P.J.A. (1999): Analysis of inter-sample distance from BIOLOG plate data in Euclidean and simplex spaces. Soil Biol. Biochem., 31: 1323–1330.
ISO 10381-6 (1993): Soil quality-Sampling-Part 6: Guid-ance on the collection, handling and storage of soil for the assessment of aerobic microbial processess in the laboratory. Int. Org. Stand. Geneve, Switzerland. ISO 14240-1 (1997): Soil quality – Determination of soil
microbial biomass. Part 1: Subtrate-induced respiration method. Int. Org. Stand. Geneve, Switzerland. ISO 14240-2 (1997): Soil quality – Determination of soil
microbial biomass – Part 2: Fumigation-extraction method. Int. Org. Stand. Geneve, Switzerland. Juck D., Charles T., Whyte L.G., Greer C.W. (2000):
Poly-phasic microbial community analysis of petroleum hydrocarbon-contaminated soils from two northern Canadian communities. FEMS Microbiol. Ecol., 33: 241–249.
Kandeler E., Kampichler C., Horak O. (1996): Influ-ence of heavy metals on the functional diversity of
soil microbial communities. Biol. Fertil. Soils, 23: 299–306.
Laine M.M., Haario H., Jorgensen K.S. (1997): Microbial functional activity during composting of chloroph-enol-contaminated sawmill soil. J. Microbiol. Meth., 30: 21–32.
Pennanen T., Perkiomaki J., Kiikkila O., Vanhala P., Neuvonen S., Fritze H. (1998): Prolonged, simulated acid rain and heavy metal deposition: separated and combined effects on forest soil microbial community structure. FEMS Microbiol. Ecol., 27: 291–300. Preston-Mafham J., Boddy L., Randerson P.F. (2002):
Analysis of microbial community functional diver-sity using sole-carbon-source utilisation profiles – a critique. FEMS Microbiol. Ecol., 42: 1–14.
Rutgers M., Breure A.M. (1999): Risk assessment, micro-bial communities, and pollution-induced community tolerance. Hum. Ecol. Risk Assess., 5: 661–670. StatSoft Inc. (2001): STATISTICA (data analysis software
system), version 6. www.statsoft.com.
Zak J.C., Willig M.R., Moorhead D.L., Wildman H.G. (1994): Functional diversity of microbial communi-ties a quantitative approach. Soil Biol. Biochem., 26: 1101–1108.
Received on February 26, 2003
ABSTRAKT
Hodnocení funkční diverzity půdních mikrobiálních společenstev – případová studie
V této případové studii jsme měřili funkční diverzitu půdních mikrobiálních společenstev dvanácti půd z malé přírodní oblasti s cílem posoudit vhodnost použití tohoto přístupu pro rutinní monitoring půdní biologické kvality. Shledali jsme, že metoda BIOLOG splňuje zejména praktické výhody pro rutinní monitoring půd, protože je rychlá a jednoduchá. Na druhou stranu jsme potvrdili nejednoznačnost kolem nejvhodnější analýzy vícerozměrných dat z použité metody. Také výběr nejlepšího parametru metody je problematický. Abychom přispěli k diskusi, jak mají být data z metody BIOLOG hodnocena, použili jsme pro srovnání různé parametry a způsoby jejich vyhodnocení. Ukázalo se, že pokud bylo inokulum standardizováno, měly by být pro výpočet indexu diverzity použity nenor-malizované absorbance či trapezoid areas. Co se týká vícerozměrných statistických analýz, nelze jednoznačně určit, který parametr je korektnější. Bylo doporučeno hodnocení alespoň jednoho nenormalizovaného (např. trapezoid area) a jednoho normalizovaného (např. absorbance měřená při daném AWCD) parametru s tím, že je nutno mít na paměti, že přináší jinou informaci.
Klíčová slova: BIOLOG; půdní mikroorganismy; monitoring půd; funkční diverzita
Corresponding author:
Mgr. Jakub Hofman, Ph.D., Masarykova univerzita v Brně, Přírodovědecká fakulta, Kamenice 126/3, 625 00 Brno, Česká republika