JOURNAL OF FOREST SCIENCE, 63, 2017 (3): 107–116 doi: 10.17221/110/2016-JFS
Forest canopy density assessment using different
approaches – Review
Azadeh ABDOLLAHNEJAD*, Dimitrios PANAGIOTIDIS, Peter SUROVÝ
Department of Forest Management, Faculty of Forestry and Wood Sciences, Czech University of Life Sciences Prague, Prague, Czech Republic
*Corresponding author: [email protected]
Abstract
Abdollahnejad A., Panagiotidis D., surový P. (2017): forest canopy density assessment using different approaches – review. J. for. sci., 63: 107–116.
crown canopy is a significant regulator of forest, affecting microclimate, soil conditions and having an undeniable role in a forest ecosystem. Among the different materials and approaches that have been used for the estimation of crown canopy, satellite based methods are among the most successful methods regarding cost-saving efforts and different kinds of options for measuring the crown canopy. Different types of satellite sensors can result in different outputs due to their various spectral and spatial resolution, even when using the same methodologies. the aim of this review is to assess different remote sensing methods for forest crown canopy density assessment.
Keywords: satellite sensors; vegetation index; classification methods; pixel based; spectral analyses
supported by the czech University of life sciences Prague, Project no. B07/15.
recently, measuring the crown canopy of a for-est has been part of the inventory schedule. The tree crown size determines, among others, carbon sequestration, shading, filtering of fine air particu-lates, risk of wind-breaking and tree growth. The dependence of the crown size on resource supply, species and tree age complicates an accurate evalu-ation of the space requirement of a tree, its size-dependent functions and services in forested areas. two important factors that affect measuring the crown canopy are: definition of crown canopy and the technique used to estimate the crown canopy (Korhonen et al. 2006).
There are three different methods for measur-ing or estimatmeasur-ing the crown canopy in a forest: (i) ground measurement at the study area (sarvas 1953; rautiainen et al. 2005; Korhonen et al. 2006), (ii) statistical approaches, if the information such as basal area or DBH and number of stems is available, (iii) remote sensing data like aerial
photo-graphs (Pitkänen 2001; culvenor 2003), satellite data (iverson et al. 1989; Gemmell 1999) or laser scanner data (næsset et al. 2004). from among these the satellite based models are the most com-mon approach for measuring the crown canopy and they can be divided into two main categories.
Remote sensing methods
the most complete one, there are some disadvan-tages of this approach. requirement for training area establishment for estimation is one of those impediments. training area establishment is time consuming, difficult to fulfil and sometimes it can-not give right or enough information.
Biophysical response modelling
The international tropical timber organization developed a new method to solve the problems of remote sensing methods. The advantage of this ap-proach is that it does not need any training samples during the process of so called forest canopy den-sity (fcD) mapping model known as rikimaru’s approach. The fcD mapping model uses the crown canopy density as an important factor for assessing the crown status.
The main purpose of this paper is to review dif-ferent approaches to estimation and classification of crown canopy density as well as the possibility of remote sensing methods for providing the needed material.
Description of the individual methods
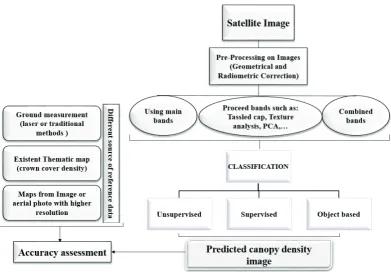
Main bands and analysed spectral data.
re-mote sensing has been widely used with vary-ing degrees of success to quantify spatially forest structure characteristics such as crown cover, tree density, tree diameter, basal area, tree height, tree age, biomass, and leaf area index. nowadays using a wide range of software with different enhance-ment options makes an opportunity for researchers to detect and clarify their interest variables easier. image contrast enhancement, linear principle com-ponent analysis and tasselled cap transformations and texture analysis are some of the common pro-cessing methods for image enhancement in remote sensing software such as Pci Geomatica, erDAs, iDrisi, etc. Pixel based (the most common proach) (shao et al. 1996) and object based ap-proaches (shataee 2003) have been used for the classification of crown canopy in related researches.
The development of robust object based meth-ods suitable for medium to high resolution satellite imagery provides a valid alternative to “traditional” pixel based methods (Baatz et al. 2004; Benz et al. 2004). The object oriented classification involves segmenting an image into objects (groups of pix-els). There are two main methods for object based approaches:
(1) Direct method such as (i) region growing tech-nique – can be employed to a group of adjacent pixels with similar spectral values into individual objects (Gao et al. 2006), (ii) edge detection technique – can be used to identify discontinui-ties (object boundaries or edges) throughout the image, these boundaries can be used to build poly-gons for the object based classification (carleer, Wolff et al. 2006);
(2) indirect method: here, the imagery is supplemen-ted with another spatial data, often digital vector map data. The objects characterised by the vector polygons are assigned land cover values derived from the imagery.
Also, some researchers (tucker 1979; Huang et al. 2001) used the main bands of satellites (landsat 7 etM+) for the classification of crown canopy.
Moreover, there are different image classification procedures used for different purposes by various researchers (ernst, Hoffer 1979; tucker 1979; Butera 1983; lo, Watson 1998; liu et al. 2002; ozesmi, Bauer 2002; Dean, smith 2003; Pal, Mather 2003).
These techniques are distinguished in two main ways: (i) unsupervised classification which re-quires no training data (Ghazanfari 1996; shi-rian 1997; Mirakhorlo 2003; Hosseini et al. 2004), (ii) supervised classification including maximum likelihood (Butera 1983; lee, Park 1992; yi et al. 1994; clark et al. 2005), minimum distance to mean (Huguenin et al. 1997), Maha-lanobis, fisher classifier, parallelepiped (Hines et al. 1993) and Bayesian formulation based classi-fication (schistad-solberg et al. 1994) (fig. 1). These algorithms were used by different studies such as ramtin nia (1997), Abbasi (2001), and Hosseini et al. (2004). recently, non-parametric algorithms are widely used for the classification of forest attributes like crown canopy. some of those data mining classifier algorithms have been com-monly used in recent studies such as:
(i) k-nearest neighbour (k-nn) method is one of the simplest and most popular data-mining al-gorithms used for classification and regression.
k-nn is widely used for the estimation of forest description using various topographic and re-mote-sensing data (Breiman 2001, 2002). in
k-nn implementations, three factors should be determined including the number of k, the type of distance measure and weights for the nearest neighbours;
learning theory (Walton 2008). Generally, support vector machine (svM) focuses on the boundary between classes and maps the input space created by independent variables using a non-linear transformation according to a kernel function. liner, polynomial radial basis function (rBf) and sigmoid are the most commonly used kernel types. The rBf is the most popular kernel, which is used in svMs (cortez, Morais 2007; Durbha et al. 2007). According to our literature review, svM has been used for forest classification (Zhang, Ma et al. 2008; ostapowicz et al. 2010). in his work, sheeren et al. (2016) found out the svM among various non-parametric techniques to be the best classifier with very close results to other classifiers among them (k-nn and random forest);
(iii) random forest (rf) is a new algorithm to the field of data mining, designed to produce accurate predictions that do not overfit the data (Breiman 2002). rf can also be used for regression-type problems (to predict a continuous dependent variable) and classification problems (to predict a categorical dependent variable). implementation of rf depends on the regularization of decision tree and stopping parameters. The decision tree model parameters include the maximum number of trees that must be grown in the forest and the number of variables (k predictor or independent
variables in each node for predicting dependent values) that are randomly selected in each node. Alternatively, choosing a small number of pre-dictor variables may downgrade the prediction performance, because this can exclude variables that may account for most of the variability and trends in the data (statsoft, inc. 2010). The sto-pping parameters or control parameters are used to stop running the algorithm when satisfactory results have been achieved (shataee et al. 2012). in some studies such as Garzón et al. (2008) and shataee et al. (2012), the rf has been used for the prediction of forest attributes.
Vegetation indicators. vegetation indicators are
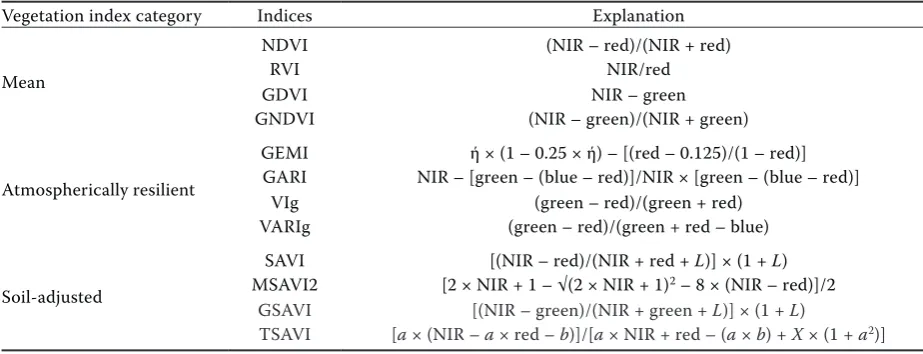
based on the spectral reflection of plants (red and near infra-red range). There are three categories for vegetation indicators (table 1):
[image:3.595.96.488.53.325.2](i) Mean vegetation indices: almost most of these indicators have been used for measuring the frequency of plants and biological characteri-stics of crown cover. These indicators just use red and infra-red bands. normalized difference vegetation index (nDvi) (rouse et al. 1973), ratio vegetation index (also known as the simple ratio) (Birth, Mcvey 1968), green normalized difference vegetation index (Buschmann, nagel 1993) and green difference vegetation index (sripada et al. 2006) are some of the most common indicators in this category;
(ii) Atmospherically resilient vegetation indices: these indicators use the blue or green bands besides the red and infra-red bands in order to solve the dependence of vegetation indices on atmospheric effects. Global environmental mo-nitoring index (Pinty, verstraete 1992), green atmospherically resilient index (Gitelson et al. 2002), vegetation index green (Gitelson et al. 2002), and vegetation atmospherically resilient index green (Gitelson et al. 2002) are some of these indices;
(iii) soil-adjusted vegetation indices: by using one parameter called L these indicators try to dec-rease the soil effect on nDvi index. The L factor is an adjustment parameter, the amount of this factor for the area with low density 1, for the area with intermediate density 0.5 (the most common amount) and for the area with high crown cover 0 is considered. soil-adjusted vegetation index (Huete 1988), modified soil-adjusted vegetation spectral index (MsAvi2) as it is described in eq. 19 in Qi et al. (1994), transformed soil-adjusted vegetation index, the median soil line values of which reported in Baret and Guyot (1991) are a = 1.2 and b = 0.04, and green soil-adjusted vegetation index (sripada et al. 2006) are some indicators from this category.
Different studies arrived at different indices as the best vegetation index based on the density of their case study. sensitivity of indicators to the amount of crown canopy and soil or gap area percentage
can cause different results in different studies. for example nDvi and MsAvi2 in the area with lower or without crown canopy density have higher ac-curacy (Abdi et al. 2009).
Biophysical response modelling (FCD model).
fcD is used as an important variable for the char-acteristics of forest status. fcD is based on the growth component and it can illustrate the degree of degradation (rikimaru et al. 1999). fcD mod-el shows the growth phenomena of forests, which is quantitative analysis. the degree of forest den-sity is expressed in percentages: i.e. 10, 20, 30, 40% and so on.
Also, this model makes it possible to monitor changes in the forest crown canopy density over time. This method also makes it possible to moni-tor the transformation of forest conditions over time and it can assess the progress of reforestation activities.
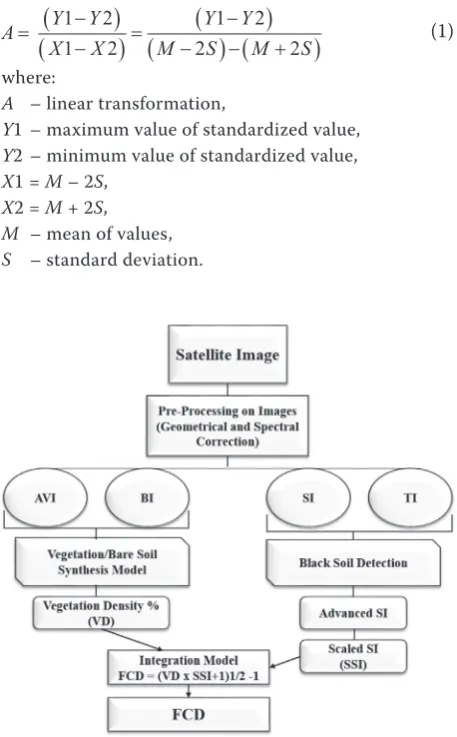
Based on four different indicators, fcD can cal-culate the percentage of canopy density for each pixel. These indices are: (i) advanced vegetation index (Avi), (ii) bare soil index (Bi), (iii) canopy shadow index or scaled shadow index (ssi), (iv) thermal index (ti) (rikimaru et al. 2002; Go-dinho et al. 2016) (table 2). The principle of this method is shown in fig. 2. There are direct and indirect relationships between forest canopy and fcD components (table 3).
[image:4.595.63.525.73.250.2]in this method like in other approaches, first of all the geometric accuracy and spectral quality of
table 1. categories of vegetation indices
vegetation index category indices explanation
Mean
nDvi (nir – red)/(nir + red)
rvi nir/red
GDvi nir – green
GnDvi (nir – green)/(nir + green)
Atmospherically resilient
GeMi ή × (1 – 0.25 × ή) – [(red – 0.125)/(1 – red)] GAri nir – [green – (blue – red)]/nir × [green – (blue – red)]
vig (green – red)/(green + red)
vArig (green – red)/(green + red – blue)
soil-adjusted
sAvi [(nir – red)/(nir + red + L)] × (1 + L) MsAvi2 [2 × nir + 1 – √(2 × nir + 1)2 – 8 × (nir – red)]/2
GsAvi [(nir – green)/(nir + green + L)] × (1 + L)
tsAvi [a × (nir – a × red – b)]/[a × nir + red – (a × b) + X × (1 + a2)]
nDvi – normalized difference vegetation index, rvi – ratio vegetation index, GDvi – green difference vegetation index, GnDvi – green normalized difference vegetation index, GeMi – global environmental monitoring index, GAri – green atmospherically resilient index, vig – vegetation index green, vArig – vegetation atmospherically resilient index green, sAvi – adjusted vegetation index, MsAvi2 – modified adjusted vegetation spectral index, GsAvi – green soil-adjusted vegetation index, tsAvi – transformed soil-soil-adjusted vegetation index, nir – near infra-red band, ή = (2 × (nir2 –
red2) + 1.5 × nir + 0.5 × red)/(nir + red + 0.5), L = 0.5, a – the slope of the soil line, b – the intercept of the soil line,
images must be checked. Then all the bands (ex-cept the thermal band) must be normalized by us-ing eqs 1 and 2:
11 22
2
1
2
2
Y Y Y Y
A
X X M S M S
(1)
where:
A – linear transformation,
Y1 – maximum value of standardized value, Y2 – minimum value of standardized value, X1 = M – 2S,
X2 = M + 2S, M – mean of values, S – standard deviation.
1 1
Y AX AX Y (2)
where:
Y – normalized data, X – original value.
According to many researchers who used this method, alone or in comparison with other ap-proaches, the fcD model can be a feasible and ac-curate approach to the estimation of forest crown canopy density (table 4).
Detection and separation of bare soil reflectance and plant reflection in a high density forest (more than 70%), no need of training samples during the crown cover density classification are the advan-tages of fcD model. Also, according to Bonyad (2005), taefi (2006), Moeinazad tehrani et al. (2008), and Pakkhesal and Bonyad (2013) the low accuracy of classification in a low and middle density forest can be the disadvantage of fcD model.
it is worth mentioning that the elimination of individual pixels after classification by using a low pass filter (3 × 3 or 5 × 5) can increase the accuracy of classification – average increment 5% (Bonyad 2005; Pakkhesal and Bonyad 2013).
fig. 2. Methodological flow chart demonstrating different stages of the forest canopy density (fcD) model
[image:5.595.63.292.318.687.2]Avi – advanced vegetation index, Bi – bare soil index, ssi – scaled canopy shadow index, si – canopy shadow index, ti – thermal index
table 2. indicators of forest canopy density model
formula explanation and practical uses
Advanced vegetation
index (Avi)
1 3
AVI B4 1 256 B3 B4B3 The use of power degree on nDvi enables Avi to be more sensitive to forest density and physiognomic vegetation indices.
Bare soil index (Bi)
4 2
3BI
4 2 3
B B B
B B B
it is the index prepared for analysing soils, in other words it can be used to identify the difference between agricultural and non-agricultural vegetation.
canopy shadow
index (si) SI
256B2 256
B3
evaluates the different shadow patterns, based on the structure, age, species distribution etc.,
by affecting the spectral responses each time.
Thermal index – source of info is the thermal band of thematic mapper sensor (band 6).
[image:5.595.304.532.665.730.2]B2 – green band, B3 – red band, B4 – near infra-red band, nDvi – normalized difference vegetation index
table 3. relationship between forest canopy and forest canopy density (fcD) parameters
index High fcD low fcD Grassland Bare land
Avi high mid high low
Bi low low low high
si high mid low low
ti low mid mid high
DISCUSSION
Main categories of classification
in this study we tried to show the different meth-ods used for crown canopy assessment. All these methods can be divided into two main categories: pixel and object based approaches. The principle of pixel based approaches is based on spectral data derived from pixel cells. As an alternative to the essentially pixel based analysis, the object based method attempts to identify groups of pixels that form discrete objects on the basis of characters that might include overall shape or texture as well as their spectral similarity. object based methods avoid the need for the complete classification of the whole image, where one has specific interest in one component.
in fact, object oriented methods use segments that are regions specified by one or more yardsticks of homogeneity in one or more dimensions (Hay, castilla 2008). Using different dimensions like spatial dimensions (distances, neighbourhood, to-pologies, etc.) is crucial to object oriented meth-ods, making them the most popular methods in re-cent times, as compared to the usage of pixel based methods (conchedda et al. 2008).
Biophysical response modelling (FCD method)
like all models, the fcD model has some ad-vantages and some disadad-vantages. it is disability to achieve high accuracy in very dense areas and
having to use pixel based principles are the biggest disadvantages of this method. on the other hand, modelling with high accuracy and no need of train-ing area establishment (i.e. ground truth) are the most important criteria of fcD that can reduce the time and cost of modelling. so far, many studies have used this approach and almost all of them had acceptable results.
Jamalabad and Akbar (2004) used three sets of thematic mapper and enhanced thematic map-per plus (etM+) of 1991, 1998 and 2002. fcD from each data set was classified into 5 classes (class 1 – water and clouds, class 2 – no forest, class 3 – low forest, 5–40%, class 4 – middle for-est, 41–70%, class 5 – dense forfor-est, 71–100%). the result that came from using etM+ 2002 was with overall accuracy of 83% and Kappa coefficient 0.78. finally they used the fcD results of images from the same season in 1991 and 1998 in order to prepare the change detection map for their study area.
Azizi et al. (2008) tested the fcD model using a geometrically corrected image coming from in-dian remote sensing satellite (irs) imagery 2007 of an old growth forest of the north forest division of iran. The overall accuracy of the irs images was 84.4% and the Kappa coefficient was 0.783.
[image:6.595.64.533.71.251.2]After geometric correction (rMse = 0.5 pixel) of the images and spectral range normalization of the first five bands of landsat 7, shahvali-Kouh-shour et al. (2012) calculated the four main indica-tors of fcD using these indicaindica-tors. They were able to create an advanced shadow index and vegetation density index maps. They used different numbers of classes (3, 4 and 6) to classify the fcD result.
table 4. some researches on the forest canopy density model using different images
satellite/sensors references resolution (m)
landsat (tM) rikimaru et al. (2002)
30
landsat (tM, etM+) Jamalabad and Akbar (2004)
landsat (tM) nandy et al. (2003)
landsat (Geocover) Hadi et al. (2004)
landsat 7 etM+ Joshi et al. (2006)
irs (liss-iii) Azizi et al. (2008) 25
sPot, Ali Mahboob and igbal (2012)
30
landsat 7 (etM+) Pakkhesal and Bonyad (2013)
landsat 7 etM+ shahvali-Kouhshour et al. (2012)
landsat (tM) Deka et al. (2013)
landsat (tM) Banerjee et al. (2014)
landsat 5 (tM) – visible and nir band Godinho et al. (2016)
landsat 5 (tM) – thermal band Godinho et al. (2016) 120
Because their study area was highly heterogeneous and dense, the results showed that the class 3 layer had the highest overall accuracy (62%) and Kappa coefficient 0.30.
Mahboob and iqbal (2012) used an earth ob-servation sPot 5 satellite (2.5 m) and advanced land imager Ali (30 m) for forest crown closure to calculate the forest crown canopy density in Ayubia national Park, Pakistan. A diverse variety of tree species like coniferous and broadleaved tree spe-cies are present in this natural environment. re-sults showed that the crown canopy of the study area using sPot imagery was between 20 and 65%, and 45–65% with reference to Ali imagery. it was also concluded that sPot imagery gave better re-sults because of the higher spatial resolution com-pared to Ali imagery. on the other hand, sPot was unable to detect the built up and landslide ar-eas and gave them high values, wherar-eas Ali imag-ery, having a higher spectral resolution compared to sPot data, was able to detect these areas and give them low values.
Pakkhesal and Bonyad (2013) conducted their study on landsat etM+ images in order to clas-sify the crown canopy classes in the shafarud Area of Guilan. first they prepared a forest density map which included different density classes (bare, 5–25, 25–50, 52–75 and 75–100%). They used the four different indicators of fcD (Avi, Bi, ssi, ti) in order to calculate the percentage of canopy den-sity for each pixel. one thematic map came from an orthomosaic aerial photo and was used for the evaluation of fcD accuracy. results of maximum likelihood classification showed that the fcD map results were close to ground reality (overall accu-racy 71% and Kappa coefficient 0.61). Also, the ma-trix of errors showed that the fcD method is not applicable to areas with high and medium density but it can provide high accuracy for dominant trees and area with low density (lower than 5%).
in overall, the spatial and spectral resolution of images acquired by different sensors brings several advantages to natural resource managers and aca-demic researchers for the classification, monitor-ing, and management of natural ecosystems. some of the basic requirements for successful remote sensing-based monitoring can be listed briefly as follows: (i) availability of required digital data sources (i.e., imagery, maps, and any other forms of data, (ii) collecting up-to-date from the interest area, (iii) applying the image processing methodol-ogy with respect to the specific characteristics of the study area, (iv) producing accurate and useful outputs (e.g., maps and statistics).
selecting an appropriate method and material with respect to the study area status, aim of study and commercial acceptance can help the mangers and researchers to access easier to their purposes. in case of crown canopy classification, the crown density of the study area and the aim of the study have a significant role which can influence the total accuracy of canopy modelling.
References
Abbasi M. (2001): investigating the possibility of Fagus orientalis stand type mapping using etM+ data in chalir district – nowshahr. [Msc Thesis.] tehran, University of tehran: 114.
Abdi o., Akbari H., sosani J., shirvani Z. (2009): compari-son of vegetation indicators for determination of crown canopy of Zagros forest using etM+ data. in: Abbasi A. (ed.): Geomatic conference, tehran, May 10–11, 2009: 12. Azizi Z., najafi A., sohrabi H. (2008): forest canopy density
estimating, using satellite images. in: chen J., Jiang J., Peled A. (eds): Proceedings of the 21st isPrs congress, commis-sion viii, Beijing, July 3–11, 2008: 1127–1130.
Baatz M., Benz U., Dehghani s., Heynen M., Höltje A., Hofmann P., lingenfelder i., Mimler M., sohlbach M., Weber M., Willhauck G. (2004): Definiens enterprise im-age intelligence suite 7 for Windows – installation and administration guide. Available at http://www.ecognition. cc/download/WindowsinstallationGuide.pdf (accessed Mar 7, 2006).
Banerjee K., Panda s., Bandyopadhyay J., Jain M.K. (2014): forest canopy density mapping using advance geospatial technique. international Journal of innovative science, engineering & technology, 1: 358–363.
Baret f., Guyot G. (1991): Potentials and limits of vegetation indices for lAi and PAr assessment. remote sensing of environment, 35: 161–173.
Benz U., Hofmann P., Willhauck G., lingenfelder i., Heynen M. (2004): Multi-resolution, object-oriented fuzzy analysis of remote sensing data for Gis-ready information. isPrs Jour-nal of Photogrammetry and remote sensing, 58: 239–258. Birth G.s., Mcvey G.r. (1968): Measuring colour of grow-ing turf with a reflectance spectrophotometer. Agronomy Journal, 60: 640–649.
Boles s.H., Xiao X.M., liu J.y., Zhang Q.y., Munkhtuya s., chen s.Q., ojima D. (2004): land cover characterization of temperate east Asia using multi-temporal vegetation sensor data. remote sensing of environment, 90: 477–489. Bonyad A. (2005): Multitemporal satellite image database
classification for land cover inventory and mapping. Journal of Applied sciences, 5: 835–837.
Breiman l. (2002): Using models to infer mechanisms. iMs Wald lecture 2. Available at https://oz.berkeley.edu/users/ breiman/wald2002-2.pdf (accessed sept 19, 2002). Buschmann c., nagel e. (1993): In vivo spectroscopy and
internal optics of leaves as basis for remote sensing of vegetation. international Journal of remote sensing, 14: 711–722.
Butera M.K. (1983): remote sensing of wetlands. ieee trans-actions on Geosciences and remote sensing, 21: 383–392. carleer A.P., Wolff e. (2006): region-based classification
potential for land-cover classification with very high spatial resolution satellite data. in: lang s., Blaschke t., schöpfer e. (eds): Proceedings of the 1st international conference on object-based image Analysis, salzburg, July 4–5, 2006: 1–6.
clark M.l., roberts D.A., clark D.B. (2005): Hyperspectral discrimination of tropical rain forest tree species at leaf to crown scales. remote sensing of environment, 96: 375–398.
conchedda G., Durieux l., Mayaux P. (2008): An object-based method for mapping and change analysis in mangrove ecosystems. isPrs Journal of Photogrammetry and remote sensing, 63: 578–589.
cortez P., Morais A. (2007): A data mining approach to predict forest fires using meteorological data. in: neves J., santos M.f., Machado J.M. (eds): Proceedings of the ePiA 2007 – Portuguese conference on Artificial intelligence, Guimarães, Dec 3–7, 2007: 512–523.
culvenor D.s. (2003): extracting individual tree information. A survey of techniques for high spatial resolution imagery. in: Wulder M.A., franklin s.e. (eds): remote sensing of forest environments: concepts and case studies. Boston, Kluwer Academic Publishers: 255–277.
Dean A.M., smith G.M. (2003): An evaluation of per-parcel land cover mapping using maximum likelihood class probabilities. international Journal of remote sensing, 24: 2905–2920.
Deka J., tripathi o.P., Khan M.l. (2013): implementation of forest canopy density model to monitor tropical deforesta-tion. Journal of the indian society of remote sensing, 41: 469–475.
Durbha s.s., King r.l., younan n.H. (2007): support vector machines regression for retrieval of leaf area index from multiangle imaging spectroradiometer. remote sensing of environment, 107: 348–361.
ernst c.l., Hoffer r.M. (1979): Digital Processing of re-motely sensed Data for Mapping Wetland communities. lArs technical report 122079. West lafayette, Purdue University: 119.
Gao y., Mas J.f., Maathuis B.H.P., Zhang X.M., van Dijk P.M. (2006): comparison of pixel-based and object oriented im-age classification approaches – a case study in a coal fire area, Wuda, inner Mongolia, china. international Journal of remote sensing, 27: 4039–4051.
Garzón M.B., Dios r.s., ollero H.s. (2008): effects of climate change on the distribution of iberian tree species. Applied vegetation science, 11: 169–178.
Gemmell f. (1999): estimating conifer forest cover with thematic mapper data using reflectance model inversion and two spectral vegetation indices in a site with variable background characteristics. remote sensing of environ-ment, 69: 105–121.
Ghazanfari H. (1996): investigation of the application of satel-lite data for classifying forest types in the forests managed by Mazandaran wood and paper company. [Msc Thesis.] Gorgan, University of Gorgan: 124.
Gitelson A.A., Kaufman y.J., stark r., rundquist D. (2002): novel algorithms for remote estimation of vegetative frac-tion. remote sensing of environment, 80: 76–87. Godinho s., Guiomar n., Machado r., santos P., sá-sousa P.,
fernandes J.P., neves n., Pinto-correia t. (2016): Assess-ment of environAssess-ment, land manageAssess-ment, and spatial vari-ables on recent changes in montado land cover in southern Portugal. Agroforestry systems, 90: 177–192.
Hadi f., Wikantika K., sumarto i. (2004): implementation of forest canopy density model to monitor forest frag-mentation in Mt. simpang and Mt. tilu nature reserves, West Java, indonesia. in: sumarto i. (ed.): Proceedings of the 3rd fiG regional conference, Jakarta, oct 3–7, 2004: 9–20.
Hay G.l., castilla G. (2008): Geographic object-based image analysis (GeoBiA): A new name for a new discipline. in: Blaschke t., lang s., Hay G.J. (eds): object-Based image Analysis – spatial concepts for Knowledge-Driven remote sensing Applications. Berlin, Heidelberg, springer-verlag: 93–112.
Hines M.e., Pelletier r.e., crill P.M. (1993): emission of sulfur gases from marine and freshwater wetlands of the florida everglades: rates and extrapolation using remote sensing. Journal of Geophysical research, 98: 8991–8999. Hosseini s.Z., Khajeddin s.J., Azarnivand H., Khalilpour s.A.
(2004): land use mapping using etM+ data (case study: chamestan area, iran). in: Altan o. (ed.): Proceedings of the 20th isPrs congress, commission vii, istanbul, July 12–23, 2004: 391–393.
Huang c., yang l., Wylie B., Homer c. (2001): A strategy for estimating tree canopy density using landsat 7 etM+ and high resolution images over large areas. Available at http://landcover.usgs.gov/pdf/canopy_density.pdf (ac-cessed Mar 1, 2008).
Huete A.r. (1988): A soil-adjusted vegetation index (sAvi). remote sensing of environment, 25: 295–309.
Huguenin r.l., Karaska M.A., Blaricom D.v., Jensen J.r. (1997): subpixel classification of bald cypress and tupelo gum trees in Thematic Mapper imagery. Photogrammetric engineering & remote sensing, 63: 717–725.
regions: calibrating AvHrr data with tM data. interna-tional Journal of remote sensing, 10: 1805–1812. Jamalabad M.s., Akbar A.A. (2004): forest canopy density
monitoring, using satellite images. in: Altan o. (ed.): Pro-ceedings of the 20th isPrs congress, commission vii, istanbul, July 12–23, 2004: 244–249.
Joshi c., leeuw J.D., skidmore A.K., Duren i.c., van oosten H. (2006): remotely sensed estimation of forest canopy density: A comparison of the performance of four methods. international Journal of Applied earth observation and Geoinformation, 8: 84–95.
Korhonen l., Korhonen K.t., rautiainen M., stenberg P. (2006): estimation of forest canopy cover: A compari-son of field measurement techniques. silva fennica, 40: 577–587.
lee J.K., Park r.A. (1992): Application of geoprocessing and simulation modelling to estimate impacts of sea level rise on the northeast coast of florida. Photogrammetric engi-neering & remote sensing, 58: 1579–1586.
liu X.H., skidmore A.K., oosten v.H. (2002): integration of classification methods for improvement of land-cover map accuracy. isPrs Journal of Photogrammetry and remote sensing, 56: 257–268.
lo c.P., Watson l.J. (1998): The influence of geographic sampling methods on vegetation map accuracy evaluation in a swampy environment. Photogrammetric engineering & remote sensing, 64: 1189–1200.
Mahboob J., iqbal f. (2012): forest crown closure assessment using multispectral satellite imagery. African Journal of Agricultural research, 7: 5033–5042.
Matsushita B., yang W., chen J., onda y., Qiu G. (2007): sensitivity of the enhanced vegetation index (evi) and normalized difference vegetation index (nDvi) to topo-graphic effects: A case study in high-density cypress. forest sensors, 7: 2636–2651.
Mirakhorlo K.H. (2003): land cover/land use mapping of the northern forests of iran using landsat etM+ data. iranian Journal of forest and Poplar research, 1: 1–11. (in Persian) Moeinazad tehrani s.M., Darvishsefat A.A., namiraniyan
M. (2008): evaluation of fcD model for estimation of for-est density using landsat 7 imagery (case study: chalus forest). iranian Journal of forest and Poplar research, 16: 124–138. (in Persian)
næsset e., Gobakken t., Holmgren J., Hyyppä H., Hyyppä J., Maltamo M., nilsson M., olsson H., Persson A., söderman U. (2004): laser scanning of forest resources: The nordic experience. scandinavian Journal of forest research, 19: 482–499.
nandy s., Joshi P., Das K. (2003): forest canopy density strati-fication using biophysical modelling. Journal of the indian society of remote sensing, 31: 291–297.
ostapowicz K., lakes t., Kozak J. (2010): Modelling of land cover change using support vector machine. in: Painho M., santos M.y., Pundt H. (eds): Proceedings of the 13th AGile
international conference on Geographic information sci-ence, Guimarães, May 10–14, 2010.
ozesmi s.l., Bauer M. (2002): satellite remote sensing of wetlands. Wetlands ecology and Management, 10: 381–402.
Pakkhesal e., Bonyad A.e. (2013): classification and delineat-ing natural forest canopy density usdelineat-ing fcD Model (case study: shafarud area of Guilan). iranian Journal of forest and Poplar research, 21: 99–114. (in Persian)
Pal M., Mather P.M. (2003): An assessment of the effective-ness of decision tree methods for land cover classification. remote sensing of environment, 86: 554–565.
Pinty B., verstraete M.M. (1992): GeMi: A non-linear index to monitor global vegetation from satellites. vegetation, 101: 15–20.
Pitkänen J. (2001): individual tree detection in digital aerial images by combining locally adaptive banalization and local maxima methods. canadian Journal of forest research, 31: 832–844.
Qi J., chehbouni A., Huete A.r., Kerr y.H. (1994): A modi-fied soil-adjusted vegetation index. remote sensing of environment, 48: 119–126.
ramtin nia K. (1997): Preparing forest cover type map us-ing digital satellite information in Kheiroudkenar forest – nowshahr. [Msc Thesis.] tehran, University of tehran: 96. (in Persian)
rautiainen M., stenberg P., nilson t. (2005): estimating can-opy cover in scots pine stands. silva fennica, 39: 137–142. rikimaru A., roy P., Miyatake s. (2002): tropical forest cover
density mapping. tropical ecology, 43: 39–47.
rikimaru A., Utsuki y., yamashita s. (1999): Basic study of the maximum logging volume estimation for consideration of forest resources using time series fcD (forest canopy density) model. in: Harris r. (ed.): Asian conference on remote sensing, Manila, nov 16–20, 1998: 6.
rouse J.W., Haas r.H., schell J.A., Deering D.W. (1973): Monitoring vegetation systems in the Great Plains with erts. in: fraden s.c., Marcanti e.P., Becker M.A. (eds): 3rd erts-1 symposium, nAsA sP-351, Washington, D.c., Dec 10–14, 1973: 309–317.
sarvas r. (1953): Measurement of the crown closure of the stand. communicationes instituti forestalis fenniae, 41: 1–13.
schistad-solberg A.H., Jain A.K., taxt t. (1994): Multisource classification of remotely sensed data: fusion of landsat tM and sAr images. ieee transactions on Geoscience and remote sensing, 32: 768–778.
seong J.c., Usery e.l. (2001): Assessing raster representa-tion accuracy using a scale factor model. Photogrammetric engineering & remote sensing, 67: 1185–1191.
(Journal of Applied rs and Gis techniques in natural resource science), 3: 373–383.
shao G., Zhao s., shugart H., Wang s., schaller J. (1996): forest cover types derived from landsat thematic mapper imagery for changbai Mountain area of china. canadian Journal of forest research, 26: 206–216.
shataee s.H. (2003): investigation of the possibility of forest type mapping using satellite information (a case study of Kheiroudkenar forest – nowshahr). [Ph.D. Thesis.] tehran, University of tehran: 155.
shataee s.H., Kalbi s., fallah A., Pelz D. (2012): forest at-tribute imputation using machine-learning methods and Aster data: comparison of k-nn, svr and rf regression algorithms. international Journal of remote sensing, 19: 6254–6280.
sheeren D., fauvel M., Josipović v., lopes M., Planque c., Willm J., Dejoux J.f. (2016): tree species classification in temperate forests using formosat-2 satellite image time series. Journal of remote sensing, 8: 734.
shirian r. (1997): vegetation mapping of Golestan national Park using Gis and landsat tM data. [Msc Thesis.] Gor-gan, University of Gorgan: 99.
sripada r.P., Heiniger r.W., White J.G., Meijer A.D. (2006): Aerial colour infrared photography for determining early in-season nitrogen requirements in corn. Agronomy Jour-nal, 98: 968–977.
statsoft, inc. (2010): statistica. electronic textbook. Avail-able at http://www.statsoft.com (accessed nov 20, 2010). taefi M. (2006): evaluation and optimization of fcD Model
in order to estimate forest canopy Density Using Merger Data Method and image index. tehran, nasir al-Din tusi University: 95.
tucker c.J. (1979): red and photographic infrared linear combinations for monitoring vegetation. remote sensing of environment, 8: 127–150.
Walton J.t. (2008): sub pixel urban land cover estimation: comparing cubist, random forests, and support vector regression. Photogrammetric engineering & remote sens-ing, 74: 1213–1222.
Wang f. (1990): fuzzy supervised classification of remote sensing images. ieee transactions on Geoscience and remote sensing, 28: 194–201.
yi G.c., risley D., Koneff M., Davis c. (1994): Development of ohio’s Gis-based wetland inventory. Journal of soil and Water conservation, 49: 23–28.
Zhang r., Ma J. (2008): An improved svM method P-svM for classification of remotely sensed data. international Journal of remote sensing, 29: 6029–6036.