JOURNAL OF FOREST SCIENCE, 49, 2003 (8): 380–388
Reliable information on the condition of forests in areas of various size, from a fragment of forest district or national park to the whole country, allows to carry out proper forest management and conservation. This is of particular importance at the present time, in the situation when forests increasingly have to fulfil social and protec-tive functions.
The information on the condition of forests can be obtained from various sources, first of all by combining large-area methods of stand characteristic estimation with geodetic methods (e.g. BORECKI 1993; GŁAZ 1994;
ŠMELKO 1999; KLAUSHOFER 2001; FABRIKA, ŠMELKO
2002). The data obtained in this manner are quite adequate for the needs of forest policy concerning the whole coun-try, but they are of little use for the definition of regional, and especially local policy. The estimation of the forest damage degree in a forest district, national park or reserve, covering a relatively small area, but representing a high biological value, should be based on small-area methods which provide an adequate accuracy and can be utilised on a larger scale (LAPPI 2001).
In practice there is often a necessity, for example, to estimate the tree damage degree for a given tree species in the whole national park, and then more accurately in its selected fragment, e.g. in a strictly protected reserve.
The objectives of this study are to demonstrate a small-area method of estimation of spatial distribution of the
tree damage degree based on unrestricted simple random sampling in fields of the SINUS system, and to initially verify it during the estimation of the degree of damage to fir (Abies alba Mill.) and beech (Fagus sylvatica L.) in Święta Katarzyna and Święty Krzyż forest sections of the Świętokrzyski National Park.
A METHOD OF ESTIMATION OF SPATIAL DISTRIBUTION OF THE TREE DAMAGE
DEGREE BASED ON UNRESTRICTED SIMPLE RANDOM SAMPLING IN FIELDS
OF THE SINUS SYSTEM
Introductory assumptions
The European classification assumed by the Inter-national Co-operative Programme on Assessment and Monitoring of Air Pollution Effects on Forests – ICP was used for estimation of the tree damage degree. There are four damage degrees distinguished in this classification, depending on the percentage of the assimilative appara-tus decline (BORECKI, KECZYŃSKI 1992; LORENZ et al.
2002). The tree damage degree is presented in area units of the SINUS system of Information on Natural Environ-ment (CIOŁKOSZ 1991).
A survey sampling was used for the estimation of spa-tial distribution of the tree damage degree. This method,
A statistical small-area method of estimation of spatial distribution
of the tree damage degree
R. P
ODLASKIŚwiętokrzyski National Park, Scientific and Research Laboratory, Bodzentyn, Poland
ABSTRACT: The objectives of this study are to demonstrate a small-area method of estimation of the spatial distribution of the tree damage degree, and to initially verify it during the assessment of fir (Abies alba Mill.) and beech (Fagus sylvatica L.) vitality in the Świętokrzyski National Park. In order to estimate the degree of tree damage the classification based on the degree of defolia-tion, and assumed by the International Co-operative Programme on Assessment and Monitoring of Air Pollution Effects on Forests – ICP, was used. The tree damage degree is presented in P3 fields of the SINUS System of Information on Natural Environment. To estimate the spatial distribution of the tree damage degree an unrestricted simple random sampling scheme was used. During the initial verification of the presented method the total error as well as errors of the upper and lower intervals were analysed in two forest sections of the Świętokrzyski National Park, i.e. on the total area of 1,997.18 ha. The maximum total errors in individual P3 fields of the SINUS system for fir and beech amounted to 31.3%. The average errors (total, of upper and lower intervals) were
lower than 25% for both tree species. The method presented in this paper can become a valuable complement to existing large-area methods of the tree damage degree estimation since it allows to determine the tree vitality in a whole forest district or national park, as well as in individual compartments or even subcompartments.
thanks to its sampling scheme, allows, among others (e.g.
KISH 1995; WYWIAŁ 1995):
a) to estimate the tree damage degree for a given species, i.e. to compute the tree fractions and corre-sponding confidence intervals in individual damage degrees;
b) to increase in a simple manner the accuracy of the damage degree estimation in selected fragments of the area under investigations.
Tree damage degree estimation
A degree of the assimilative apparatus decline is one of the most important measures of the tree damage de-gree estimation in Europe (e.g. ZAJĄCZKOWSKI 1993;
DMYTERKO 1994; LANDMANN, BOUHOT-DELDUC
1995; LECH 1995; SIEROTA 1995, 1998). The follow-ing European classification, commonly used in this type of studies (BORECKI, KECZYŃSKI 1992; LORENZ et al. 2002), was assumed:
– 0 – trees without damage (assimilative apparatus loss up to 10%);
– 1 – trees little damaged (assimilative apparatus loss from 11 to 25%);
– 2 – trees with medium damage (assimilative apparatus loss from 26 to 60%);
– 3 – trees strongly damaged (assimilative apparatus loss 61% and more).
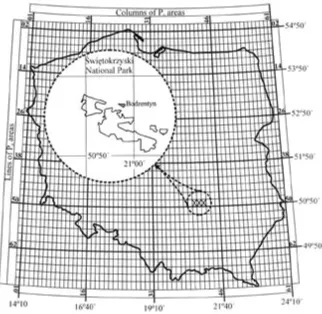
[image:2.595.74.397.438.752.2]Characteristics of the SINUS system of information on natural environment The network of the SINUS system of Information on Natural Environment covers the entire territory of Poland. It is composed of blocks – ellipsoidal trapezoids (marked with symbol P0) having dimensions of about 12,000 × 18,000 m (Fig. 1). The P0 blocks are divided into P1 fields, about 2,000 × 2,000 m, and subsequently into P2, P3, …, P7 fields by divid-ing, without the remainder, the fields of a higher order into 4 fields of a lower order (CIOŁKOSZ 1991). The field P3 is a basic unit of the SINUS system used for the estimation of the spatial distribution of the tree damage degree, however, fields of other dimensions can also be used. The criterion deciding on the choice of a given field of the SINUS system is, above all, the estimation accuracy required. All divisions of blocks and fields are made in an arc measure, and after conversion into a linear measure we obtain a certain approxi-mation that is also dependent on the block latitude.
A mutual overlay of the management maps of state for-ests or national parks and the SINUS network permit: a) to present the collected information in area units of
both systems (forest compartments or subcompart-ments, and the SINUS system fields);
b) to become independent of relatively frequent changes of compartment and subcompartment boundaries tak-ing place durtak-ing consecutive revisions of forest man-agement and protection plans.
Population, statistical unit, characteristic In the method of assessment of the tree damage degree spatial distribution, presented in this paper, the tree popu-lations can be distinguished:
a) before initiation of field work, on the basis of stand taxation data;
b) during field work, by choosing trees fulfilling certain criteria.
The tree populations distinguished on the basis of cer-tain criteria can occupy the same area being “under one another”, or they can occupy neighbouring areas, thus being “beside one another”. For each tree population we estimate separately the fractions of the degree of the as-similative apparatus loss. The populations are designated in area units of the SINUS system. One population oc-cupies the whole area of a given unit of the system, or its part.
A tree belonging to the population distinguished is a statistical unit. A characteristic to be estimated is a de-gree of tree damage.
Sampling scheme
An unrestricted simple random sampling in individual fields of the SINUS system was used to choose the study points. It should be stressed that the SINUS system network plays an accessory role only (it determines the location of the study points in the system of co-ordinates covering the whole country), and its nodes do not directly decide about the location of the study points.
The change in the accuracy of damage degree as-sessment consists in additional choice of study points according to the unrestricted simple random sampling in selected fields of the SINUS system. The change in the area of damage degree estimation consists in the link of existing and/or addition of other fields of the system. After the addition of points or joining and/or addition of fields it should be checked whether all points together are ar-ranged at random. For this purpose, for example Ripley’s function can be used (RIPLEY 1977), and the function L(r) is computed using, for example, the program ADS acces-sible under the address http://pbil.univ-lyonl.fr/ADE-4/
(GOREAUD, PÉLISSIER 1999; GOREAUD 2000).
Fraction estimation
In the unrestricted simple random sampling with or without replacement, the fraction from a sample is an unbiased fraction estimator (STECZKOWSKI 1995). If in
individual damage degrees there is a small sample, i.e. the random sample size is represented by a small number in comparison with the population size, then for the sampling with as well as without replacement, the sample fraction has a binomial distribution (STECZKOWSKI 1995).
To estimate the confidence interval for the tree fraction in a given damage degree two basic schemes are used most often (STECZKOWSKI 1995):
a) a scheme employing the normal distribution (sam-pling with replacement);
If the tree fraction in a given damage degree in the population is higher than 0.05 and lower than 0.95, and the number of all trees in a sample is larger than 100, to compute the lower and upper limits of the confidence interval the following formulae are used:
p (1 – p)
Hl = p – u1 – α/2 √ –––––– (1) n
p (1 – p)
Hu = p + u1 – α/2 √ –––––– (2) n
where: Hl – lower limit of the confidence interval, Hu – upper limit of the confidence interval,
p – tree fraction from a sample in a given damage degree,
Φ(u1 – α/2) = 1 – α/2, e.g. for α equal 0.05 u1 – α/2
is 1.96,
Φ – normal distribution N (0.1), α – significance level,
n – number of all trees in a sample;
b) a scheme employing the binomial distribution (sam-pling with replacement);
To compute the lower and upper limits of the confidence interval the relationship between the binomial distribu-tion and Snedecor’s F-distribudistribu-tion is used (ZIELIŃSKI,
ZIELIŃSKI 1990):
m
Hl = ––––––––––––––––––––––––––– (3) m + (n – m + 1) F (1⁄2α; vl1; vl2)
(m + 1) F (1⁄2α; vu1; vu2)
Hu = ––––––––––––––––––––––––––– (4) n – m + (m + 1) F (1⁄2α; vu1; vu2)
where: vl1 = 2(n – m + 1), vl2 = 2m,
vu1 = 2(m + 1),
vu2 = 2(n – m),
m – number of trees in a given damage degree in a sample.
If the approximation of the sample fraction distribution through the normal distribution is justifiable, the sample size necessary to estimate the fraction of the population can be computed by the following formula (STECZ
-KOWSKI 1995; BRACHA 1996):
PQ
n = u2
1 – α/2 ––––– (5) d2
where: P – expected order of the magnitude of estimated tree fraction in a given degree of damage,
Q = 1 – P,
d – maximum allowable error of estimation (expressed as a proper fraction, e.g. 0.05).
If P is unknown, then PQ = max = 0.25.
a) for the scheme employing the normal distribution (sampling with replacement, symmetrical confidence interval):
– standard error of estimation: p(1 –p)
dN = √ ––––––– (6) n
b) for the scheme employing the binomial distribution (sampling with replacement, asymmetrical confidence interval):
– total error: H
u – Hl
dB = –––––––– (7) 2
– upper limit error:
dBu = Hu – p (8) – lower limit error:
dBl = p – Hl (9)
VERIFICATION OF THE METHOD OF ESTIMATION OF SPATIAL DISTRIBUTION
OF THE DEGREE OF DAMAGE TO FIR AND BEECH IN ŚWIĘTA KATARZYNA AND ŚWIĘTY KRZYŻ FOREST SECTIONS
MATERIAL AND METHODS
Characteristics of the study area
The investigations were carried out in Święta Katarzyna (50°52´–50°55´N, 20°52´–20°57´E) and Święty Krzyż (50°50´–50°53´N, 21°01´–21°05´E) forest sections of the Świętokrzyski National Park.
Typical brown and grey brown podzolic soils pre-dominate in the investigated area (KOWALKOWSKI
1991), which led to the development of the following associations: Dentario glandulosae-Fagetum, Abietetum polonicum, and Pino-Quercetum (the association names are given according to MATUSZKIEWICZ, MATUSZKIE -WICZ 1996).
The data obtained during a long-term observation period (1955–1994) at the Święty Krzyż meteorological station (50°51´N, 21°03´E; 575 m above sea level) showed that the mean annual temperature was +5.9°C (mean January temperature –5.2°C, and July +15.9°C), the mean annual precipitation was 923 mm, and the growing season lasted for about 182 days.
Field work
In the Institute of Geodesy and Cartography in Warsaw the points delimiting the blocks P0 with code identifica-tion 5041, 5042, and 5043, which cover the area of the Świętokrzyski National Park, were marked on forest management maps (scale 1:5,000) of the Park’s forest
sections. Then, on such maps of Święta Katarzyna and Święty Krzyż sections, the blocks P0 (11,697 × 18,537 m), fields P1 (1,950 × 2,060 m), P2 (975 × 1,030 m), and P3 (487.5 × 515 m) were drafted. In the fields P3 cover-ing Święta Katarzyna and Święty Krzyż forest sections (55 and 50 fields, respectively) the study points and sample trees were chosen at random (PODLASKI 1999). The
unre-stricted simple random sampling scheme, described in the chapter Sampling scheme, was used. On forest manage-ment maps (scale 1:5,000), using 2.5-metre long segmanage-ments, the position of each point was marked on x-axis (487.5 m = 195 segments) and on y-axis (515 m = 206 segments). From a random number table (ZIELIŃSKI 1972) six
num-bers were chosen along a line to form a pair of three-figure numbers. All numbers of the “xxx” form, e.g. 002, 020, 200, are understood to be three-figure numbers. The first number in a pair indicated the position of a 2.5-metre long segment on the x-axis, while the second number on the
y-axis. If one of the numbers was higher than the corre-sponding border values (the first higher than 195 and the second higher than 206) the pair was discarded, and the next one was considered. The point of intersection of two 2.5-metre long segments (on x- and y-axis) determined the co-ordinates of a study point. In each P3 field of the SINUS system 20 study points were selected at random according to the sampling scheme described above. In edge fields 15 or 10 points were chosen. After marking of all points on the forest management maps (scale 1:5,000) they were located in the field by compass measurements.
In the vicinity of each study point (in a radius equal to about the height of the dominant stand) one fir and one beech tree, the closest one to the study point, were chosen. In total, in all P3 fields in Święta Katarzyna and Święty Krzyż forest sections, 1,055 and 990 fir trees re-spectively, from about 70 to about 130 years old, 885 and 860 beech trees respectively, from about 30 to about 90 years old, were selected. In one-storeyed stands sample trees were chosen from the second Kraft’s class, and in stands of complex structure from the upper storey (100 according to IUFRO).
In 1994, using the Atlas of the Assimilative Apparatus Decline of Forest Trees the defoliation degree of sample trees was estimated, and on its basis their damage degree was determined (BORECKI, KECZYŃSKI 1992). In this
estimation a four-degree scale described in the chapter entitled Tree damage degree estimation was used.
Data analysis
For each P3 field of the SINUS system the fractions (α = 0.05) and the errors in estimation of fir and beech fractions in individual damage degrees were computed
(STECZKOWSKI 1995; ZIELIŃSKI, ZIELIŃSKI 1990). To
estimate the confidence interval the scheme using the binomial distribution was applied (formulae 3 and 4 in the chapter Fraction estimation). The errors of the upper and lower limits, as well as the total errors were computed (formulae 7, 8, and 9 in the chapter Fraction estimation). ˆ
ˆ
ˆ
The mean errors of estimation of fir and beech fractions in P3 fields were computed by the following formulae:
– mean total error:
1 lF
dAvB = ﴾–– ∑ dBi ﴿ × 100% (10) lF i = 1
– mean error of upper limit:
1 lF
dAvBu = ﴾–– ∑ dBui ﴿ × 100% (11) lF i = 1
– mean error of lower limit:
1 lF
dAvBl = ﴾–– ∑ dBli ﴿ × 100% (12) lF i = 1
where: dBi – total error in field i of Święta Katarzyna or Święty Krzyż forest section,
dBui – error of upper limit in field i of Święta Katarzyna or Święty Krzyż forest section,
dBli – error of lower limit in field i of Święta Katarzyna or Święty Krzyż forest section,
i = 1, 2, 3,..., 55; lF = 55 – in Święta Katarzyna forest section,
i = 1, 2, 3,..., 50; lF = 50 – in Święty Krzyż forest sec-tion.
RESULTS
Fir
The mean total error reached the highest value for fir trees of medium damage (second degree) and it was 22.1% in Święta Katarzyna forest section, and 20.9% in Święty Krzyż forest section (Table 1).
In Święta Katarzyna forest section the mean error of the upper limit reached the highest value in the first de-gree of damage (23.8%), while in Święty Krzyż forest section in the third degree (23.1%), and the mean error of the lower limit in the second degree in both sections (23.2% in Święta Katarzyna, and 23.9% in Święty Krzyż) (Table 1).
All analysed mean errors reached the lowest value in the zero damage degree, and in Święta Katarzyna and Święty Krzyż forest sections they were as follows: the total error 12.7 and 9.3%, the upper limit error 20.4 and 17.6%, and the lower limit error 4.9 and 0.9%, respectively (Table 1).
The total error ranged from 8.4 to 30.8%, the upper limit error from 11.8 to 35.6%, and the lower limit error from 0.0 to 35.6% (Table 1).
[image:5.595.66.533.72.256.2]ˆ
Table 1. Errors in estimation of fir fractions in P3 fields of the SINUS system network for individual damage degrees
Damage degree
Total error (%) Upper limit error (%) Lower limit error (%)
min. max. mean (d
AvB) min. max.
mean
(dAvBu) min. max.
mean (dAvBl) Święta Katarzyna forest section
0 8.4 26.5 12.7 16.8 35.6 20.4 0.0 17.5 4.9
1 12.4 26.5 19.9 14.3 35.6 23.8 4.9 24.2 16.0
2 17.3 31.3 22.1 11.8 31.3 20.9 14.3 35.6 23.2
3 8.4 30.8 14.4 16.8 34.5 21.3 0.0 27.8 7.4
Święty Krzyż forest section
0 8.4 17.3 9.3 16.8 30.9 17.6 0.0 11.8 0.9
1 8.4 22.8 12.4 16.8 30.9 19.6 0.0 22.8 5.3
2 17.3 30.8 20.9 11.8 27.8 17.8 19.6 33.8 23.9
3 8.4 30.8 18.6 16.8 33.8 23.1 0.0 27.8 14.0
ˆ
ˆ
[image:5.595.68.532.583.756.2]ˆ
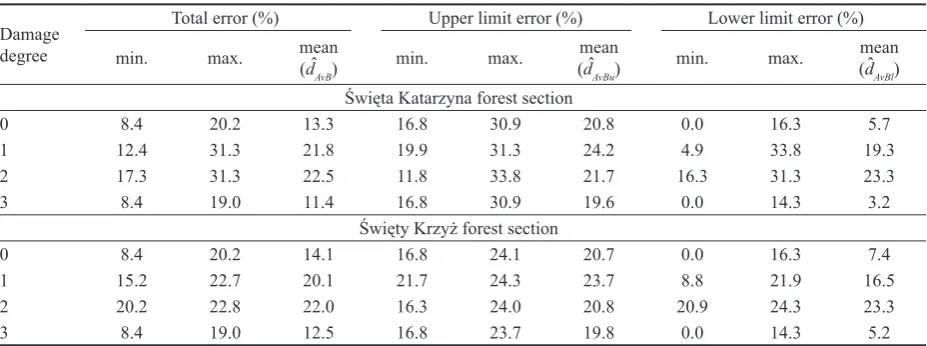
Table 2. Errors in estimation of beech fractions in P3 fields of the SINUS system network for individual damage degrees
Damage degree
Total error (%) Upper limit error (%) Lower limit error (%)
min. max. mean (d
AvB) min. max.
mean
(dAvBu) min. max.
mean (dAvBl) Święta Katarzyna forest section
0 8.4 20.2 13.3 16.8 30.9 20.8 0.0 16.3 5.7
1 12.4 31.3 21.8 19.9 31.3 24.2 4.9 33.8 19.3
2 17.3 31.3 22.5 11.8 33.8 21.7 16.3 31.3 23.3
3 8.4 19.0 11.4 16.8 30.9 19.6 0.0 14.3 3.2
Święty Krzyż forest section
0 8.4 20.2 14.1 16.8 24.1 20.7 0.0 16.3 7.4
1 15.2 22.7 20.1 21.7 24.3 23.7 8.8 21.9 16.5
2 20.2 22.8 22.0 16.3 24.0 20.8 20.9 24.3 23.3
3 8.4 19.0 12.5 16.8 23.7 19.8 0.0 14.3 5.2
ˆ ˆ ˆ
ˆ
ˆ
ˆ
ˆ
ˆ
ˆ ˆ
Generally the analysed errors were higher in Święta Katarzyna forest section (Table 1).
Beech
The mean total error reached the highest value in the case of beech trees of medium damage (second degree), and it was 22.5% in Święta Katarzyna, and 22% in Święty Krzyż forest sections (Table 2).
The mean upper limit error reached the highest values in the first damage degree, and it was 24.2% in Święta Katarzyna, and 23.7% in Święty Krzyż forest sections, while the mean lower limit error in the second damage degree, 23.3% in both sections (Table 2).
All analysed mean errors reached the lowest values in the third degree of tree damage, and they were in Święta Katarzyna and Święty Krzyż forest sections as fol-lows: the total error 11.4 and 12.5%, the upper limit er-ror 19.6 and 19.8%, and the lower limit erer-ror 3.2 and 5.2%, respectively (Table 2).
The total error ranged from 8.4 to 31.3%, the upper limit error from 11.8 to 33.8%, and the lower limit error from 0.0 to 33.8% (Table 2). The errors were similar in both forest sections (Table 2).
DISCUSSION
In Europe several different methods of estimation of forest stand condition are in use. These are usually large-area methods applying the defoliation degree as a criterion. They are based on a restricted cluster sampling (e.g. BORECKI 1993; KOHL, BRASSEL 1996; BORECKI,
ZAJĄCZKOWSKI 1998; SEIDLING 2000; MENCH 2001;
LORENZ et al. 2002).
The degree of tree crown defoliation assumed as the only criterion of tree damage estimation is increasingly questioned, mainly because of its estimate character re-sulting in significant differences in results, depending on a person making observations (e.g. SCHÖPFER 1985;
INNES 1988; INNES, BOSWELL 1988; LECH 1995;
WAWRZONIAK et al. 1999). In such a situation it is
pro-posed to replace the assimilative apparatus loss by another indicator, or to use many parameters including other char-acteristics of the crown or whole tree, e.g. structure, size, crown form, top type, number of annual sets of needles, etc. (e.g. ZAWADA et al. 1981; JAWORSKI 1982; LAND -MANN et al. 1995; SKRZYSZEWSKI 1995; SIEROTA 1998;
SEIDLING 2000).
However, in spite of many reservations, the method of tree damage estimation based on the extent of defo-liation is one of the basic measurements of tree condi-tion assessment (e.g. SCHÖPFER 1985; INNES 1988;
INNES, BOSWELL 1988; LANDMANN, BOUHOT-DEL
-DUC 1995; LECH 1995; SEIDLING 2000; LORENZ et al.
2002).
When choosing a sampling scheme in spatial investi-gations we should take into consideration (KISH 1995;
ŁOMNICKI 1995):
a) the effect of a given sampling scheme on the value, and in the first place on the efficiency (variance size) of estimators used for the parameter assessment; b) a possible need to increase the accuracy of parameter
estimation in some fragments of the analysed area, which is connected with a change in the number of samples in these fragments;
c) practical aspects of investigations.
The following sampling schemes are most often used in spatial investigations:
a) unrestricted simple random sampling with or without replacement, and when the sample size is smaller than 5% of the population size, both these sampling schemes have the same efficiency of estimation, and thus they can be identified with each other (STECZKOWSKI 1995;
JÓŹWIAK, PODGÓRSKI 1997);
b) restricted systematic sampling; c) restricted cluster sampling.
The latter two schemes are used most frequently, and they are often combined into one system (restricted sys-tematic cluster sampling) based on the location of study plots (cluster sampling) in the network nodes (systematic sampling) (KLEIN 1996). Its practical advantages are the
main cause of its frequent application in spatial investiga-tions, namely it is easy to understand the idea of a network with study plots in its nodes, and it is simple to locate the study plots in the field. The main disadvantage of this scheme is the fact that the estimators’ characteristics de-pend on a method of unit arrangement in the population
(IACHAN 1982).
To estimate the spatial distribution of the tree damage degree the scheme of unrestricted simple random sam-pling was used because its application is an optimal solu-tion when (COCHRAN 1977; STECZKOWSKI 1995):
a) we are not sure whether there is any spatial arrange-ment in the population;
b) we do not exclude a possibility of changing the number of samples during future investigations;
c) the population is not too large.
It should also be remembered that samples are often used in a statistical inference. In the theoretical justifica-tion of statistical inference methods it is generally as-sumed that samples on which the inference is based are obtained using the scheme of unrestricted simple random sampling without replacement (simple samples). It means that individual observations are statistically independent, and are submitted to the same theoretical distribution. In the case of other sampling schemes we obtain complex samples. In their case the observations are stochastically dependent and have different distributions. The statisti-cal inference based on complex samples is much more complicated and requires modified statistical methods. The application of tests without modification causes an increase in actual test dimensions, e.g. the application of classical test statistics to a two-stage sampling increased the test size even to 0.80, at α = 0.05 (HOLT et al. 1980;
The magnitude of errors in fraction estimation depends on the number of trees in a sample, and on the value of the tree fraction in a given damage degree in the popula-tion. The increase in the number of trees in a sample and decrease in the product PQ result in the decrease in errors (see formula 5). In this study a small sample was used, i.e. 20 trees in full P3 fields, and 15 or 10 trees in edge fields. At the significance level α = 0.05 the decrease in total errors to, for example, 5 and 10% would require a sample in each P3 field of maximum size of 385 and 97 trees, respectively (assuming the least favourable situ-ation when P = Q = 0.5). In such a situation the following procedure would be the optimal solution:
a) drawing of a sample of 20–30 trees in full P3 fields, and 10–15 in edge fields;
b) estimation of fractions and computation of errors in each field analysed;
c) additional drawing of a required number of trees in se-lected P3 fields, e.g. drawing in addition such a number of trees so as to make a total of 385 trees (errors about 5%), or 97 trees (errors about 10%).
The fields requiring a more accurate analysis are in the first place those in which the estimated tree fractions in individual damage degrees are significantly different from fractions in neighbouring fields.
The errors of the lower interval were higher than those of the upper interval only in the second damage degree. It was caused by the fact that fractions in the second damage degree were higher than 0.5, while in the remaining degrees they were smaller than 0.5. The total error most fully expresses the error magnitude in fraction estimation.
For fir the computed errors were generally higher in Święta Katarzyna than in Święty Krzyż forest section. It was connected with a different number of P3 fields with fir fractions of values close to 0.5 in two forest sections. In Święta Katarzyna section there were more P3 fields in which fir fractions were close to 0.5 than in Święty Krzyż section (PODLASKI 1999, 2002). Beech in these forest
sections was characterised by a similar distribution of P3 fields with fractions of trees of this species close to 0.5, and this is why the errors computed for beech in both for-est sections were similar (PODLASKI 1999, 2002).
The location of study points using compass meas-urements was the most work consuming procedure. A significant saving of time in this respect can be attained using a spatial information system and the GPS technique
(OLENDEREK et al. 1994; KÄTSCH 2001).
CONCLUSIONS
1. The method presented in this paper allows to estimate the spatial distribution of the tree damage degree in a forest district or national park, and also in units rep-resenting a smaller area such as forest section, nature reserve, and even compartment or subcompartment. 2. The European classification (assumed by the
Interna-tional Co-operative Programme on Assessment and
Monitoring of Air Pollution Effects on Forest – ICP) was used for the damage degree estimation. The frac-tions of trees and corresponding confidence intervals in individual damage degrees are presented in P3 fields of the SINUS System of Information on Natural En-vironment. The unrestricted simple random sampling was used for the estimation of spatial distribution of the tree damage degree.
3. The presented method facilitates an increase in esti-mation accuracy in selected fragments of the analysed area, simply by drawing additional study points. 4. The drawn samples are simple samples, and this is why
they can be used for further statistical inference apply-ing classical statistical methods.
5. The maximum total errors in individual P3 fields of the SINUS system, computed during the initial verifica-tion of the presented method amounted to as much as 31.3% for fir and beech. The mean errors (total, and of the upper and lower intervals) did not exceed 25% for both tree species.
6. At the assumed significance level of α = 0.05 the decrease in total errors, e.g. to 5 and 10%, would re-quire drawing a sample of maximum size in each P3 field, i.e. 385 and 97 trees respectively (assuming the least favourable situation when P = Q = 0.5 – see for-mula 5).
7. The method presented in this paper is a small-area method, and thus it can become a valuable comple-ment to the existing large-area methods of estimation of the tree condition spatial distribution.
Acknowledgements
I would like to thank Professor A. JAWORSKI for his
advice during the preparation of this paper, and Dr. Ing.
M. WITRYLAK for translation of the Polish text into the
English language.
References
BORECKI T., 1993. Metodyczne podstawy wielkoobszarowej inwentaryzacji zdrowotnego stanu lasu dla leśnictwa. Pr. IBL, Ser. B, 18: 7–11.
BORECKI T., KECZYŃSKI A., 1992. Atlas ubytku aparatu asy-milacyjnego drzew leśnych. Warszawa, Agencja ATUT: 48. BORECKI T., ZAJĄCZKOWSKI S., 1998. Wielkoobszarowa
kompleksowa inwentaryzacja stanu lasu. Sylwan, 142: 5–15. BRACHA C., 1996. Teoretyczne podstawy metody
reprezenta-cyjnej. Warszawa, PWN: 283.
CIOŁKOSZ A., 1991. SINUS – System informacji o środowisku przyrodniczym. In: MAZUR S. (ed.), Ekologiczne podstawy gospodarowania środowiskiem przyrodniczym. Wizje – pro-blemy – trudności. Warszawa, Wyd. SGGW-AR: 317–328. COCHRAN W.G., 1977. Sampling techniques. New York,
Wiley: 428.
FABRIKA M., ŠMELKO Š., 2002. Aktualizácia stavu lesa a jej spresnenie kontrolným výberovým meraním. Acta Fac. For. Zvolen., 44: 85–98.
GŁAZ J., 1994. Wielkopowierzchniowa inwentaryzacja lasu w Polsce. Las Pol., 11: 16–17.
GOREAUD F., 2000. Apports de l’analyse de la structure spatiale en forêt tempérée à l’étude et la modélisation des peuplements complexes. [Manuscript.] Nancy, ENGREF: 524.
GOREAUD F., PÉLISSIER R., 1999. On explicit formulas of edge effect correction for Ripley’s K-function. J. Veget. Sci., 10: 433–438.
HOLT D., SCOTT A.J., EVINGS P.D., 1980. Chi-squared tests with survey data. J. Roy. Statist. Soc., Ser. A, 143: 303–320. IACHAN R., 1982. Systematic sampling: a critical review.
Internat. Statist. Rev., 50: 293–303.
INNES J.L., 1988. Forest health surveys: problems in assessing observer objectivity. Can. J. For. Res., 18: 560–565.
INNES J.L., BOSWELL R.C., 1988. Forestry health surveys 1987. Part 2: Analysis and interpretation. Forestry Commis-sion Bulletin 79. London, HMSO: 52.
JAWORSKI A., 1982. Fir regression in Polish mountain areas. Eur. J. For. Path., 12: 143–149.
JÓŹWIAK J., PODGÓRSKI J., 1997. Statystyka od podstaw. Warszawa, PWE: 549.
KÄTSCH CH., 2001. Waldinventur im Zeitalter digitaler Fer-nerkundung. Forst u. Holz, 56: 375–379.
KISH L., 1995. Survey Sampling. New York, Wiley: 664. KLAUSHOFER F., 2001. Waldflächenveränderungen. Öster.
Forstz., 112: 22.
KLEIN CH., 1996. Ein Vergleich der Effizienz von verschiedenen Clusterformen in forstlichen Grossrauminventuren. Forstwiss. Cbl., 115: 378–390.
KOHL M., BRASSEL P., 1996. Ein kombiniertes Folgeinventur--Konzept. AFZ Wald, 51: 1020–1022.
KOWALKOWSKI A., 1991. Analiza niektórych właściwości gleb Świętokrzyskiego Parku Narodowego. [Maszynopis.] Kielce, Zakład Geografii Gleb i Ochrony Przyrody WSP: 98.
LANDMANN G., BOUHOT-DELDUC L., 1995. Ground monitoring of crown condition of forest trees in the French Mountains. In: LANDMANN G., BONNEAU M. (eds.), Fo-rest Decline and Atmospheric Deposition Effects in the French Mountains. Berlin, Springer: 3–40.
LANDMANN G., BERT G.D., PIERRAT J.C., BECKER M., BONNEAU M., SOUCHIER B., 1995. Crown damage in Nor-way spruce and silver fir: relation to site and stand factors in the French Mountains. In: LANDMANN G., BONNEAU M. (eds.), Forest Decline and Atmospheric Deposition Effects in the French Mountains. Berlin, Springer: 82–119.
LAPPI J., 2001. Forest inventory of small areas combining the calibration estimator and a spatial model. Can. J. For. Res., 31: 1551–1560.
LECH P., 1995. Przydatność szacunkowej metody określania defoliacji drzew do badań stanu zdrowotnego lasu. Sylwan, 139: 99–109.
LORENZ M., MUES V., BECHER G., SEIDLING W., FISCHER R., LANGOUCHE D., DURRANT D., BARTELS U., 2002. Forest condition in Europe. Results of the 2001 large-scale
survey. Geneva, Brussels, United Nations Economic Com-mission for Europe, European ComCom-mission: 99.
ŁOMNICKI A., 1995. Wprowadzenie do statystyki dla przyrod-ników. Warszawa, PWN: 245.
MATUSZKIEWICZ W., MATUSZKIEWICZ J.M., 1996. Przegląd fitosocjologiczny zbiorowisk leśnych Polski. Phyto-cenosis, 8, Seminarium Geobotanicum 3: 79.
MENCH A., 2001. Zur Methodik der Naturwaldaufnahmever-fahren mit permanenten Stichproben. Allg. Forst- Jagdztg, 172: 12–18.
OLENDEREK H., KORPETTA D., PIEKARSKI E., 1994. Oce-na możliwości budowy i wykorzystania systemów informacji przestrzennej w leśnictwie polskim. Sylwan, 138: 61–71. PODLASKI R., 1999. Kształtowanie się zależności pomiędzy
żywotnością, cechami morfologicznymi korony, a przyros-tem promienia pierśnicy jodły, buka i sosny w wybranych drzewostanach Świętokrzyskiego Parku Narodowego. [Ma-szynopis.] Kraków, Katedra Szczegółowej Hodowli Lasu, AR: 133.
PODLASKI R., 2002. Żywotność jodły (Abies alba Mill.) i buka (Fagus sylvatica L.) na Łysicy w Świętokrzyskim Parku Na-rodowym. Parki Nar. i Rezerw. Przyr., 21: 273–282. RAO J.N.K., SCOTT A.J., 1981. The analysis of categorical data
from complex sample surveys: chi-square tests for goodness of fit and independence in two-way tables. J. Amer. Statist. Assoc., 76: 221–230.
RIPLEY B.D., 1977. Modelling spatial patterns. J. Roy. Stat. Soc. Ser. B, 39: 172–212.
SCHÖPFER W., 1985: Das Schulungs- und Kontrollsystem der terrestrischen Waldschadensinventuren. AFZ Wald, 40: 1353–1357.
SEIDLING W., 2000. Multivariate statistics within integrated studies on tree crown condition in Europe – an overview. Geneva, Brussels, United Nations Economic Commission for Europe, European Commission: 56.
SIEROTA Z., 1995. Zdrowotność a żywotność – próba definicji. Sylwan, 139: 105–118.
SIEROTA Z., 1998. Kryteria i metody oceny stanu zdrowotnego drzew i drzewostanów. Pr. IBL, Ser. A, 854: 75–102. SKRZYSZEWSKI J., 1995. Charakterystyka przyrostowa oraz
kształtowanie się zależności pomiędzy wybranymi cechami drzew a przyrostem promienia na pierśnicy świerka i mod-rzewia. Acta Agr. Silv., Ser. silv., 33: 141–158.
STECZKOWSKI J., 1995. Metoda reprezentacyjna w bada-niach zjawisk ekonomiczno-społecznych. Warszawa, Kraków, PWN: 424.
ŠMELKO Š., 1999. Spresnenie odhadu zásoby dreva v jednot-livých porastoch pri vel’koplošnom dvojfázovom zisťovaní stavu lesa. Acta Fac. For. Zvolen., 41: 253–266.
WAWRZONIAK J., PLUCIAK M., MAŁACHOWSKA J., 1999. Statystyczna ocena zgodności szacunków defoliacji drzew próbnych na stałych powierzchniach obserwacyjnych monitoringu lasu. Pr. IBL, Ser. A, 867: 19–38.
WYWIAŁ J., 1995. Wielowymiarowe aspekty metody reprezen-tacyjnej. Wrocław, Warszawa, Kraków, Ossolineum: 201. ZAJĄCZKOWSKI S., 1993. Ocena zdrowotnego i sanitarnego
ZAWADA J., TWARÓG J., WIDERA S., 1981. Badania przyczyn i hodowlanych następstw regresji jodły w górach. [Maszyno-pis.] Kraków, Sprawozdanie Naukowe IBL, Zakład Gospo-darski Leśnej Regionów Górskich IBL: 36.
ZIELIŃSKI R., 1972. Tablice statystyczne. Warszawa, PWN: 391.
ZIELIŃSKI R., ZIELIŃSKI W., 1990. Tablice statystyczne. Warszawa, PWN: 455.
Received after publication March 6, 2003 Accepted after corrections May 12, 2003
Statistická maloplošná metoda odhadu prostorového rozložení stupně poškození stromů
R. PODLASKI
Národní park Świętokrzyski, Vědecká a výzkumná laboratoř, Bodzentyn, Polsko
ABSTRAKT: Cílem studie byla demonstrace maloplošné metody odhadu prostorového rozložení stupně poškození stromů
a její předběžné ověření pomocí hodnocení vitality jedle (Abies alba Mill.) a buku (Fagus sylvatica L.) v Národním parku Świę-tokrzyski. Pro odhad stupně poškození stromů jsme použili klasifikaci založenou na stupni defoliace a přijatou v Mezinárodním kooperačním programu pro hodnocení a monitorování účinků znečištění ovzduší na lesy – ICP. Stupeň poškození stromů je prezentován v polích P3 systému informací SINUS o přírodním prostředí. Pro odhad prostorového rozložení stupně poškození
stromů jsme použili metodu jednoduchého náhodného výběru bez omezení. V průběhu počátečního ověřování uvedené metody jsme prováděli analýzu celkové chyby a chyb horního a dolního intervalu ve dvou lesních úsecích Národního parku Święto-krzyski, tj. na celkové rozloze 1 997,18 ha. Maximální celkové chyby v jednotlivých polích P3 systému SINUS pro jedli a buk dosahovaly 31,3 %. Hodnoty průměrných chyb (celková chyba, chyba horního a dolního intervalu) byly pro obě dřeviny nižší než 25 %. Metoda předložená v příspěvku se může stát cenným doplňkem existujících velkoplošných metod odhadu stupně poškození stromů, protože umožňuje stanovit vitalitu stromů jak na celém zájmovém území nebo národním parku, tak v jed-notlivých odděleních nebo i v nižších jednotkách rozdělení lesa.
Klíčová slova: výběrové šetření; jednoduchý náhodný výběr bez omezení; systém SINUS; defoliace; Abies alba; Fagus sylva-tica; Národní park Świętokrzyski
Corresponding author: