Soil microbial biomass is a dynamic force driving soil phosphorus (P) cycling in soils (Perrott and Sarathchandra 1989). Estimating microbial P in soil biomass is important for understanding these cycles and characterizing bioavailable P fractions (Selles et al. 1995). Exhaustive reviews are available to describe these methods (Martens 1995). However, there is a growing concern that some of these methods may not be as reliable as others (Wu et al. 1996), despite the intention of measuring the same pool. The most common methods are variants of chloroform fumi-gation-incubation (CFI) (Jenkinson and Powlson 1976), chloroform fumigation-extraction (Vance et al. 1987), substrate-induced respiration (Anderson and Domsch 1978) and adenosine triphosphate (Webster et al. 1984).
Chloroform fumigation-incubation has become the most widely used method for determining mi-crobial biomass C, and a citation classic (Martens 1995). It is the standard to which most other newer methods are compared. Most workers analyze du-plicate soil samples, one treated with a biocide and the other not treated (Hedley and Stewart 1982, Perrott and Sarathchandra 1989). The difference between extractable P in the two samples is an estimate of Pm. A recovery factor (Kp) is often used to improve the accuracy of Pm estimates (Joergensen et al. 1995).
Values for Kp may vary among soils. McLaughlin et al. (1986) reported Kp of 0.33, 0.40, and 0.57 for three soils. Similarly, Hedley and Stewart (1982) reported Kp ranging from 0.32 to 0.47 on different
Evaluation of effect of different sterilization methods on soil
biomass phosphorus extracted with NaHCO
3
A.A.S. Sinegani
1, A. Hosseinpur
21
Bu-Ali Sina University, Hamedan, Iran
2
Shaher-e-Kord University, Shaher-e-Kord, Iran
ABSTRACT
Soil microbial biomass is a dynamic force driving soil phosphorus cycling in soils. The temperature, time and meth-od for killing soil organisms in soil biomass P determination are so important factors that affect the results. The aim of this study was to compare some methods of soil sterilization and soil microbial P (Pm) release in extraction with NaHCO3. Five samples of calcareous soils in three replicates were incubated in field capacity and 28°C. The texture of soils differed from loamy sand to sandy loam. They had 10–15% equivalent calcium carbonate, 1–3% organic carbon and 40–90 mg/kg available P content. After 1, 10, 30, and 50 days of incubation a portion of each soil was sterilized by five methods (chloroform fumigation, autoclaving at 121°C for 0.5 h, oven drying at 70°C for 48 h, oven drying at 180°C for 2 h, and ultrasonification). Phosphorus of the sterilized and control soils were extracted with 0.5M NaHCO3 (pH 8.5) and determined spectrophotometrically as blue molybdate-phosphate complexes under partial reduction with ascorbic acid. Results showed that the method of soil sterilization and soil type had sig-nificant effects on biomass P estimated in soils (P < 0.01). There were no significant differences between extracted biomass P at chloroform fumigation, autoclaving at 121°C for 0.5 h, and oven drying at 70°C for 48 h. However bio-mass P was significantly more extracted from soil by oven drying at 180°C for 2 h and by ultrasonification. Fixation of Pm in soil during the extraction period can reduce the precision of biomass P estimates. This effect was more obvious in biomass P determination by fumigation and oven drying at 70°C for 48 h. Biomass P determined by these methods and autoclaving had positive and significant correlations with soil sand contents, respectively due to long sterilization period and temperature. Ultrasonification released more P from these calcareous soils especially at the start of soil incubation. It released higher microbial P and reduced P sorption in soils; biomass P determined by this method compared to other methods had relatively higher correlations with fungi, glumales spore and P solubilizing bacteria numbers in soil.
soils, and noted that ideally, calibration should be made for each soil. Even after determining Kp for a given soil, uncertainty may remain whether the types of fungi and bacteria used for calibration actually represent the indigenous microbes in the soil. Variability in Kp between different soils and different microbes led Selles et al. (1995) to omit use of any Kp values in reporting Pm.
Chloroform is often used to lyse microbial cells in soil (Joergensen et al. 1995, Selles et al. 1995). McLaughlin et al. (1986) found that hexanol is just as effective as chloroform and is safer be-cause chloroform is a suspected carcinogen. A solution of 0.5M NaHCO3 is most often used for extracting Pm from soil biomass (Potter et al. 1991, Joergensen et al. 1995). When comparing various extractants in soil biomass studies, Brookes et al. (1982) reported that 0.5M NaHCO3 adjusted to pH 8.5 was the most satisfactory. Other studies found that ion-sink extraction of Pm has advantages over bicarbonate extraction (Kouno et al. 1995).
The objectives of this study were (i) to compare the efficiency of chloroform fumigation, autoclav-ing at 121°C for 0.5 h, oven dryautoclav-ing at 70°C for 48 h, oven drying at 180°C for 2 h, and ultrasonification in soil biomass release, and (ii) to investigate the relation between biomass P estimated by different methods and some soil properties.
MATERIALS AND METHODS
Soil sampling and analysis. Compound surface (0–30 cm) soils were sampled in three replicates from five locations with semiarid climates in the Hamadan province in northwest of Iran. Air-dry soils were subsequently crushed and sieved to pass a 2-mm mesh screen.
Particle-size analysis: hydrometer method (Gee and Bauder 1986); calcium carbonate equivalents (CCE): back titration procedure (Leoppert and Suarez 1996); soil pH and electrical conductivity (EC): 1:2 soil: water extract after shaking for 30 min (Hesse 1971); organic carbon (OC): dichromate oxidation and titra-tion with ferrous ammonium sulfate (Walkley and Black 1934); total nitrogen (TN): Kjeldahl method (Hinds and Lowe 1980); cation-exchange capacity (CEC): according to Bower et al. (1952); available phosphorus: extraction with 0.5M NaHCO3 (pH 8.5) and determination spectrophotometrically as blue molybdate-phosphate complexes under partial reduction with ascorbic acid (Jackson 1958).
Fresh soil samples were stored at 4°C for micro-biological analyses. Heterotrophic bacteria and
fungi populations were estimated by the plate count method. Soil suspension and dilutions were pre-pared in sterilized and distilled water. Media of nutrient agar (NA), rose bengal starch casein nitrate agar (RBSCNA) and modified potato dextrose agar (MPDA) were prepared in laboratory and used for determination of total soil bacterial, actinomyc-etes and fungi populations, respectively (Alef and Nannipieri 1995). Each solid medium was inoculated with 0.05 cm3 of soil dilution. It was incubated at 27°C. The numbers of colonies on each medium were counted and reported as CFU (colony-forming units)/g soil. Spores of VAM fungi (glumales) were isolated from 50 cm3 sub-samples by wet sieving fol-lowed by sucrose gradient centrifugation and were then counted (Sylvia 1994). The media forAzotobacter enumeration was a solid and N-free medium which contained sucrose, mineral salts, bromothymole blue and agar (LG medium). Colony-forming units on the solid media were numbered after a week of incubation at 27°C (Alef and Nannipieri 1995, Subba Rao 2001).
Treatments of soil samples. A factorial experi-ment with complete randomized design with three replicates was conducted. Five samples of calcar-eous soils were incubated at field capacity and 28°C. After 1, 10, 30, and 50 days of incubation a portion of each soil was sterilized by five methods (chloroform fumigation, autoclaving at 121°C for 0.5 h, oven drying at 70°C for 48 h, oven drying at 180°C for 2 h, and ultrasonification). Phosphorus of the sterilized and unsterilized soils (control soils) were extracted with 0.5M NaHCO3 (pH 8.5) and determined spectrophotometrically as blue molybdate-phosphate complexes. The difference between extractable P in the two samples (sterilized and control soil) was calculated as an estimate of Pm by each method of soil sterilization.
Statistical analyses. Data were statistically ana-lyzed for standard deviations, means were calcu-lated, and Duncan’s new multiple range tests were performed to assess the effect of the method of soil sterilization, soil type (Tables 1 and 2), time and their interactions on soil Pm estimates. The cor-relation coefficients between soils Pm determined by different methods and some properties of soils at the start of incubation were also studied.
RESULTS AND DISCUSSIONS
loamy sand. Soil 1 had the highest clay contents and soil 4 had the highest sand contents as compared to the other soils. All soils were calcareous and they had low EC and almost neutral pH. Soils 1, 2 and 4 had relatively higher OC and OP compared to other soils. Available P in all soils was higher than its critical level in calcareous soils (10 mg/kg). Soil 3 had lower available P as compared to the other soils. In general, soil 2 had higher fertility and soil 3 had relatively lower fertility. Fungal populations, glumales spore numbers and phosphorus solubiliz-ing bacteria numbers were significantly higher in soil 2 as compared to those in other soils (Table 2). They were 5.61 × 10⁴, 90.6 and 4.84 × 10⁶ CFU/g soil, respectively. However total bacterial and azotobacterial populations were higher in soil 1 compared to other soils. Actinomycetes had higher population in soil 3 (4.01 × 10⁶ CFU/g soil).
Soil biomass P determination. Analysis of vari-ance showed that the method of soil sterilization, soil type and the interaction between the method of soil sterilization and time of extraction had
significant effects on biomass P estimated in soils (P < 0.001). Time of extraction and the interaction between soil type and time of extraction also had a significant effect on biomass P estimated in soils (P < 0.05). The interaction between the method of soil sterilization and soil type had no significant effect on biomass P in soils (Table 3).
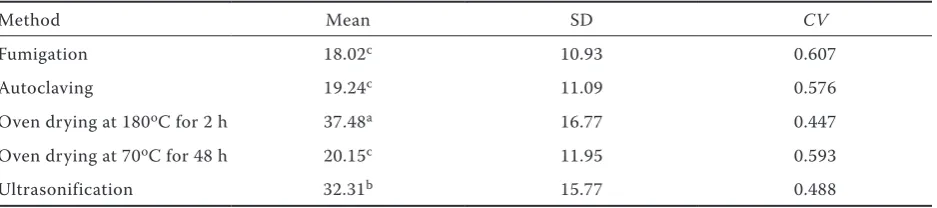
Some methods applied in determining of soil biomass P had significant differences (Table 4). Soil oven drying at 180°C for 2 h released sig-nificantly higher P than the other methods. Oven drying of soils at 180°C for 2 h not only kills soil microorganisms but also mineralizes some organic maters. Microbial biomass and its products may be associated with freeprimary soil particles (i.e. sand, silt, and clay), aggregates, and macroorganic matter. So, biomass P may be more released by ultrasonification compared to other methods. However, biomass P determined by soil chloro-form fumigation, soil autoclaving and oven drying at 70°C for 48 h had no significant differences. Although standard deviations of biomass P de-Table 1. Mean of selected chemical and physical characteristics of Hamadan region soils (n = 3)
Soil number Clay (%) Silt (%) Sand (%) EC* (dS/m) pH ECC* (%)
1 17.8a 15.4b 66.8d 0.02b 6.95c 11.1c
2 8.74d 17.1b 74.2c 0.02b 7.33a 12.5b
3 15.9b 20.6a 63.5e 0.02b 6.95c 11.5c
4 14.2bc 1.99d 83.8a 0.04a 7.11b 13.6a
5 13.7c 9.28c 77.1b 0.02b 7.11b 14.4a
Soil number OC (%) TN (%) OP (mg/kg) Available P (mg/kg)
1 2.47a 0.2b 745.5b 79.83a
2 3.08a 0.2b 817.8a 72.13a
3 1.89b 0.21b 628.3c 38.17b
4 2.40ab 0.21b 708.2b 80.88a
5 0.99c 0.23a 692.9bc 72.55a
[image:3.595.65.533.77.271.2]*EC – electrical conductivity, ECC – equivalent calcium carbonate
Table 2. Selected biological characteristics of Hamadan region soils (n = 3)
Soil
number (CFUFungi × 104/g) Spores of glumales (N/g) Actinomycetes (CFU × 104/g) (NBacteria × 107/g) (N × PSB 106/g) Azotobacter(N × 106/g)
1 2.52c 69b 302b 10a 4.5ab 5.35a
2 5.61a 90.6a 361ab 4.3d 4.84a 2.8bc
3 3.55b 37.8c 401a 6.7bc 4.3ab 2.24c
4 1.97c 59.8b 373ab 5.7c 4.1b 2.3bc
5 2.69c 30.8c 299b 7.5b 3.96b 3.26b
[image:3.595.64.532.629.743.2]termined by soil ultrasonification and oven dry-ing of soils at 180°C for 2 h were higher than the others, coefficient of variation of these methods were relatively low. The standard variations and coefficient of variation of biomass P determined by soil chloroform fumigation, soil autoclaving and oven drying at 70°C for 48 h were relatively equal to each other.
Mean of biomass P in some soils was significantly different (Table 5). Soil 2 and soil 3 compared to other soils had the highest and the lowest biomass P, respectively. Biomass P in soil 2 compared to other soils had the highest standard variation and the lowest coefficient of variation. However, bio-mass P in soil 3 had the lowest standard deviation and the highest coefficient of variation.
Although soil biomass P fluctuated during incuba-tion, it did not change significantly in soils for 50 days of incubation (Table 6). The standard variations and coefficient of variations of biomass P determined in different times were also near each other.
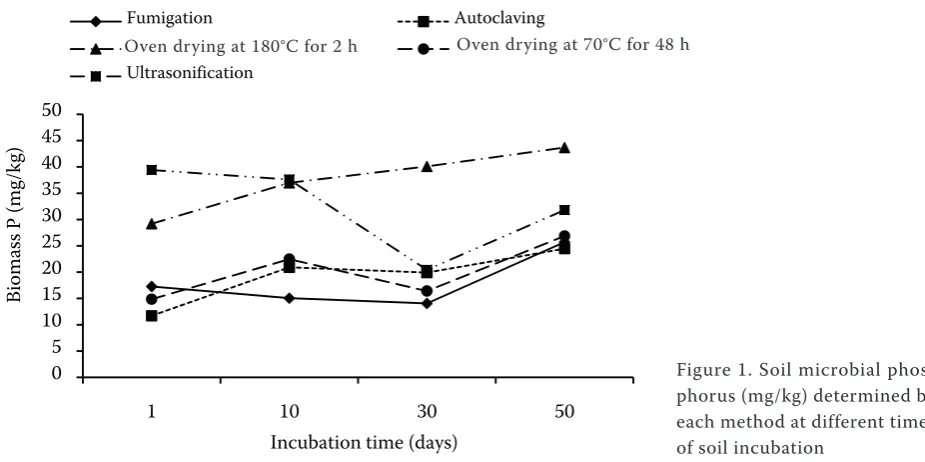
Figure 1 shows that soil biomass P determined by ultrasonification was higher than that determined by oven drying at 180°C for 2 h in the start of soil incubation. But soil biomass P determined by oven drying at 180°C for 2 h was increased with time of incubation and it was higher than that determined by ultrasonification in the 10, 30 and 50 days of
soil incubation. Fixation of Pm by soil particles during the soil sterilization and extraction period can reduce the precision of biomass P estimates. This effect was more obvious in biomass P deter-mination by fumigation and oven drying at 70°C for 48 h. Soil biomass P determined by these method was significantly lower than those determined by other methods in all time of soil analysis.
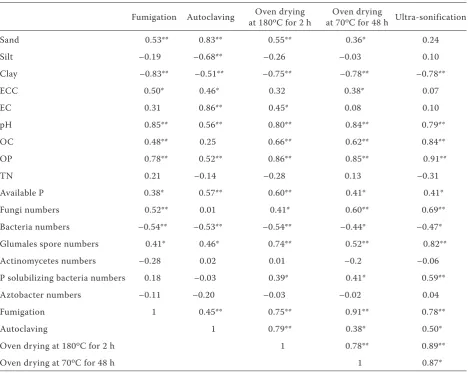
[image:4.595.64.532.91.211.2]Table 7 shows the correlation coefficients be-tween soil microbial phosphorus determined by different methods and some soil properties at the start of incubation. Soil biomass P determined by fumigation, autoclaving, oven drying at 180°C for 2 h and oven drying at 70°C for 48 h showed positive and significant correlations with soil sand content. The correlation coefficients between sand soil content and biomass P determined by autoclaving and ultrasonification methods were the highest and the lowest ones, respectively. The correlation coefficients between soil microbial phosphorus determined by different methods and soil clay content were negative and significant. These results may be related to the adsorption of released biomass P in soils before extracted with NaHCO3. Fixation of microbial P by soil during the extraction period can reduce the precision of Pm estimates. Sometimes corrections for P fixa-tion are made by spiking a reference sample with Table 3. The effect of method of soil sterilization, soil type, time of extraction and their interactions on soil microbial phosphorus
Source df Mean square P > F
Method of soil sterilization 4 1567.919 0.0001
Soil type 4 2669.096 0.0001
Time of extraction 3 86.3879 0.0401
Method × soil 16 52.23046 0.2058
Method × time 12 152.685 0.0003
Soil × time 12 85.99192 0.025
Table 4. Duncan’s new multiple range tests of means and standard deviations and coefficient of variation for soil microbial phosphorus (mg/kg) determined by different methods
Method Mean SD CV
Fumigation 18.02c 10.93 0.607
Autoclaving 19.24c 11.09 0.576
Oven drying at 180oC for 2 h 37.48a 16.77 0.447
Oven drying at 70oC for 48 h 20.15c 11.95 0.593
Ultrasonification 32.31b 15.77 0.488
[image:4.595.65.534.638.742.2]P at the beginning of the extracting period, and then using the portion of the spike recovered after extraction to estimate the amount of Pm fixed by the soil during extraction (Brookes et al. 1982, McLaughlin et al. 1986). Soils with high P sorption capacities may have lower Kp values (Hedley and Stewart 1982). When bicarbonate is used as a soil extractant, erratic Pm values obtained from acidic and highly weathered soils are attributed to high P sorption capacities (Potter et al. 1991). Because of the variation of P sorption in different soils, some authors have omitted attempts to correct for this factor (Selles et al. 1995). Soil preparation for Pm determination may vary among different procedures. Sometimes the soil has been dried, sometimes ground, and sometimes used in the original field-moist state (Brookes et al. 1982, Hedley and Stewart 1982, Selles et al. 1995). Air drying or grinding soils may cause quantitative and qualitative changes in biota and biomass (Brookes et al. 1982, McLaughlin et al.
1986). In our study wet soils were sterilized without grinding. However, the negative effect of soil clay content on soil biomass P determined by autoclaving compared was lower to other methods. This may be related to the shorter time for soil sterilization and P sorption in this method.
[image:5.595.305.531.106.192.2]The correlation coefficients between soil biomass P determined by all methods and soil equivalent carbonate calcium contents were positive but it was not significant in oven drying at 180°C for 2 h and ultrasonification methods. Soil electrical conductivity had a positive correlation with Pm determined by all methods. This correlation was higher and significant in autoclaving and oven dry-ing at 180°C for 2 h methods. Soil organic carbon and organic P had significant correlations with Pm determined by all methods. These correlations were higher in ultrasonification method. It may be due to better dispersion of soil particles and higher Pm release in this method.
Table 5. Duncan’s new multiple range tests of means and standard deviations and coefficient of variation for microbial phosphorus (mg/kg) in different soils
Soil Mean SD CV
1 26.29b 11.59 0.441
2 41.64a 16.03 0.385
3 9.182c 6.657 0.725
4 26.80b 10.62 0.396
5 23.30b 11.61 0.498
[image:5.595.63.293.106.207.2]Means followed by the same letter are not significantly different (P < 0.05)
Table 6. Duncan’s new multiple range tests of means and standard deviations and coefficient of variation for microbial phosphorus (mg/kg) in different times
Time (days) Mean SD CV
1 22.48a 14.29 0.636
10 26.60a 16.91 0.636
30 22.18a 14.39 0.649
50 30.50a 15.5 0.508
Means followed by the same letter are not significantly different (P < 0.05)
0 5 10 15 20 25 30 35 40 45 50
1 10 30 50
Biomass
P
(mg/kg)
Incubation time (days)
Fumigation Autoclaving
Oven drying at 180 oC for 2 h Oven drying at 70 oC for 48 h Ultrasonification
Figure 1. Soil microbial phos-phorus (mg/kg) determined by each method at different times of soil incubation
[image:5.595.63.526.534.765.2]Soil total N had no significant correlation with Pm. However, the correlations of soil pH and avail-able P with Pm determined by all methods were positive and significant.
Although the correlation coefficients between fungi colony-forming units in soils and Pm de-termined by all methods were positive and high, however this correlation was not significant in autoclaving methods. The correlations between bacterial number and Pm determined by all meth-ods were negative and significant. Glumales spore numbers and soil biomass P had positive and sig-nificant correlations. The correlation coefficients between glumales spore numbers and biomass P determined by oven drying at 180°C for 2 h, oven drying at 70°C for 48 h and ultrasonification were relatively higher. Phosphorus solubilizing bacteria numbers had significant correlations with biomass P determined by oven drying at 180°C for 2 h,
oven drying at 70°C for 48 h and ultrasonification methods. Actinomycetes and azotobacter numbers had no significant correlations with biomass P determined by all methods.
The correlation coefficients between soil micro-bial phosphorus determined by different meth-ods were positive and significant. However, the correlation coefficients between soil biomass P determined by time-consuming methods (i.e. soil fumigation and oven drying at 70°C for 48 h) were higher than those determined by other methods and vice versa (Table 7).
Acknowledgements
[image:6.595.64.533.89.462.2]This study was supported by funds allocated by the Vice President for Research of the Bu-Ali Sina University. We acknowledge the assistance Table 7. Correlation coefficients between soil microbial phosphorus determined by different methods and some soil properties at the start of incubation
Fumigation Autoclaving at 180Oven drying oC for 2 h at 70Oven drying oC for 48 h Ultra-sonification
Sand 0.53** 0.83** 0.55** 0.36* 0.24
Silt –0.19 –0.68** –0.26 –0.03 0.10
Clay –0.83** –0.51** –0.75** –0.78** –0.78**
ECC 0.50* 0.46* 0.32 0.38* 0.07
EC 0.31 0.86** 0.45* 0.08 0.10
pH 0.85** 0.56** 0.80** 0.84** 0.79**
OC 0.48** 0.25 0.66** 0.62** 0.84**
OP 0.78** 0.52** 0.86** 0.85** 0.91**
TN 0.21 –0.14 –0.28 0.13 –0.31
Available P 0.38* 0.57** 0.60** 0.41* 0.41*
Fungi numbers 0.52** 0.01 0.41* 0.60** 0.69**
Bacteria numbers –0.54** –0.53** –0.54** –0.44* –0.47*
Glumales spore numbers 0.41* 0.46* 0.74** 0.52** 0.82**
Actinomycetes numbers –0.28 0.02 0.01 –0.2 –0.06
P solubilizing bacteria numbers 0.18 –0.03 0.39* 0.41* 0.59**
Aztobacter numbers –0.11 –0.20 –0.03 –0.02 0.04
Fumigation 1 0.45** 0.75** 0.91** 0.78**
Autoclaving 1 0.79** 0.38* 0.50*
Oven drying at 180oC for 2 h 1 0.78** 0.89**
Oven drying at 70oC for 48 h 1 0.87*
of A. Mahohi, M. Farokhnia, T. Rashidi and M. Afzalpur in some laboratory analyses.
REFERENCES
Alef K., Nannipieri P. (1995): Methods in Applied Soil Microbi-ology and Biochemistry, Academic Press, Harcourt Brace and Company, London.
Anderson J.P.E., Domsch K.H. (1978): A physiological method for the quantitative measurement of microbial biomass in soils. Soil Biology and Biochemistry, 10: 215–221.
Bower C.A., Reitmeir R.F., Fireman M. (1952): Exchangeable cation analysis of saline and alkali soils. Soil Science, 73: 251–261. Brookes P.C., Powlson D.S., Jenkinson D.S. (1982): Measurement
of microbial biomass phosphorus in soil. Soil Biology and Biochemistry, 14: 319–329.
Gee G.W., Bauder J.W. (1986): Particle size analysis. In: Klute A. (ed.): Method of soil analysis, Part 1: Physical and minera-logical methods, Soil Science Society of America, Madison, Wisconsin, 383–411.
Hedley M.J., Stewart J.W.B. (1982): Method to measure microbial phosphate in soils. Soil Biology and Biochemistry, 14: 377–385. Hesse P.R. (1971): A Text Book of Soil Chemical Analysis. John
Murray, London.
Hinds A., Lowe L.E. (1980): Ammonium-N determination. Soil nitrogen, Berthelot reaction. Communications in Soil Science and Plant Analysis, 11: 469–475.
Jackson M.L. (1958): Soil Chemical Analysis. Prentice Hall, En-glewood Cliffs, New Jersay.
Jenkinson D.S., Powlson D.S. (1976): The effects of biocidal treat-ment on metabolism in soil. V. A method for measuring soil biomass. Soil Biology and Biochemistry, 8: 209–213. Joergensen R.G., Kübler H., Meyer B., Wolters V. (1995):
Micro-bial biomass phosphorus in soils of beech (Fagus sylvatica L.) forests. Biology and Fertility of Soils, 19: 215–219.
Kouno K., Tuchiya Y., Ando T. (1995): Measurement of soil mi-crobial biomass phosphorus by an anion exchange membrane method. Soil Biology and Biochemistry, 27: 1353–1357.
Leoppert R.H., Suarez G.L. (1996): Carbonates and Gypsum. In: Sparks D.L. (ed.): Methods of soil analysis. Part 3: Chemical methods. Madison, Wisconsin.
Martens R. (1995): Current methods for measuring microbial biomass C in soil: potentials and limitations. Biology and Fertility of Soils, 19: 87–99.
McLaughlin M.J., Alston A.M., Martin J.K. (1986): Measurement of phosphorus in the soil microbial biomass: a modified procedure for field soils. Soil Biology and Biochemistry, 18: 437–443. Perrott K.W., Sarathchandra S.U. (1989): Phosphorus in the
mi-crobial biomass in New Zealand soils under established pasture. New Zealand Journal of Agricultural Research, 32: 409–413. Potter R.L., Jordan C.F., Guedes R.M., Batmanian G.J., Han X.G.
(1991): Assessment of a phosphorus fractionation method for soils: problems for further investigation. Agriculture, Ecosystem and Environment, 34: 453–463.
Selles F., Campbell C.A., Zentner R.P. (1995): Effect of cropping and fertilization on plant and soil phosphorus. Soil Science Society of America Journal, 59: 140–144.
Subba Rao N.S. (2001): Soil Microbiology. 4th Edition. Soil
Micro-organisms and Plant Growth. Science Publishers, Inc. Enfield, New Hampshire.
Sylvia D.M. (1994): Vesicular-Arbuscular Mycorrhizal Fungi. Methods of soil Analysis, Part 2: Microbiological and Biochemi-cal properties. SSSA, Book series, 5: 351–378.
Vance E.D., Brookes P.C., Jenkinson D.S. (1987): An extraction method for measuring soil microbial biomass C. Soil Biology and Biochemistry, 19: 703–707.
Walkley A., Black I.A. (1934): An examination of the Degtareff method for determining soil organic matter, and a proposed modification of the chromic acid titration method. Soil Sci-ence, 37: 29–38.
Webster J.J., Hampton G.J., Leach F.R. (1984): ATP in soil: a new extractant and extraction procedure. Soil Biology and Biochemistry, 16: 335–342.
Wu J., Brookes P.C., Jenkinson D.S. (1996): Evidence for the use of a control in the fumigation-incubation method for measuring microbial biomass carbon in soil. Soil Biology and Biochem-istry, 28: 511–518.
Received on April 29, 2009
Corresponding author: