warwick.ac.uk/lib-publications
Original citation:
Konishi, T., Clarke, E., Burrows, C. W., Bomphrey, J. J., Murray, R. and Bell, Gavin R.. (2017)
Spatial regularity of InAs-GaAs quantum dots : quantifying the dependence of lateral
ordering on growth rate. Scientific Reports, 7. 42606.
Permanent WRAP URL:
http://wrap.warwick.ac.uk/84554
Copyright and reuse:
The Warwick Research Archive Portal (WRAP) makes this work of researchers of the
University of Warwick available open access under the following conditions.
This article is made available under the Creative Commons Attribution 4.0 International
license (CC BY 4.0) and may be reused according to the conditions of the license. For more
details see:
http://creativecommons.org/licenses/by/4.0/
A note on versions:
The version presented in WRAP is the published version, or, version of record, and may be
cited as it appears here.
quantum dots: quantifying the
dependence of lateral ordering on
growth rate
T. Konishi
1, E. Clarke
2, C. W. Burrows
3, J. J. Bomphrey
4, R. Murray
5& G. R. Bell
3The lateral ordering of arrays of self-assembled InAs-GaAs quantum dots (QDs) has been quantified as
a function of growth rate, using the Hopkins-Skellam index (HSI). Coherent QD arrays have a spatial distribution which is neither random nor ordered, but intermediate. The lateral ordering improves as the growth rate is increased and can be explained by more spatially regular nucleation as the QD density
increases. By contrast, large and irregular 3D islands are distributed randomly on the surface. This
is consistent with a random selection of the mature QDs relaxing by dislocation nucleation at a later stage in the growth, independently of each QD’s surroundings. In addition we explore the statistical variability of the HSI as a function of the number N of spatial points analysed, and we recommend N > 103 to reliably distinguish random from ordered arrays.
Molecular beam epitaxy (MBE) can be used to grow arrays of In(Ga)As QDs on GaAs(001) with very high crys-talline quality, suitable for application in lasers, optical amplifiers and high-efficiency solar cells. By reducing the growth rate, larger QDs with longer wavelength emission can be grown. The number density of the QDs also decreases at low growth rate. Sparse arrays of QDs are valuable if single QDs are to be optically addressed, for example in quantum information applications. QD densities below 10 μm−2 are desirable in order to resolve
single QD emission within device structures1. Conversely, for use in QD laser structures the number density
should be as high as possible in order to optimise gain. Here the wavelength could unintentionally shift due to accompanying decrease in QD size but is compensated by tuning capping (over-growth) conditions2. However,
the number density of QDs (mean number per unit area) is merely a measure of central tendency and the spa-tial distribution of QDs could vary significantly at a given mean number density. The spatial pattern could be ordered (lattice-like), random, clustered (groups of closely-spaced QDs separated by large distances), or some-thing in between these limits. These spatial patterns can be quantified by the Hopkins-Skellam index (HSI)3–8. It
is known that when multiple layers of QDs are grown with thin spacer layers separating them, the lateral ordering of the QDs increases markedly from the seed layer through subsequent layers9. However, we are not aware of any
detailed quantification of this effect nor of studies of the effects of MBE growth conditions on the spatial regular-ity of single-layer QDs.
Reflection high energy electron diffraction (RHEED) has been used to study MBE growth almost since its inception and gives valuable information about growth mechanisms. However, such information is necessarily spatially averaged. For example monitoring the surface step density, inferred from RHEED intensity changes, allows the transition between step-flow and 2D island growth modes to be studied. But quantitative information about island size distributions (ISDs) and growth morphology demands a real-space method. In this regard, scanning tunnelling microscopy (STM), both in vacuo (via quenching) and truly in situ (during MBE growth) has been predominant in the study of 2D island growth mechanisms where atomic-scale details are important. The study of larger 3D structures is readily achieved using ex situ atomic force microscopy (AFM). Insights into the mechanisms underpinning MBE growth can be gained by studying the morphology and statistics of islands below
1Centre for Collaborative Research, National Institute of Technology, Anan College, Anan, Tokushima, Japan. 2EPSRC National Centre for III-V Technologies, Department of Electronic and Electrical Engineering, University of Sheffield, Mappin Street, Sheffield, S1 3JD, United Kingdom. 3Department of Physics, University of Warwick, Coventry, CV4 7AL, United Kingdom. 4Department of Chemistry, University of Warwick, Coventry, CV4 7AL, United Kingdom. 5Department of Physics, Imperial College London, South Kensington Campus, London, SW7 2AZ, United Kingdom.
Correspondence and requests for materials should be addressed to G.R.B. (email: [email protected]) Received: 04 November 2016
Accepted: 11 January 2017
www.nature.com/scientificreports/
monolayer (ML) coverage10–13. For example, the concept of scaling behaviour of ISDs14 has been applied to both
2D islands12 and QDs15,16 in the InAs-GaAs(001) system.
Assuming that islands grow by absorbing atoms or molecules (“monomers”) migrating on the surface, an island’s size can be related to its local spatial environment on the surface through the idea of a capture zone (CZ)17. This is the region of the surface from which the island obtains new monomers. Defining each CZ as the
region of the surface closer to the island in question than to any other island means that the CZ pattern of an array of small islands is simply the Voronoi tessellation of the points. The growth rate of an island should increase as the size of its CZ increases18. This connection has been studied theoretically10,14,17–19 for many years. The CZ
distribu-tion (CZD) is related to the ISD and may also show scaling behaviour20 but in the case of InAs-GaAs QDs, island
coarsening at high growth temperatures breaks the connection between ISD and CZD16.
Under usual MBE growth conditions, the great majority of QDs are coherently strained, i.e. dislocation-free. However, dislocation nucleation can occur within QDs especially during long InAs growth times. The associated plastic relaxation results in a rapid increase of island size since adding InAs to a more strain-relaxed island costs less strain energy21 and the dislocated islands become more efficient at capturing monomers. In the present work
we term such clusters “large 3D islands” (L3DI)22 and they may also break the ISD-CZD connection.
We recently performed an analysis of the spatial regularity of InAs-GaAs QDs8,23,24 imaged during MBE
growth by fully integrated scanning tunnelling microscopy (STMBE)25. In that study we examined QDs grown
at low temperature (430 °C) and compared their spatial distribution to that of nanometre-scale reconstruction domains in the wetting layer (WL) prior to QD nucleation. Here we examine QDs grown at more conventional temperature (500 °C) by ex situ AFM, and examine their spatial patterns as a function of growth rate, which can provide control over the QD density over 2 orders of magnitude26,27. We separately measure the regularity of QD
and L3DI arrays to test the hypothesis that dislocation nucleation occurs randomly and independently of QD spa-tial environment. In addition, we analyse artificial random arrays of points in order to understand the reliability of the HSI as a function of the number of spatial points available in an array.
Results and Discussion
Growth rate dependence of 3D island arrays.
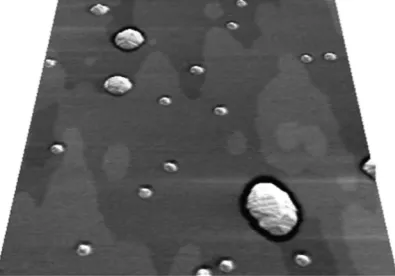
We routinely observed atomically flat terraces separated by monolayer steps in the substrate. A typical 3D rendered image with suitably adjusted height scale is shown in Fig. 1, highlighting these terraces. The QDs and L3DIs appear white, and dark trenches at the base edges of both L3DIs and QDs are often discernible. Such structures have been previously observed in the InAs-GaAs(001) sys-tem28 at a comparable InAs growth rate of 3.58 × 10⁻³ ML s−1. Similar features in the analogous Ge-Si(001) systemwere explained energetically, with the trenches helping to relax strain at 3D island bases29, and they also appear in
generic continuum simulations of strained epitaxy30.
Further example AFM images acquired are shown in the upper panels of Fig. 2 for growth rates 13.9 × 10⁻³ ML s−1
and 1.53 × 10⁻³ ML s−1. The images clearly show the dependence of the dot density on the growth rate, with over
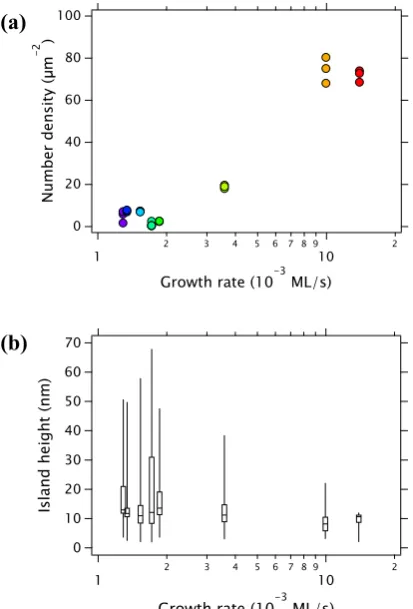
1500 dots present in the 5 μm × 5 μm scan area for the higher growth rate sample. In contrast, the lower growth rate has a density one-tenth this value with large irregularly shaped L3DIs very apparent. Figure 3(a) shows the 3D island number density (QDs + L3DIs) as a function of growth rate. As expected the density increases at higher growth rates31.
In order to automatically distinguish between QDs and L3DIs for thousands of islands, we explored several methods, but a simple height discrimination proved to be reliable for all samples. In the lower panels of Fig. 2 we show number-height distributions obtained from the respective AFM images (upper panels). For the higher growth rate sample, a peaked height distribution is revealed with a clear upper threshold of 15 nm.
[image:3.595.159.357.48.186.2]For the lower growth rate sample, we find that a similar peaked distribution also occurs up to a threshold of 15 nm but islands with heights in excess of 20 nm are also present. The distribution of these larger islands is very broad. Inspection of the images reveals a reasonably clear distinction between islands above and below 15 nm in height, with the former being more irregular and significantly wider. This behaviour was also seen for other growth rates and so we used a simple height threshold to discriminate between L3DIs and QDs. Our HSI results are barely affected by small changes of threshold around the optimum value.
Figure 1. A 1 μm × 1 μm typical AFM image from an intermediate growth rate sample (3.58 × 10⁻³ ML s−1)
Figure 2. AFM images of QD arrays (upper panels) for (a) high growth rate (13.9 × 10⁻³ ML s−1) and (b) lower
growth rate (1.53 × 10⁻³ ML s−1) samples. The images are 5 μm × 5 μm in size and the height scale is the same
between the images to aid comparison. The lower panels show histograms of island centroid heights obtained from the respective AFM images.
[image:4.595.155.362.360.665.2]www.nature.com/scientificreports/
The statistics of height for all islands are presented using the box plot in Fig. 3(b). The upper whiskers extend-ing to the higher side, prominent at lower growth rate, represent flat distribution of L3DIs. The quartile boxes correspond to the distribution peaks of normal QD seen in the histograms of Fig. 2. The median height of normal QDs maintains a value ~10 nm regardless of growth rate. The increase of number density at higher growth rates without a corresponding decrease of height can be explained by the increased incorporation of Ga into the QDs at higher growth rates22, i.e. the total volume in the QD array is larger13. The L3DIs are also larger for ultra-low
growth rates, incorporating more deposited material.
Spatial regularity of QDs and L3DIs.
The lateral ordering of the QDs cannot be easily evaluated “by eye” in AFM images, but can be evaluated by computing the HSI (IHS, see Methods). Analysis was performed by usingFiji32 and MATLAB to segment the flattened AFM images, identify individual QDs and L3DIs and compute I HS
for all islands (QDs and L3DIs) and for L3DIs only. Typically, we could analyse images containing a few thousand QDs to give good statistical fidelity. Some smaller images are included in the analysis containing fewer QDs, even for the higher density arrays.
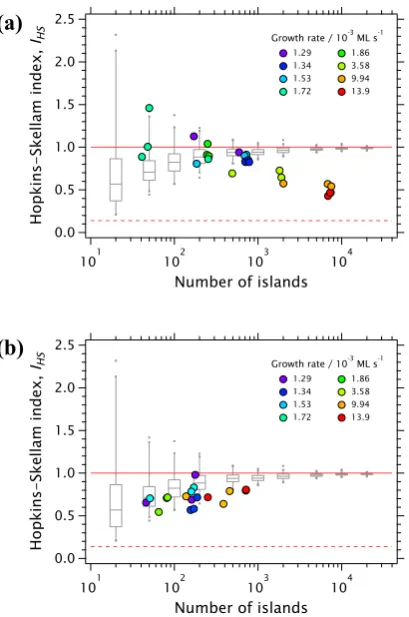
Figure 4(a) shows the HSI computed for all islands (normal QDs and L3DIs) plotted as a function of popula-tion (horizontal axis) and colour-coded by growth rate. Some individual data points represent smaller numbers of islands compared to others from the same sample (same growth rate): this is simply due to differences in AFM image sizes. The grey box plots represent the HSI range calculated for artificial pseudo-random arrays of islands: the boxes show mean and quartiles, the lines show the 2nd and 98th percentiles, and the dots show outliers (see Methods). These box plots allow the experimental data points to be compared to the IHS distribution for arrays of
different sizes with no lateral ordering.
At the higher growth rates, around 7000 islands are typically available in a single AFM image to calculate IHS,
which clusters around 0.5 ± 0.1 (red and yellow points). Artificial random arrays with this number of points have
IHS narrowly distributed very close to unity. Clearly, the QDs with the highest growth rates of 13.9 × 10⁻³ ML s−1
and 9.94 × 10⁻³ ML s−1 are not randomly sited. The HSI values measured here are greater than theoretical
min-imum of 5/36 ≈ 0.14 corresponding to a perfectly ordered hexagonal array8, or 1/6 ≈ 0.17 for a perfect square
array, but well below the range of values allowed for a random array. Hence we can say that the QD arrays at higher growth rates are partially laterally ordered. We surmise that this is due to the smaller spacing between QDs: interaction between QDs via their CZs is able to drive regularity in their spatial distribution even though QD nucleation is known to be a very rapid process locally25. Nucleation of a QD suppresses further nucleation
[image:5.595.157.362.43.352.2]nearby due to the local fall in density of available In adatoms and hence some spatial order arises.
higher number density correspond to greater spatial ordering.
The HSI values counting L3DIs only are shown as a function of island numbers in Fig. 4(b), again colour coding by growth rate. The overall numbers are smaller due to the lower density of L3DI. At the highest growth rates there is a marginal indication that the experimental HSI values drop below the range for random islands. For all other growth rates, the L3DI HSI clearly lies within the spread of random values. Unlike normal QD, there is no trend of improved spatial ordering (reduced HSI) with increasing growth rate. Overall the L3DI appear to be randomly distributed independent of their “parent” QD array. A lack of lateral ordering is consistent with the idea that L3DIs arise by nucleation of a dislocation within a QD, a process which (unlike CZ fragmentation) does not depend on the neighbourhood of the QD. It is likely that strong local strain fields around QDs drive dislocation nucleation stochastically, with the long-ranged strain interaction between QDs being much weaker. Some L3DIs may also arise from the merging of two closely-nucleated QDs but it appears that these close pairs are not them-selves spatially correlated in any way and so the resulting L3DI spatial distribution is random.
Conclusion
Using the HSI we have quantified the lateral ordering of arrays of MBE-grown InAs-GaAs QDs as a function of growth rate at fixed coverage, substrate temperature and arsenic flux. At ultra-low growth rates, where the num-ber density is very low, the QD arrays are spatially random even though the height distribution of QDs remains narrow. As growth rates increase the number density of QDs becomes higher and the QD arrays become signifi-cantly more ordered. This lateral ordering appears naturally as a consequence of QD-QD interaction during the rapid nucleation stage but does not approach HSI values consistent with truly ordered square or triangular arrays. In contrast, L3DIs show no lateral ordering, consistent with their formation via random dislocation nucleation or QD merging processes which occur independently of the L3DI neighbourhood. It would be interesting to meas-ure HSI for QD arrays grown with techniques, such as Sb termination of the WL33, designed to maximise density.
Another natural extension of this work would be to examine QD superlattices9 to quantify the lateral ordering as
a function of layer number and spacing. More generally we have evaluated, using an efficient algorithm8, the HSI
for artificial pseudo-random arrays with different total particle number, as a guide to the statistical robustness of the index for arrays of limited size. When the total number of particles analysed is below 103, it becomes more
difficult to distinguish random from partially ordered arrays.
Methods
Hopkins-Skellam index and artificial random arrays.
The Hopkins-Skellam index (HSI) is a precise measure of spatial regularity which has been used mainly in the life sciences3–7. It allows ordered, random andclustered spatial distributions to be distinguished quantitatively. For example, the spatial distribution of beech tree canopy centroids has been found to be more regular than the corresponding distribution of tree trunks4.
This can be explained by the tree crowns growing to maximise their access to light (phototropism and crown plasticity), efficiently filling the space between trunks and thereby increasing regularity. This is analogous to the CZ ideas outlined in this paper; competitive interaction among entities tends to increase their spatial regularity.
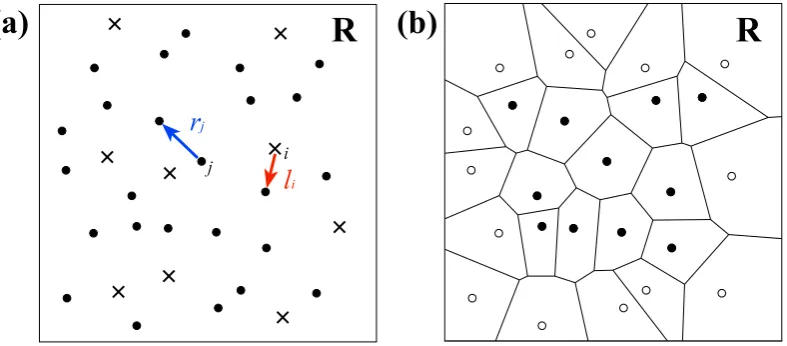
Let us consider the spatial arrangement of N islands in a region R (Fig. 5(a)). We define the distance from the
jth island to its nearest neighbouring island as rj. In order to calculate the HSI, IHS, we plot N random locations in
R and for the ith random location measure the distance li to the nearest island. Then the HSI is defined as
∑ ∑
= .
= =
I l r
(1) i N i j N j HS 1 2 1 2
The HSI can be calculated by selecting exactly N random points in R and computing directly, but many repeated trials are required to ensure adequate randomness for a reliable HSI. However, accurate values can be calculated much more efficiently by using the Voronoi tessellation of the island array (Fig. 5(b)) together with the cumulative probability function for li8. We employ this new method in the present work.
The statistical fidelity of the HSI depends on the number of islands (points) in R and to quantify this point, in Fig. 6, we show the computed HSI for artificial pseudo-random arrays as a function of N. For each N, 100 values of
IHS were calculated to show the distribution about the ideal value of 1. When N≥ 103 the computed values cluster
closely around values slightly smaller than 1. As the number of islands falls, the distribution of IHS values
calcu-lated for a given N becomes broader, as expected. However, the mean IHS also drops well below unity while the
www.nature.com/scientificreports/
spatial ordering when the number of islands analysed is small, N≈ 103 or fewer. In other words, a few hundred
points wit h IHS< 1 can actually be part of a distribution which is genuinely random in a wider field of view.
QD growth and AFM measurements.
For the experiments, arrays of QDs were grown using conventional MBE and were left uncapped. The 2D-3D transition time tcrit was monitored using RHEED and the growth termi-nated after a total growth time ttot= 43tcrit, corresponding to an InAs coverage of approximately 2.25 ML. The substrate temperature (500 °C) and As2 flux were fixed for all samples. The growth rate (growth time) varied from13.9 × 10−3 ML s−1 (160 s) to 1.29 × 10⁻³ ML s−1 (1760 s) and 8 separate samples with different growth rates were
analysed. The native oxide of InAs-GaAs is quite stable and allows high resolution imaging of the surface even after long atmospheric exposure.
AFM measurements were made using two Asylum Research MFP-3D microscopes. Images were obtained in tapping mode using standard silicon probes and cantilevers, with a image size of 5 μm × 5 μm or 10 μm × 10 μm. In all cases the pixel density was kept sufficiently high to unambiguously identify the QDs even when a single image contained more than 103 QDs. Image levelling was done using an iterative line-by-line first-order
subtrac-tion process with masking (the “magic mask” method in the Asylum Research software).
References
1. Zrenner, A. A close look on single quantum dots. The Journal of Chemical Physics112, 7790–7798 (2000).
[image:7.595.160.554.45.218.2]2. Murray, R. et al. 1.3 μm Room Temperature Emission from InAs/GaAs Self-Assembled Quantum Dots. Japanese Journal of Applied Physics38, 528–530 (1999).
Figure 5. (a) Example spatial pattern of 25 islands (•j) illustrating li the distance from the i-th randomly selected location (xi) to the nearest island and rj that from j-th island to the nearest island. (b) Voronoi tessellation of the example spatial pattern. Voronoi cells with open markers are excluded from the study region
[image:7.595.163.449.241.443.2]R because they touch the sides of R.
Figure 6. HSI of artificial random arrays of islands as a function of number of islands (100 arrays for each number). Boxes, whisker ends, dots represent quartiles, 2–98% percentiles, outliers, respectively. The ideal HSI is unity but due to statistical fluctuations the spread of points becomes larger, and biased towards lower HSI values, for smaller island numbers. Solid line (IHS= 1) indicates perfectly random pattern and dashed line
(1999).
12. Bell, G. R., Krzyzewski, T. J., Joyce, P. B. & Jones, T. S. Island size scaling for submonolayer growth of InAs on GaAs(001)- (2 × 4): Strain and surface reconstruction effects. Physical Review B61, R10551–R10554 (2000).
13. Joyce, P. B. et al. Growth rate effects on the size, composition and optical properties of InAs/GaAs quantum dots grown by molecular beam epitaxy. Journal of Crystal Growth227–228, 1000–1004 (2001).
14. Amar, J. & Family, F. Critical Cluster Size: Island Morphology and Size Distribution in Submonolayer Epitaxial Growth. Physical Review Letters74, 2066–2069 (1995).
15. Krzyzewski, T. J., Joyce, P. B., Bell, G. R. & Jones, T. S. Scaling behavior in InAs/GaAs(001) quantum-dot formation. Physical Review B66, 201302 (2002).
16. Fanfoni, M. et al. Coarsening effect on island-size scaling: The model case InAs/GaAs(001). Physical Review E86, 061605 (2012). 17. Mulheran, P. A. & Blackman, J. Capture zones and scaling in homogeneous thin-film growth. Physical Review B53, 10261–10267
(1996).
18. Mulheran, P. A. The dynamics of island nucleation and growth—beyond mean-field theory. Europhysics Letters65, 379–385 (2004). 19. Mulheran, P. A., O’Neill, K. P., Grinfeld, M. & Lamb, W. Distributional fixed-point equations for island nucleation in one dimension:
A retrospective approach for capture-zone scaling. Physical Review E86, 051606 (2012).
20. Einstein, T. L., Pimpinelli, A. & Luis González, D. Analyzing capture zone distributions (CZD) in growth: Theory and applications.
Journal of Crystal Growth401, 67–71 (2014).
21. Pristovsek, M., Kremzow, R. & Kneissl, M. Energetics of Quantum Dot Formation and Relaxation of InGaAs on GaAs(001). Japanese Journal of Applied Physics52, 041201 (2013).
22. Quinn, P. D. et al. Composition profiles of InAs–GaAs quantum dots determined by medium-energy ion scattering. Applied Physics Letters87, 153110 (2005).
23. Konishi, T. & Tsukamoto, S. Statistical Analysis of Surface Reconstruction Domains on InAs Wetting Layer Preceding Quantum Dot Formation. Nanoscale Research Letters5, 1901–1904 (2010).
24. Konishi, T. & Tsukamoto, S. Spatial point analysis of quantum dot nucleation sites on InAs wetting layer. Surface Science605, L1–L5 (2011).
25. Tsukamoto, S., Honma, T., Bell, G. R., Ishii, A. & Arakawa, Y. Atomistic Insights for InAs Quantum Dot Formation on GaAs(001) using STM within a MBE Growth Chamber. Small2, 386–389 (2006).
26. Nakata, Y. et al. Molecular beam epitaxial growth of InAs self-assembled quantum dots with light-emission at 1.3 μm. Journal of Crystal Growth208, 93–99 (2000).
27. Alloing, B., Zinoni, C., Li, L. H., Fiore, A. & Patriarche, G. Structural and optical properties of low-density and In-rich InAsGaAs quantum dots. Journal of Applied Physics101, 024918 (2007).
28. Toujyou, T. et al.In situ STM observations of step structures in a trench around an InAs QD at 300 °C. Journal of Crystal Growth378, 44–46 (2013).
29. Tambe, D. T. & Shenoy, V. B. On the energetic origin of self-limiting trenches formed around GeSi quantum dots. Applied Physics Letters85, 1586–1588 (2004).
30. Tu, Y. & Tersoff, J. Coarsening, Mixing, and Motion: The Complex Evolution of Epitaxial Islands. Physical Review Letters98, 096103 (2007).
31. Joyce, P. B. et al. Effect of growth rate on the size, composition, and optical properties of InAs/GaAs quantum dots grown by molecular-beam epitaxy. Physical Review B62, 10891–10895 (2000).
32. Schindelin, J. et al. Fiji: an open-source platform for biological-image analysis. Nature Methods9, 676–682 (2012).
33. Guimard, D., Nishioka, M., Tsukamoto, S. & Arakawa, Y. High density InAsGaAs quantum dots with enhanced photoluminescence intensity using antimony surfactant-mediated metal organic chemical vapor deposition. Applied Physics Letters89, 183124 (2006).
Acknowledgements
This work was supported by EPSRC, UK, through the National Centre for III-V Technologies and grant GR/ S05762/01. Tomoya Konishi is grateful to the University of Warwick’s Institute for Advanced Studies for provision of a Residential Fellowship.
Author Contributions
E.C. and R.M. prepared samples by MBE, C.W.B. and J.J.B. conducted A.F.M. observation and data processing, and T.K. carried out data analysis. G.R.B. planned the experiment, T.K. and G.R.B. wrote the manuscript, and all authors discussed and reviewed the manuscript.
Additional Information
Competing financial interests: The authors declare no competing financial interests.
How to cite this article: Konishi, T. et al. Spatial regularity of InAs-GaAs quantum dots: quantifying the dependence of lateral ordering on growth rate. Sci. Rep.7, 42606; doi: 10.1038/srep42606 (2017).
www.nature.com/scientificreports/
This work is licensed under a Creative Commons Attribution 4.0 International License. The images or other third party material in this article are included in the article’s Creative Commons license, unless indicated otherwise in the credit line; if the material is not included under the Creative Commons license, users will need to obtain permission from the license holder to reproduce the material. To view a copy of this license, visit http://creativecommons.org/licenses/by/4.0/