FORMULATION, CHARACTERIZATION AND EVALUATION OF CURCUMIN
*
Aloisio Mateus Fiuza Sanha, Satyender Kumar and Pramod Kumar Sharma
Department of Pharmaceutical Sciences, School of Medical
Noida, Uttar Pradesh, 201308, India
ARTICLE INFO ABSTRACT
Turmeric as been long known
it helps in management of various health conditions such as antioxidant, inflammatory, hyperlipidemia, anxiety and metabolic syndrome. Despite these advantages when administered alon curcumin does not attain its full therapeutic effect because of its poor absorption, fast metabolism and rapid elimination. To overcome this barrier for its efficient delivery, curcumin was incorporated into phytosome technology by reacting it with chole
parts, “phyto” means plant while “some” means cell
which the phytochemical agent is bounded with lipid agent. Thus, it results in increased absorption, stabilit
conditions as compared to delivery of the herbal compound alone.
Copyright©2019, Aloisio Mateus Fiuza Sanha et al. This unrestricted use, distribution, and reproduction in any medium,
INTRODUCTION
Herbal medicines and its phytoconstituents have proven their efficiency in the treatment of various health conditions, thus, this reflects the increase in demand of these products. Based on World Health Organization (WHO) statistics, about 75% of the world population relies on herbal compounds for treatment of various diseases (World Health Organization Fifty World Health Assembly, 2003). Despite their advantages, most herbal compounds are vastly water-soluble which affects their absorption due to poor lipid solubility
Curcumin is obtained from dried rhizome of
which is yellowish in color and it has been used as Ayurvedic medicine for treatment of various conditions such as anti inflammatory, wound-healing, antiamoebic, anticance different pathogenic invasions (Grzegorz Grynkiewicz Alok Abhijeet, 2015). Curcumin was discovered in 1815 and up to date many studies have been performed on curcumin for improvement of its various pharmacological activities
1815; Sharma, 1976). The Indian turmeric is regarded as the best in the world due to high presence of curcumin content (Priyanka Dagar, 2014). Curcumin a polyphenolic natural product exhibits therapeutic activity against a number of diseases, attributed mainly to its chemical structure and unique physical, chemical and biological properties (
ISSN: 0975-833X
Article History:
Received 19th January, 2019
Received in revised form 16th February, 2019 Accepted 10th March, 2019
Published online 30th April, 2019
Citation: Aloisio Mateus Fiuza Sanha, Satyender Kumar and Pramod
Cholesterol Phytosomal Complex”, International Journal of Current Research
Key Words:
Phytosome, Bioavailability, Therapeutic Effect, Absorption, Herbal Compound.
*Corresponding author: Aloisio Mateus Fiuza Sanha,
RESEARCH ARTICLE
FORMULATION, CHARACTERIZATION AND EVALUATION OF CURCUMIN
PHYTOSOMAL COMPLEX
Aloisio Mateus Fiuza Sanha, Satyender Kumar and Pramod Kumar Sharma
Department of Pharmaceutical Sciences, School of Medical and Allied Sciences, Galgotias University, Greater
Noida, Uttar Pradesh, 201308, India
ABSTRACT
Turmeric as been long known for its medicines properties and it is the major source for curcumin and it helps in management of various health conditions such as antioxidant, inflammatory, hyperlipidemia, anxiety and metabolic syndrome. Despite these advantages when administered alon curcumin does not attain its full therapeutic effect because of its poor absorption, fast metabolism and rapid elimination. To overcome this barrier for its efficient delivery, curcumin was incorporated into phytosome technology by reacting it with cholesterol. The term phytosome can be divided into two parts, “phyto” means plant while “some” means cell-like. Phytosome is a evolving technology in which the phytochemical agent is bounded with lipid agent. Thus, it results in increased absorption, stability which leads to better bioavailability and therapeutic effect in the treatment of various health conditions as compared to delivery of the herbal compound alone.
This is an open access article distributed under the Creative Commons medium, provided the original work is properly cited.
medicines and its phytoconstituents have proven their efficiency in the treatment of various health conditions, thus, this reflects the increase in demand of these products. Based on World Health Organization (WHO) statistics, about 75% of the tion relies on herbal compounds for treatment of World Health Organization Fifty-Sixth . Despite their advantages, most soluble which affects their (Manach, 2004).
Curcumin is obtained from dried rhizome of curcuma longa
which is yellowish in color and it has been used as Ayurvedic medicine for treatment of various conditions such as
anti-healing, antiamoebic, anticancer and Grzegorz Grynkiewicz, 2012; Curcumin was discovered in 1815 and up to date many studies have been performed on curcumin for improvement of its various pharmacological activities (Vogel, . The Indian turmeric is regarded as the best in the world due to high presence of curcumin content . Curcumin a polyphenolic natural product exhibits therapeutic activity against a number of ts chemical structure and unique (Kavirayani Indira
Priyadarsini, 2014). The IUPAC name of curcumin is (1 1,7-bis(4-hydroxy-3-methoxyphenyl)
dione, with chemical formula C21H20O6, and weight of 368.38 (Priyadarsini, 2013
consist of [1,7-bis (4-hydroxy
heptadiene-3,5-dione)] containing two ferulic acid residues joined by a methylene bridge. It has important functionalities such as aromatic o-methoxy phenolic group, alpha, beta unsaturated beta-diketo moiety and a seven carbon linker. These different functional groups are crucial for its biological activity and the o-methoxypherol group and methylenic hydrogen are responsible for the a
curcumin, and curcumin donates an electron/hydrogen atom to reactivate oxygen species (Lobo
contain glycerol and fatty acid but it has three fatty acid attached to the glycerol. Cholesterol is known as “ste because it is made up of an alcohol and sterol and 100% of it is made up in liver. Cholesterol is very important in the fluidity of the cell, learning capacity and memory
Rabasco Alvarez, 2000). Cholesterol act as source of energy, maintenance of body temperature and cholesterol takes parts in the synthesis of various hormones like steroids. Phytosome or herbosome is an improved technology for delivery of herbal products which are better absorbed and as a result can improve biological activities of the phytoconstituents. This technology was first discovered by Indena S.P.A, Italy
International Journal of Current Research Vol. 11, Issue, 04, pp.3098-3110, April, 2019
DOI: https://doi.org/10.24941/ijcr.35029.04.2019
Aloisio Mateus Fiuza Sanha, Satyender Kumar and Pramod Kumar Sharma, 2019. “Formulation, Characterization and Evaluation of Curcumin International Journal of Current Research, 11, (04), 3098-3110.
Available online at http://www.journalcra.com
z
FORMULATION, CHARACTERIZATION AND EVALUATION OF CURCUMIN-CHOLESTEROL
Aloisio Mateus Fiuza Sanha, Satyender Kumar and Pramod Kumar Sharma
and Allied Sciences, Galgotias University, Greater
for its medicines properties and it is the major source for curcumin and it helps in management of various health conditions such as antioxidant, inflammatory, hyperlipidemia, anxiety and metabolic syndrome. Despite these advantages when administered alone curcumin does not attain its full therapeutic effect because of its poor absorption, fast metabolism and rapid elimination. To overcome this barrier for its efficient delivery, curcumin was incorporated into sterol. The term phytosome can be divided into two like. Phytosome is a evolving technology in which the phytochemical agent is bounded with lipid agent. Thus, it results in increased absorption, y which leads to better bioavailability and therapeutic effect in the treatment of various health
Commons Attribution License, which permits
The IUPAC name of curcumin is (1E,
6E)- methoxyphenyl)-1,6-heptadiene-3,5-dione, with chemical formula C21H20O6, and molecular
Priyadarsini, 2013). Structurally curcumin hydroxy-3-methoxyphenyl)-1,6-dione)] containing two ferulic acid residues joined by a methylene bridge. It has important functionalities methoxy phenolic group, alpha, beta-diketo moiety and a seven carbon linker. These different functional groups are crucial for its biological methoxypherol group and methylenic hydrogen are responsible for the antioxidant activity of curcumin, and curcumin donates an electron/hydrogen atom to Lobo et al., 2010). Cholesterol contain glycerol and fatty acid but it has three fatty acid attached to the glycerol. Cholesterol is known as “sterol” because it is made up of an alcohol and sterol and 100% of it is made up in liver. Cholesterol is very important in the fluidity of the cell, learning capacity and memory (Antonio M.
. Cholesterol act as source of energy, ance of body temperature and cholesterol takes parts in the synthesis of various hormones like steroids. Phytosome or herbosome is an improved technology for delivery of herbal products which are better absorbed and as a result can improve ities of the phytoconstituents. This technology was first discovered by Indena S.P.A, Italy (Goyal, 2011). The
INTERNATIONAL JOURNAL OF CURRENT RESEARCH
Curcumin-term phytosome can be divided into two distinct parts in which “phyto” means plants and “somes” means cell-like, and it is basically a complex of herbal molecules with lipid part (Jain, 2013). The process is to incorporate standardized plant extracts or water soluble phytoconstituent into lipid to produce lipid compatible molecular complexes, called as Phytosome and so vastly improve their absorption and bioavailability. The mechanism through which phytosome reaches the systemic circulation is based on the fact that it can transition from a hydrophilic medium into lipid environment of the enterocyte cell membrane, further into the cell and finally to the blood circulation (Parris Kidd, 2005). In the Phytosome technology process, the lipid and the plant components actually form a 1:1 or a 2:1 molecular complex ratio, involving chemical bonds (Thurapati Pandu Raju, 2011). A Phytosome is an amphiphilic substance with a definite melting point, generally soluble in non-polar solvents, and moderately soluble in fats (Ajay Semalty, 2010). The main difference between phytosome and liposome is that in the late one there are hundreds or thousands of lipid molecules surrounding the plant components, while in contrast, in the phytosome technology the lipid and plant material form molecular complex of 1:1, 1:2 in which chemical bond was involved which provides better bioavailability of phytosome and provide better effect on topical and skin products as compared to liposome (Nilesh Jain, 2010).
MATERIALS AND METHODS
Materials: Curcumin was obtained from (Sigma Aldrich-
Merk), Cholesterol, Dichloromethane (DCM) and n-hexane was obtained from Central Drug House (CDH) (P) Ltd. 7/28 Vardaan House, Daryaganj, New Delhi110002 (INDIA). All other chemicals were of analytical grade.
Methods: The preparation of curcumin-lipid phytosome was
done as per Maiti et al., 2006 in which curcumin and
cholesterol was taken at 1:1molar ratio after the optimization as shown in Table . Curcumin and cholesterol was accurately weighed and taken in a 250 ml flat bottom flask with 22.07 ml of DCM (dichloromethane). The mixture was stirred and refluxed until the total volume was reduced up to 3-5 ml at a
temperature not more than 600C. At this point, n-hexane is
added at a volume of 10 ml drop wise. The complex of curcumin and cholesterol was precipitated which was then filtered (using Whatman filter paper) and dried under vacuum to remove traces of solvent. The formulated curcumin-lipid complex was stored in an air tight container and kept in freezer
[image:2.595.58.270.632.766.2](2-8 0C) until used (Kuntal Maiti, 2007).
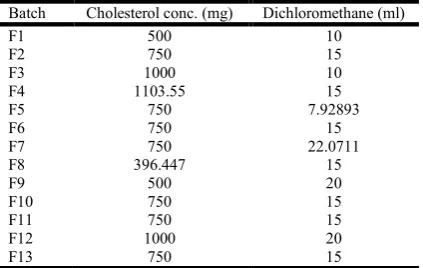
Table 1. Different batches of Phytosome formulation.
Batch Cholesterol conc. (mg) Dichloromethane (ml)
F1 500 10
F2 750 15
F3 1000 10
F4 1103.55 15
F5 750 7.92893
F6 750 15
F7 750 22.0711
F8 396.447 15
F9 500 20
F10 750 15
F11 750 15
F12 1000 20
F13 750 15
Formulation optimization: For the development of
pharmaceutical formulations, traditionally each variable is
change at the time until the optimum formulation is obtained. This approach is by its nature time consuming and the effects that independent variables can have in the formulation are not taken into consideration. Therefore, it is necessary to use statistical tools such as factorial designs in order to solve the formulation complexity of pharmaceutical products. Full-factorial experimental design was implemented to study the effects of independent variables on the dependent variables.
For the optimization, cholesterol concentration (X1) and
dichloromethane (X2) were selected as independent variables.
Each independent variable was set at a high, medium and low
level as shown in Figure 3 and Figure 4. The % Drug content
was taken as the response parameter. Design Expert 11.1.2.0 (Trial Version Stat-Ease, Inc, USA) was implemented for the study of the effect of each variable on the designed response. ANOVA test was used to study the statistical significance of the difference in % Drug content using following equation: Y=
Y1 + 1.52 X1 + 0.9166 X2 – 0.1350 X1X2 – 3.03 X12 – 0.3157
X22
Evaluation of curcumin-cholesterol phytosome complex:
Organoleptic properties and wavelength maxima (λmax)
Curcumin-cholesterol complex was observed for its
organoleptic properties like color, solubility. A concentration of about 1 mg of the complex was dissolved in methanol and scanned over a wavelength range between 200-800 nm respectively in UV-Visible spectrophotometer (Shimadzu
1800) to get the λmax of the formulated complex20.
Drug content: The amount of curcumin in the complex was
determined by the method described by Sauvik Bhattacharyya
et al., 2013 with some modification. 5 mg of the complex was
dissolved in 10 ml of methanol. The mixture was sonicated for 5-10 minutes then filtered. The volume (1 ml) was taken from the stock solution in a 10 ml volumetric flask and made up with methanol. The solution was analyzed by UV spectrophotometer (Shimadzu UV, 1800) at 422 nm wavelength (Mistuni Ghosh, 2011).
Drug entrapment efficiency: It was determined after drug
content analysis and the total amount of the complex yielded. Some amount of drug in complex was taken and divided into
amount of initial drug that was used (Mistuni Ghosh et al.,
2011; Sauvik Bhattacharyya, 2013).
Percentage yield: The percentage yield was calculated to find
out the total percentage of the formulated phytosomal complex. The following formula was used to calculate % yield: % yield = practical yield/ theoretical yield x 100.
Characterization of curcumin-cholesterol phytosomal complex
Scanning electron microscopy (SEM): About 5 μL of the
curcumin-cholesterol phytosome suspension was transformed to a cover slip, which in turn was mounted on a specimen tab and the samples were allowed to dry at room temperature. The particle size of the formulation was analyzed and photographed using Scanning Electron Microscope (Sigma, Carl Zeiss). The particles were coated with platinum by using vacuum evaporator and thus, the coated samples were viewed and photographed in JEOL JSM-6701F Field Emission SEM.
TLC study: The TLC studies were performed as per S.
Revathy et al., 2011 with modifications. The sample of
curcumin, cholesterol, curcumin + cholesterol (physical
mixture) and phytosome were collected in four different eppendorf containers and acetone was added to the samples. The mobile phase (dichloromethane and methanol) at a ratio of 99:1 was used for TLC. The precoated TLC plate was cut at a specific size and the samples were placed on it with the help of fine capillary tubes. Now, the TLC plate was placed in the mobile phase chamber and the solvent front was allowed to run up to 80% of the TLC plate. The TLC plate was analyzed
under UV chamber and the Rf value was calculated (Amudha,
2018).
UV analysis
The UV of the formulated curcumin-cholesterol complex was
analyzed by (Shimadzu, 1800)at the wavelength of 422nm.
Partition coefficient: In the first study (n-octanol + water), 2 ml of each n-octanol and distilled water were taken in an air tight container and excess of the curcumin-cholesterol phytosomal complex were added with continuous shaking for 24 hours until sample is no longer dissolving (saturation point). The sample was centrifuged at 5000 rpm for 10 minutes. The organic layer was separated with the help of separating funnel. Collected 1 ml from the organic sample and added 9 ml of methanol. The concentration was calculated with help of UV spectrometer at wavelength of 422 nm. For the aqueous phase study, Collected 1 ml from the aqueous phase sample and added 9 ml of methanol. The concentration was calculated with help of UV spectrometer at wavelength of 422 nm. In the second study (n-octanol + PBS), n-octanol and PBS 7.4 (phosphate buffer saline) were taken in an air tight container and excess of the curcumin-cholesterol phytosomal complex was also added with continuous shaking for 24 hours until sample reaches saturation point. The sample was centrifuged at 5000 rpm for 10 minutes. The two layers were separated with the help of separating funnel. Collected 1 ml from the organic sample and added 9 ml of methanol. The concentration was calculated with help of UV spectrometer at wavelength of 422 nm. For the PBS layer, 1 ml was collected and 9 ml of methanol was added. The concentration was also calculated with help of UV spectrometer at wavelength of 422nm (Kuntal Maiti, 2007).
In-vitro drug release: The determination of in-vitro release of
curcumin from phytosomal suspension was performed through cellophane membrane (previously soaked overnight in diffusion medium) using Franz diffusion cell by taking phosphate buffer solution pH 7.4 as diffusion medium. The cellophane membrane was mounted on the Franz diffusion cell and the upper side was used as donor compartment and lower side as receptor compartment. The suspension (10 ml) of curcumin-phytosome complex containing 10 mg of complex was placed on the donor compartment (upper side) then closed firmly closed to avoid leakage. About 20 ml of PBS pH 7.4 was kept in the receptor compartment so that it can slightly touch the receptor membrane surface and the temperature was kept at 37±0.5 ºC. The magnetic bead was kept at the bottom of the diffusion medium at 100 rpm. The samples of 3 ml were withdrawn between 1 hour intervals for 24 hours consecutive and fresh amount of sample (3 ml) of PBS pH 7.4 was replaced to maintain the sink condition. UV spectrophotometer analysis of the samples was recorded at λmax 422 nm (Revathy, 2011).
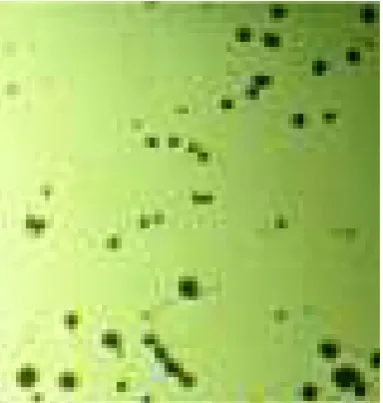
Microscopic evaluation: Projection microscope (Impact Icon
Instruments Company, IIC-604) was used for microscopic characterization of the complex. A quantity of 1 mg each of the
curcumin-lipid complex, cholesterol, and curcumin was taken in three different 5 ml eppendorf tube and distilled water was added and the samples were shaken with Vortex shaker to make a uniform suspension of the curcumin-lipid complex, curcumin and cholesterol. Drop was collected from each suspended solution with the help of micropipette (10 micro-liters) and placed on three different slides (make a smear on the glass slide) and the microscopic observation was performed at a magnification of 400x.
Fourier Transformed-Infrared Spectroscopy (FT-IR): FTIR
spectra of the formulated curcumin-cholesterol complex were done by SAIF PU, Chandigarh.
Nuclear magnetic resonance (NMR): Proton NMR (1H and
13
C NMR) of curcumin-cholesterol complex was performed by Bruker Avance II 400 NMR spectrometer SAIF Panjab University, Chandigarh.
RESULTS AND DISCUSSION
Optimization study: The curcumin-cholesterol phytosomal
complex was formulated after optimization by Expert Design Software to study the effect of independent variables on % drug content in phytosome. In the current study, the factors
selected were X1= concentration of cholesterol (% w/v); X2=
volume of dichloromethane (ml). The thirteen batches (F1-F13) of curcumin-cholesterol phytosome were prepared as per Design Expert Software (Table 1). With the drop wise addition of n-hexane to DCM, curcumin and cholesterol solution, the precipitates were formed which indicated the formation of phytosomal complex. A total of thirteen formulations of curcumin-cholesterol phytosome were formulated taking
concentration of cholesterol (X1) and dichloromethane (X2) as
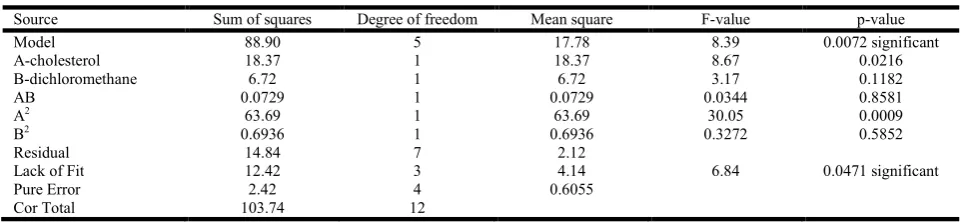
independent variables to study their effect on drug content it has been observed that the % drug content of batch 7 (90.94%) was highest, particle size was between 8-10 µm, % yield was 80.1 % w/w. The drug content value was higher when the concentration of cholesterol and dichloromethane are high. Thus, the data revealed that concentration of cholesterol and volume of n-hexane at higher values increases the drug content. ANOVA was applied on the study of the drug content response (Table 3). F-test was carried out to compare the regression mean square the ratio F= 6.84 shows regression to be significant. The 3-dimensional response surface plots and the corresponding contour plots for drug content efficiency are shown in Figure and Figure and its constraint (Table 2).
The Model F-value of 8.39 implies the model is significant. There is only a 0.72% chance that an F-value this large could occur due to noise. P-values less than 0.0500 indicate model terms are significant. In this case A, A² are significant model terms. Values greater than 0.1000 indicate the model terms are not significant. If there are many insignificant model terms (not counting those required to support hierarchy), model reduction may improve your model. The Lack of Fit F-value of 6.84 implies the Lack of Fit is significant. There is only a 4.71% chance that a Lack of Fit F-value this large could occur due to noise.
Curcumin-cholesterol organoleptic properties:
Curcumin-cholesterol phytosomal complex was analyzed for the organoleptic property; the complex was found to be orange-yellowish in nature, completely soluble in ethanol, methanol, and acetone and insoluble in water.
Figure 1. Three D surface of drug content as a fu formulation variables
Figure 2. Contour plot of drug content as a fu formulation variables
Figure 3. Independent variables set at high, medium and low levels
Figure 4. Result from independent variables set and low levels
Determination of wavelength maxima: The wavelength of
curcumin-cholesterol complex (1 mg concentration) in methanol was found to be 415 nm in UV
spectrophotometer (Fig. 16) and is the typical spectral peak of curcumin which is present abundantly in
(Kavirayani Indira Priyadarsini, 2014).
3101 Aloisio Mateus Fiuza Sanha et al. Formulation, Characterization and Evaluation of Curcumin
Figure 1. Three D surface of drug content as a function of
Figure 2. Contour plot of drug content as a function of
at high, medium and
Result from independent variables set at high, medium
The wavelength of cholesterol complex (1 mg concentration) in methanol was found to be 415 nm in UV-Visible and is the typical spectral peak of
curcumin which is present abundantly in turmeric rhizome
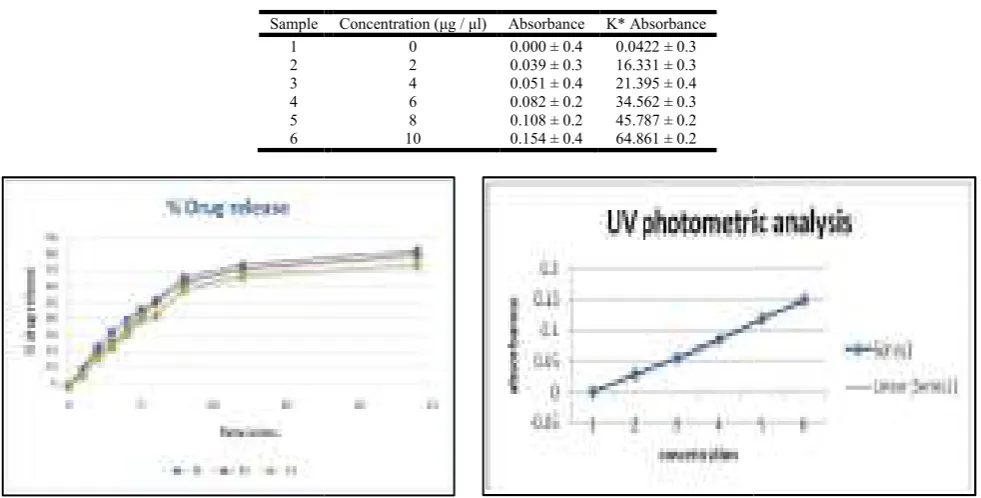
Standard calibration curve of curcumin
in UV spectrophotometer: The UV absorbance of curcumin
cholesterol complex solution in methanol showed linearity at
λmax 422nm and the linearity were plotted for absorbance
versus concentration and Fig 17.
Percentage yield: The total %age yield of the formulated
curcumin-cholesterol complex was found to be 80.1%.
% yield = practical yield/ theoretical yield x 100 =605 mg/ 755 mg
= 80.1 % w/w
Drug content and entrapment efficiency
cholesterol complex was prepared by solvent displacement method and the drug content (percent loading) of the optimized batch (F7) was estimated by UV spectrophotometer at 422 nm in methanol and it was found to be 90.7506% (w/w) as shown in the table below (Table 4). The entrapme
found to be 34.903% as shown bellow. The good drug loading and entrapment of curcumin makes the delivery of the drug clinically feasible.
Drug content (%) = (Amount of drug in complex/Amount of complex) x 100
Drug content (%) = 4.545/5 x 100 = 90.94%
Entrapment efficiency (%)
complex/Amount of initial drug used) x 100 Entrapment efficiency (%) = 4.5375/13 = 34.903 %
TLC of curcumin-cholesterol complex
curcumin-cholesterol complex, curcumin, cholesterol and physical mixture were calculated individually and the results obtained were compared. The R
complex was 0.55 which is highe
cholesterol and physical mixture. These results have been represented in the and
Figure and Table .
Microscopic evaluation: The optimized and prepared
curcumin-cholesterol phytosomal complex under projection microscopy has shown characteristic features of presence of round/spherical shape vesicles
Figure 11 and Figure 12 at the magnification of 400X which is significantly different from the structure of curcumin Figure 9 and Figure 10, and cholesterol alone Figure 7 and Figure 8.
UV: The UV spectrum analysis (qualitative study, was
performed and methanol was used as blank. (THE UV RESULT SHOULD CONTAIN THE FOLLOWING LINES: The UV spectrum analysis (qualitative study,
performed and methanol was used as blank. The samples of phytosome complex, curcumin, cholesterol, physical mixture (curcumin + cholesterol) were analyzed and the data obtained was recorded has shown in the
Figure. For UV photometric analysis (quantitative study) the quantity of 1 mg of curcumin was dissolved in 1 ml methanol (1000 μg / μl) further dilution of 2, 4, 6, 8, 10 μg/ml were prepared and absorbance were determined. The calibration graph is given in Figure. The samples of
curcumin, cholesterol, physical mixture (curcumin + cholesterol) were analyzed and the data obtained was recorded has shown in the Figure, Figure 1, Figure 15, Figure.
Formulation, Characterization and Evaluation of Curcumin-Cholesterol Phytosomal Complex
Standard calibration curve of curcumin-cholesterol complex
The UV absorbance of curcumin-cholesterol complex solution in methanol showed linearity at
422nm and the linearity were plotted for absorbance versus concentration and Fig 17.
The total %age yield of the formulated cholesterol complex was found to be 80.1%.
% yield = practical yield/ theoretical yield x 100
=605 mg/ 755 mg x 100
entrapment efficiency:
Curcumin-cholesterol complex was prepared by solvent displacement method and the drug content (percent loading) of the optimized (F7) was estimated by UV spectrophotometer at 422 nm in methanol and it was found to be 90.7506% (w/w) as shown ). The entrapment efficiency was found to be 34.903% as shown bellow. The good drug loading and entrapment of curcumin makes the delivery of the drug
Drug content (%) = (Amount of drug in complex/Amount of
= (Amount of drug in complex/Amount of initial drug used) x 100
Entrapment efficiency (%) = 4.5375/13 x 100
= 34.903 %
cholesterol complex: The RF value of
cholesterol complex, curcumin, cholesterol and physical mixture were calculated individually and the results
obtained were compared. The RF value of curcumin-cholesterol
complex was 0.55 which is higher than RF values of curcumin,
cholesterol and physical mixture. These results have been
The optimized and prepared cholesterol phytosomal complex under projection microscopy has shown characteristic features of presence of
Figure 11 and Figure 12 at the magnification of 400X which is significantly different from the structure of curcumin Figure 9 and Figure 10, and cholesterol alone Figure 7 and Figure 8.
The UV spectrum analysis (qualitative study, was performed and methanol was used as blank. (THE UV RESULT SHOULD CONTAIN THE FOLLOWING LINES: The UV spectrum analysis (qualitative study, Table 1) was and methanol was used as blank. The samples of phytosome complex, curcumin, cholesterol, physical mixture (curcumin + cholesterol) were analyzed and the data obtained was recorded has shown in the Figure, Figure 1, Figure 15, c analysis (quantitative study) the quantity of 1 mg of curcumin was dissolved in 1 ml methanol (1000 μg / μl) further dilution of 2, 4, 6, 8, 10 μg/ml were prepared and absorbance were determined. The calibration The samples of phytosome complex, curcumin, cholesterol, physical mixture (curcumin + cholesterol) were analyzed and the data obtained was recorded
Figure 1, Figure 15, Figure.
Table 2. Constraints
Name Goal Lower Limit Upper Limit Lower Weight Upper Weight Importance
A:Cholesterol Conc. is in range 500 1000 1 1 3
B:Dichloromethane is in range 10 20 1 1 3
[image:5.595.51.533.144.255.2]Drug content maximize 81.01 90.94 1 1 3
Table 3. ANOVA of regression (% drug content response)
Source Sum of squares Degree of freedom Mean square F-value p-value
Model 88.90 5 17.78 8.39 0.0072 significant
A-cholesterol 18.37 1 18.37 8.67 0.0216
B-dichloromethane 6.72 1 6.72 3.17 0.1182
AB 0.0729 1 0.0729 0.0344 0.8581
A2 63.69 1 63.69 30.05 0.0009
B2 0.6936 1 0.6936 0.3272 0.5852
Residual 14.84 7 2.12
Lack of Fit 12.42 3 4.14 6.84 0.0471 significant
Pure Error 2.42 4 0.6055
[image:5.595.159.426.283.419.2]Cor Total 103.74 12
Table 4. Drug content study (%)
Batch No Drug Content (%)
F1 82.16
F2 88.32
F3 85.02
F4 85.92
F5 86.83
F6 88.92
F7 90.94
F8 81.01
F9 83.19
F10 89.13
F11 87.14
F12 85.51
[image:5.595.59.529.453.505.2]F13 88.56
Table 5. Rf value calculation of curcumin-phytosome complex 1:1 ratio
Samples Distance travelled by solute Distance travelled by solvent Rf value
Curcumin 2.80 5.4 0.51
Cholesterol 2.5 5.4 0.40
Physical mixture 2.6 5.4 0.48
Phytosome 2.97 5.4 0.55
[image:5.595.64.266.539.713.2]Rf value = Distance travelled by solute/Distance travelled by solvent
Figure 5. TLC of curcumin (lane 1), cholesterol (lane 2), physical mixture (lane 3), phytosome 1:1 ratio (lane 4). Solvent system
consists of 9.9:0.1 ratio DCM and methanol respectively
Figure 6. TLC of curcumin (lane 1), cholesterol (lane 2), physical mixture (lane 3), and phytosome 1:1 ratio (lane 4). Solvent system consists of 9.9:0.1 ratio DCM and methanol respectively under UV
visible light at 366 nm wavelength.
[image:5.595.310.518.541.720.2]3103 Aloisio Mateus Fiuza Sanha et al. Formulation, Characterization and Evaluation of Curcumin-Cholesterol Phytosomal Complex
Figure 7. Microscopic of cholesterol (in normal mode), 400x
[image:6.595.314.516.63.250.2]Figure 8. Microscopic of cholesterol (in negative mode) 400x
[image:6.595.316.518.291.508.2]Figure 9. Microscopic of curcumin (normal mode), 400x
Figure 10. Microscopic of curcumin (in negative mode) 400x
Figure 11. Microscopic view of curcumin-cholesterol complex (phytosome) 400x
[image:6.595.82.274.540.742.2]3104 International Journal of
[image:7.595.307.543.58.216.2]Figure 13. UV chromatogram of blank methanol (blank spectrum analysis (qualitative study)
Figure 15. chromatogram of curcumin (λmax 422nm) UV spectrum analysis (qualitative study).
Sample 1 2 3 4 5 6
Figure 17. Calibration curve
of Current Research, Vol. 11, Issue, 04, pp.3098-3110, April, 2019
. UV chromatogram of blank methanol (blank MeOH) UV um analysis (qualitative study)
Figure 14. UV chromatogram of cholesterol (λmax 201 nm) UV spectrum analysis (qualitative study)
[image:7.595.308.547.263.434.2]. chromatogram of curcumin (λmax 422nm) UV spectrum (qualitative study).
Figure 16. UV chromatogram of curcumin (phytosome formulation) λmax 415 nm UV spectr
[image:7.595.53.290.264.436.2](qualitative study)
Table 1. UV photometric analysis
Concentration (μg / μl) Absorbance K* Absorbance 0 0.000 ± 0.4 0.0422 ± 0.3 2 0.039 ± 0.3 16.331 ± 0.3 4 0.051 ± 0.4 21.395 ± 0.4 6 0.082 ± 0.2 34.562 ± 0.3 8 0.108 ± 0.2 45.787 ± 0.2 10 0.154 ± 0.4 64.861 ± 0.2
Figure 17. Calibration curve Figure 18. In-vitro drug release (%)
9
. UV chromatogram of cholesterol (λmax 201 nm) UV spectrum analysis (qualitative study)
UV chromatogram of curcumin-cholesterol complex (phytosome formulation) λmax 415 nm UV spectrum analysis
(qualitative study)
[image:7.595.53.544.506.755.2]Figure 2. SEM image of Cholesterol Figure 3. SEM image of Curcumin
[image:8.595.170.440.83.500.2]Figure 21. SEM image of Curcumin-cholesterol complex
Figure 22. FTIR of curcumin-cholesterol complex
[image:8.595.86.507.563.779.2]For UV photometric analysis (quantitative study) the quantity of 1 mg of curcumin was dissolved in 1 ml methanol (1000 μg / μl) further dilution of 2, 4, 6, 8, 10 μg/ml were prepared and absorbance were determined. The calibration graph is given in Figure 17.
Partition coefficient: The Log P value of curcumin-cholesterol
complex was found to be 3.932 in n-octanol + water and 3.812 in n-octanol + PBS 7.4 which is higher than the Log P value of curcumin alone (3.2).
As per the equation C=A/ab, where C is concentration, A is absorbance, a is specific absorbance, and b is path length (1 cm). The results are given bellow (Table 2).
Table 2 n-octanol + PBS (7.4), n-octanol + PBS (7.4), and curcumin Log P
S. No. Log P
n-octanol + Distilled water 3.932 n-octanol + PBS (7.4) 3.8122
[image:9.595.93.520.73.392.2]Curcumin 3.2
Figure 23. FTIR of pure cholesterol
[image:9.595.68.549.415.649.2]Figure 24. FTIR of curcumin
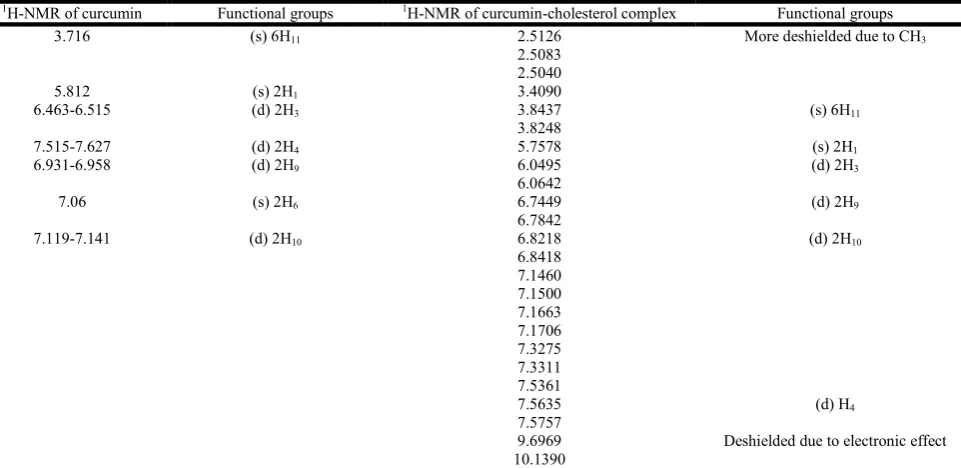
Table 8. 1H-NMR of pure curcumin and curcumin-cholesterol complex
1H-NMR of curcumin Functional groups 1H-NMR of curcumin-cholesterol complex Functional groups
3.716 (s) 6H11 2.5126
2.5083 2.5040
More deshielded due to CH3
5.812 (s) 2H1 3.4090
6.463-6.515 (d) 2H3 3.8437
3.8248
(s) 6H11
7.515-7.627 (d) 2H4 5.7578 (s) 2H1
6.931-6.958 (d) 2H9 6.0495
6.0642
(d) 2H3
7.06 (s) 2H6 6.7449
6.7842
(d) 2H9
7.119-7.141 (d) 2H10 6.8218
6.8418
(d) 2H10
7.1460 7.1500 7.1663 7.1706 7.3275 7.3311 7.5361 7.5635 7.5757
(d) H4
9.6969 Deshielded due to electronic effect 10.1390
Figure 25.
3107 Aloisio Mateus Fiuza Sanha et al. Formulation, Characterization and Evaluation of Curcumin
25. 1H-NMR of curcumin-cholesterol complex
3108 International JournalJournal of Current Research, Vol. 11, Issue, 04, pp.3098-3110, April, 201
In-vitro drug release (%): The in-vitro drug release profile of optimized curcumin-cholesterol phytosome suspension is given in Figure 18. Among the three formulations, the F1 have shown better drug release which is about 80%.
SEM: The visualization of curcumin-cholesterol complex by
Scanning Electron Microscope (SEM) have shown a spherical shaped particle with a diameter ranging between 8
shown in the Figure 19, Figure 20, Figure
changes of both curcumin and cholesterol which was previously long fibrous shape) confirms the complex formation between curcumin and cholesterol.
Figure
Table 3. 13C-NMR of pure curcumin and curcumin
13C-NMR of curcumin Functional groups
56 101 111 115 121 123 126 141 148 149 183
3109 Aloisio Mateus Fiuza Sanha et al. Formulation, Characterization and Evaluation of Curcumin
vitro drug release profile of cholesterol phytosome suspension is . Among the three formulations, the F1 have shown better drug release which is about 80%.
cholesterol complex by Scanning Electron Microscope (SEM) have shown a spherical
shaped particle with a diameter ranging between 8-10 μm has
Figure 21. The shape changes of both curcumin and cholesterol which was previously long fibrous shape) confirms the complex formation
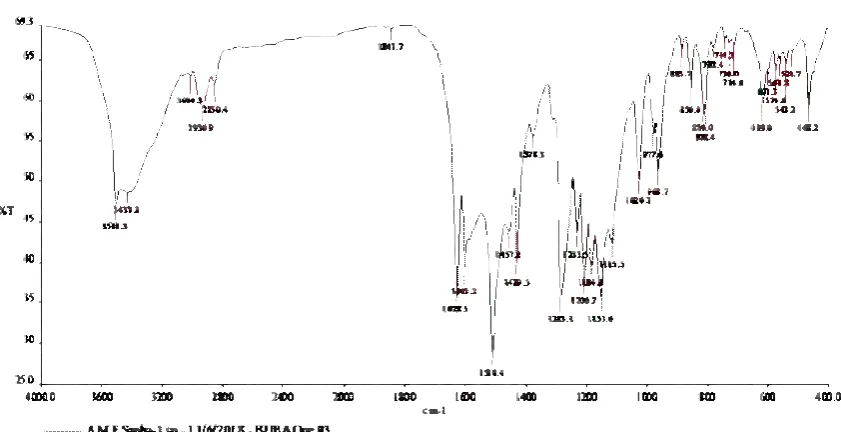
FTIR: FT-IR spectroscopy helps in confirming the formation
of the complex between curcumin and cholesterol by comparing the individual spectrum of curcumin, cholesterol with the spectrum of curcumin
of phytosome (Figure 23) have shown that the OH is in bounded form and no sharp peak was observed for ketone group which suggested that the ketone group is in bounded
form. The CH2 groups and 6H in cholesterol cause
stretching to be more in curcumin compared to curcumin alone ( peaks and positions in curcumin complex differ from that of cholesterol
Figure 4. 13C-NMR of curcumin-cholesterol complex
NMR of pure curcumin and curcumin-cholesterol complex (CAPTION TO BE MENTIONED)
Functional groups 13C-NMR of curcumin-cholesterol complex
C11 38.79
C1 38.99
C6 39.20
39.41 39.62
C9 39.83
C3 40.04
C10 55.62
C5 100.86
C4 100.94
C1 111.25
C8 115.66
C2 115.88
120.75 121.03 123.08 125.78 126.29 130.31 140.34 140.68 147.94 149.30 159.77 183.10 183.17
Formulation, Characterization and Evaluation of Curcumin-Cholesterol Phytosomal Complex
IR spectroscopy helps in confirming the formation of the complex between curcumin and cholesterol by comparing the individual spectrum of curcumin, cholesterol m of curcumin-cholesterol complex. The FTIR ) have shown that the OH is in bounded form and no sharp peak was observed for ketone group which suggested that the ketone group is in bounded groups and 6H in cholesterol cause the stretching to be more in curcumin-cholesterol phytosome as compared to curcumin alone (Figure 24). The changes in the peaks and positions in curcumin-cholesterol phytosomal complex differ from that of cholesterol Figure 25.
cholesterol complex (CAPTION TO BE MENTIONED)
Functional groups CH3 CH3 CH3 C11 C1 C5 C6 C9 C6 C3 C10 C5 C4 C5 C7 C8 C2
NMR study
1
H-NMR: Under the 1H-NMR curcumin-cholesterol
phytosomal complex and pure curcumin have shown various functional groups as described in the table below (Table and Figure 26). At 9.6969 no peak was observed in curcumin and cholesterol which is due to deshielded proton.
13C-NMR:
Under the 13C-NMR curcumin-cholesterol
phytosomal complex and pure curcumin have shown various functional groups as described in the Table 9.
Conclusion
In the current study curcumin-cholesterol complex was prepared by solvent displacement method and evaluated for different parameters. All the physicochemical properties evaluated have shown that curcumin and cholesterol had formed a stoichiometric complex having a increased solubility.
The 1H-NMR, 13C-NMR, FTIR, UV, SEM studies confirmed
the formation of the curcumin-cholesterol complex. The
particle size of the complex was found to be 8-10 μm.
Entrapment efficiency was found to be about 34.903 %. Thus,
with these findings we concluded that curcumin and cholesterol complex may be of potential use for improving the bioavailability of curcumin.
Conflict of interest statement: The authors report no conflicts of interest. The authors alone are responsible for the content and writing of the paper.
Acknowledgment
Authors acknowledge the grant provided by the Department of Pharmacy School of Medical and Allied Science, Galgotias University, Greater Noida, India.
REFERENCES
Ajay Semalty, Mona Semalty, Devendra Singh M. S. M. Rawat. 2010. Preparation and characterization of phospholipid complexes of naringenin for effective drug
delivery. J Incl Phenom Macrocycl Chem., 67:253-260.
Akiladevi D, Basak S. Ethosomes – A noninvasive approach
for transdermal drug delivery‖. Int J Curr Pharm Res.,
2010, 2(4), 1-4.
Alok Abhijeet, Singh Indra Deo, Singh Shivani, Kishore
Mallika, Jha Prakash Chandra. Curcumin –
Pharmacological actions and its role in oral submucous fibrosis: A Review. Journal of Clinical and Diagnostic Research. 2015 O, Vol-9(10).
Amudha S., Prabal Kumar Manna, Jeganathan N.S. Formulation and Evaluation of Capsules of Syzygium cumini Phytosomes. J. Pharm. Sci. Innov. 2018; 7(3). Antonio M. Rabasco Alvarez, María Luisa GonzÆlez
Rodríguez. Lipids in pharmaceutical and cosmetic preparations. Grasas y Aceites, 2000, vol. 51, 74-96. Goyal A, Kumar S, Nagpal M. 2011. Potential of Novel Drug
Delivery Systems for Herbal Drugs. Indian Journal of
Pharmaceutical Education and Research. 45(3): 225- 235.
Grzegorz Grynkiewicz, Piotr Ślifirsk. Curcumin and curcuminoids in quest for medicinal status. Biochimica Polonica Acta, 2012, Vol 59, 201-212.
Jain PK, Khurana N, Pounikar Y. Enhancement of absorption
and hepatoprotective potential through
soyaphosphatidylcholine-andrographolide vesicular
system. Journal of Liposome Research. 2013;23(2):110-8.
Kavirayani Indira Priyadarsini. 2014. The Chemistry of curcumin: From Extraction to Therapeutic Agent. Molecules, vol 19, -20112.
Kuntal Maiti, Kakali Mukherjee, Arunava Gantait, Bishnu Pada Saha, Pulok K. Mukherjee, 2007. Curcumin– phospholipid complex: Preparation therapeutic evaluation
and pharmacokinetic study in rats. Int J Pharm.,
330(1-2):155-63.
Lobo V, Patil A, A. Phatak, N. Chandra. 2010. Free radicals, antioxidants and functional foods: Impact on human health.
Pharmacognosy Reviews, Vol 4, Issue 8.
Manach C, Scalbert A, Morand C. Polyphenols, Food sources and bioavailability. American journal of clinical nutrition. 2004; 9: 727-747.
Mistuni Ghosh, Amareshwar T. K. Singh, Wenwei Xu, Todd Sulchek, Leo I. Gordon, Robert O. Ryan.2011. Curcumin
nanodisks: formulation and characterization.
Nanomedicine. 7(2): 162–167.
Nilesh Jain, Brahma P Gupta, Navneet Thakur, Ruchi Jain, Jitendra Banweer, Deepak Kumar Jain, Surendra Jain. Phytosome, 2010. A Novel Drug Delivery System for
Herbal Medicine. International Journal of Pharmaceutical
Sciences and Drug Research, 2(4): 224-228.
Parris Kidd, Kathleen Head, 2005. A Review of the Bioavailalbility and Clinical Efficacy of Milk Thistle Ahytosome: A Silybin-phosphatidylcholine: Complex
(Siliphos). Alternative Medicine Review, vol 10.
Priyadarsini, K.I. 2013. Chemical and structural features
influencing the biological activity of curcumin.Curr.
Pharm. Des., 19, 2093–2100
Priyanka Dagar, Pushpa Dahiya, Manu Bhambi. 2014. Recent advances in curcumin nanoformulations. NSNTAIJ, vol 8(12), 458-474.
Rathnam G., Narayanan N., Ilavarasan R. 2005. Preparation and evaluation of carbopol based nasal gels for systemic
delivery of progesterone‖, International Journal of Pharma.
Research & Development, Online. 2(1), pp.1-11.
Revathy, S., Elumalai, S. Merina Benny, Benny Antony. 2011. Isolation, Purification and Identification of Curcuminoids from Turmeric (Curcuma longa L.) by Column
Chromatography. Journal of Experimental Sciences, 2(7):
21-25.
Sanjib Bhattacharya. 2009. Phytosomes: The New Technology for Enhancement of Bioavailability of Botanicals and
Nutraceuticals. Int J of Health Research, 2(3): 225-232.
Sauvik Bhattacharyya, Sk. Milan Ahammed, Bishnu Pada Saha, Pulok K. Mukherjee. 2013. The Gallic Acid– Phospholipid Complex Improved the Antioxidant Potential of Gallic Acid by Enhancing Its Bioavailability. AAPS PharmSciTech, Vol. 14.
Sharma, O.P. 1976. Antioxidant activity of curcumin and
related compounds. Biochem. Pharmacol.25, 1811–1812.
Singh, R. P., Gangadharappa, H. V., Mruthunjaya, K. 2016. Phytosome Loaded Novel Herbal Drug Delivery System: A Review. International Research Journal of Pharmacy, vol 7. Thurapati Pandu Raju, Mettu Srikanth Reddy, Veerareddy Prabhakar Reddy. 2011. Phytosomes: A Novel
Phyto-phospholipid carriers for herbal drug delivery. Int Research
J of Pharmacy, Vol 2(6), 28-33.
Vogel, H.A., Pelletier, J. Curcumin-biological and medicinal
properties. J. Pharma 1815, 2, 50.
World Health Organization Fifty-Sixth World Health Assembly. Provisional agenda item. 2003 . A56/18 14.10.
3110 International Journal of Current Research, Vol. 11, Issue, 04, pp.3098-3110, April, 2019