doi:10.4236/ajac.2011.23039 Published Online July 2011 (http://www.scirp.org/journal/ajac)
Rapid Validated Stability Indicating Method for Nizatidine
and its Impurities Quantification
Antony Raj Gomes
1,2, Pannala Raghuram
1,2, J. Sriramulu
2, Nimmakalaya Srinivas
1 1Shasun Chemicals and Drugs Limited Company, Chennai, India 2Department of Chemistry, Sri Krishna Devaraya University, Anantapur, India
E-mail: [email protected]
Received November 10, 2010; revised March 7, 2011; accepted April 3, 2011
Abstract
This research article describes stability indicating fast liquid chromatographic method for determination of
chromatographic purity and assay of Nizatidine as a alternate for two different methods for chromatographic
purity and assay as given in USP Monograph and Ph.Eur Monograph. Proposed method is developed on
Waters symmetry RP18 (50
×4.6 mm), 3.5
μm stationary phase using gradient elution with combination of
Ammonium acetate Diethyl amine buffer, Methanol and Tetrahydrofuran as mobile phase. Favorable results
are obtained under developed conditions, which guarantee good separation of studied components. Whereas,
data obtained from method validation confirm specificity, high sensitivity, linearity in a range of studied
concentrations, repeatability and good accuracy of this method. Considerable degradation observed in
oxida-tion stress condioxida-tion was detected by this method. Eight impurities are studied among which impurity-5 is
found major degradant. The stress samples are assayed against a qualified standard and the mass balance is
found close to 99.2%. The developed method can be used for routine samples as well as stability studies.
Keywords:
Column Liquid Chromatography, Nizatidine, Forced Degradation, Validation; Stability
Indicating
1. Introduction
Nizatidine: N-(2-[(2-[(dimethylamino)methyl]thiazol-4- yl)methylthioc]ethyl)-N-methyl-2-nitroethene-1,1-dimine
. Nizatidine is a histamine
inhibits the treatment of and Axid Certain preparations of Nizatidine are now av- ailable the United States. Nizatidine has been used experimen-tally to control weight gain associated with some anti-psychotic medication [1-3].
Nizatidine is having monographs in USP [4], Ph.Eur [5]. USP monograph describes a chromatographic purity method with a runtime of 70 minutes and separate assay method with a runtime of 40 minutes. The Ph.Eur mono-graph describes a related substances method with a run-time of 60 and assay method with a run run-time of 25 mi-nutes. We have attempted in this paper a common me-thod for impurities and assay determination which is fast
and economic. In the literature survey there is no fast LC stability indicative methods are reported for chromato-graphic purity and assay for Nizatidine. Validation of chromatographic purity and assay determination methods for accurate quantification of eight impurities and in Ni-zatidine samples along with assay determination is de-scribed in this paper is carried out as per ICH recom-mendations. Intensive stress studies were carried out for possible degradants identification and degradation path-way is established for Nizatidine with validated proposed method.
2. Experimental Design
2.1. Chemicals
diethyla-mine are purchased from Merck, Darmstadt, Germany. High purity water is prepared by using Millipore Milli-Q plus water purification system.
2.2. Procedure
2.2.1. Equipment
The LC system, used for method development and me- thod validation is Agilent RRLC. The output signal is monitored and processed using EZ-Chrome elite soft-ware on Pentium computer (Digital equipment Co). RRLC is equipped with binary gradient pump, thermos-tatted auto sampler, thermosthermos-tatted column compartment, variable wavelength detector.
2.2.2. Chromatographic Conditions
The chromatographic column used is Waters Symmetry RP18 (50 × 4.6 mm) with 3.5 µm particles. The mobile phase-A contains a 0.05 M of ammonium acetate and 1.0 mL·L–1 diethylamine. Methanol and tetrahydrofuran (95:5) is used as mobile phase-B. The flow rate of the mobile phase is 1.5 mL·min–1 witha gradient program of 0/2, 2/10, 7/35, 9/45, 10/2 and 12/2 (time (min)/% B).The column temperature is maintained at 30˚C and the detection is monitored at wavelength of 254 nm. The injection volume is 10 µL.
Diluent consists buffer and methanol in the ratio 80:20.
2.2.3. Preparation of Standard and Sample Solutions: All the impurities are dissolved in diluents having con-centration of 0.1 mg/mL then make up to the volume with diluent. A Stock solution of Nizatidine (2000 µg·mL–1) is prepared by dissolving appropriate amount in the diluent. Working solution 200 µg·mL–1 is prepared from above stock solution for assay determination.
2.3. Method Development and Optimization
The USP [4] method for Nizatidine chromatographic purity determination has a run time of 70 minutes with 1.0 mL·min–1 flow rate. And the European pharmacopeia [5] method for Nizatidine chromatographic purity deter-mination has a run time of 60 minutes with 1.0 mL·min–1 flow rate. The main objective of the present study is to develop a method having less runtime which can be use for both chromatographic purity and assay determination. To calculate the flow rate we have used the formula in USP pharmacopeial forum Stimuli article “Transfer of HPLC Procedures to Suitable Columns of Reduced Di-mensions and Particle Sizes” [6].
2 2
2 1 12 2 / 11 1 F =F× ×d ×d
where F, l, and d are the flow rates, the column lengths, and the column diameters, by this formula a flow rate of 0.2 mL·min–1 was derived from USP method parameters and by using the USP method details to short length column and flow specified but when attempted Nizati-dine peak elute around 32 minutes and impurity-3 (last eluting impurity) elute around 60 minutes with low re-sponse.
Flow rate arrived from existing USP method is 0.2 mL·min–1 was derived for 50 × 4.6 mm column in which a late elution was found. To decrease the run time flow rate has increased 7.5 times i.e. 1.5 mL·min–1 when ap-plied in this condition Nizatidine peak elutes around 4.8 minutes and last impurity elutes around 11 minutes with low response. For decreasing the retention time and to raise the response of impurity-3, 5% tetrahydrofuran introduced in to the mobile phase-B. In this condition impurity-3 retention time decreased to 8.2 minutes from 11 minutes and peak responses also enhanced. The typi-cal retention times of Nizatidine, impurity-1, impurity-2, impurity-3, impurity-4, impurity-5, impurity-6, impurity- 7 and impurity-8 were about 4.801, 5.719, 2.595, 8.392, 7.381, 2.930, 2.211, 0.646 and 3.231 minutes respec-tively meeting the chromatographic system suitability requirements.( See Table 1)
2.4. Analytical Method Validation
The developed chromatographic method is validated for specificity and stress studies, sensitivity, linearity & range, precision, accuracy, and robustness and system suitability for both chromatographic purity and assay methods [7-15].
2.4.1. Specificity and Stress Studies
Specificity is the ability of the method to measure the analyte response in the presense of its potential impuri-ties. The specificity [10,11] of the developed LC method for Nizatidine was determined in the presence of its purities namely impurity-1, impurity-2, impurity-3, im-purity-4, impurity-5, impurity-6, impurity-7 and impuri-ty-8 at a concentration of 30 µg·mL–1. The stress condi-tions employed for degradation study includes photolytic (carried out as per ICH Q1B), thermal (80˚C), acid drolysis (1 N HCl), base hydrolysis (0.1 N NaOH), hy-drolysis and oxidation (10% H2O2).Peak purity of stressed samples of Nizatidine was checked by using 2996 Photo diode array detector of Waters (PDA). All stressed samples of Nizatidine were analysed for an ex-tended run time of 15 minutes to check the late eluting degradants.
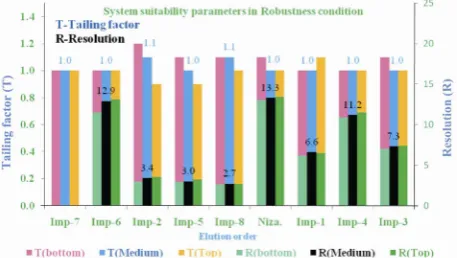
Table 1. System suitability report.
Component USP Resolution (Rs) USP Tailing factor % RSD at Precision study
Impurity-7 -- 1.0 0.11
Impurity-6 12.9 1.0 0.71
Impurity-2 3.4 1.1 1.35
Impurity-5 3.0 1.0 0.63
Impurity-8 2.7 1.1 0.39
Nizatidine 13.3 1.0 0.49
Impurity-1 6.6 1.0 0.65
Impurity-4 11.2 1.0 0.50
Impurity-3 7.3 1.0 0.80
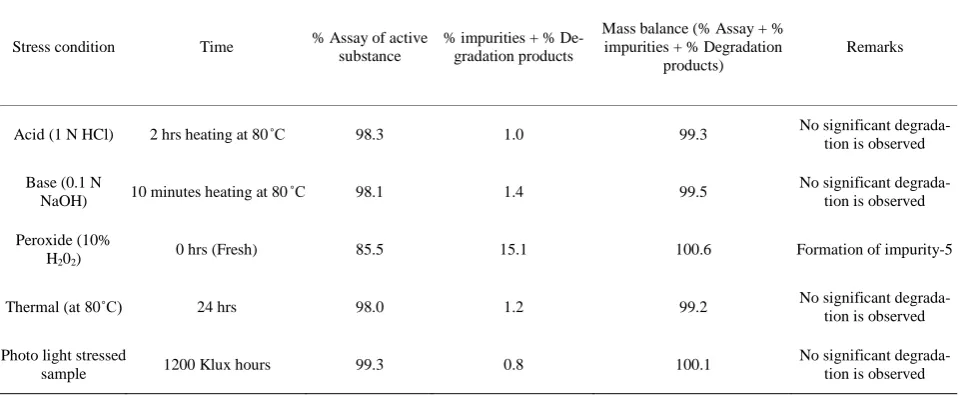
Table 2. Summary on forced degradation results.
Stress condition Time % Assay of active substance
% impurities + % De-gradation products
Mass balance (% Assay + % impurities + % Degradation
products)
Remarks
Acid (1 N HCl) 2 hrs heating at 80˚C 98.3 1.0 99.3 No significant
degrada-tion is observed
Base (0.1 N
NaOH) 10 minutes heating at 80˚C 98.1 1.4 99.5
No significant degrada-tion is observed
Peroxide (10%
H202) 0 hrs (Fresh) 85.5 15.1 100.6 Formation of impurity-5
Thermal (at 80˚C) 24 hrs 98.0 1.2 99.2 No significant
degrada-tion is observed
Photo light stressed
sample 1200 Klux hours 99.3 0.8 100.1
No significant degrada-tion is observed
+% of impurities +% of degradation products) was calcu- lated for all the samples.
2.4.2. Precision
The precision of the chromatographic purity method is checked by injecting six individual preparations of (2000 µg·mL–1) Nizatidine spiked with 0.03% each impurity. The % RSD for content of each impurity is calculated.
The intermediate precision (ruggedness) of the method is evaluated by different analyst using different column and different day in the same laboratory.
The precision of the assay method is evaluated by carrying out six independent assay of test sample of Ni-zatidine against a qualified reference standard. The % RSD of six obtained values is calculated. 95% confi-dence interval of mean has to be calculating for both % of each impurity and % of assay.
2.4.3. Sensitivity
Sensitivity was determined by establishing the Limit of detection (LOD) and Limit of quantification (LOQ) for each component estimated by based on the Signal to noise ratio method. The precision study was also carried out at the LOQ level by injecting six replicates and cal-culated the % RSD for the area of each impurity and Ni-zatidine.
2.4.4. Linearity and Range
Linearity test solutions from LOQ to 150% with respect to test concentration are prepared by diluting the impuri-ty stock solution to the required concentrations. For as-say method test solutions from 50% to 150% with re-spect to test concentration are prepared by diluting the stock solution to the required concentrations. The corre-lation coefficient, slope and Y-intercept of the calibration
[image:3.595.58.540.299.497.2](a)
(b) (c)
(d)
(e)
(f) (g)
(h) (i)
Figure 1. Chemical structures and labels of Nizatidine and its impurities. (a) Nizatidine: N-(2-[(2-[(dimethylamino)methyl] thiazol-4-yl)methylthio]ethyl)-N-methyl-2-nitroethene-1,1-diamine; (b) Impurity-1: 4-chloromethyl-2-dimethylaminomethyl
thiazole.; (c) Impurity-2: 2-Dimethylaminomethyl-4-hydroxymethylthiazole.; (d) Impurity-3: N,
N-bis[2-[[[2-[(dimethylamino) -methyl]-4-thiazolyl]methyl]thio]ethyl]-2-nitro-1, 1-ethenediamine; (e) Impurity-4:
N-[2-[[[2-[(dimethylamino)methyl]-4- thiazolyl] methyl]thio]ethyl]-2-nitro-1-thiomethyl etheneamine; (f) Impurity-5: 2-[[[2-[(dimethylamino)methyl]-4-thiazolyl] methyl]thio]ethyl-N’-methyl-2-nitro-1, 1-ethenediamine.; (g) Impurity-6:
N-Methyl-S-methyl-2-nitroethene; (h) Impurity-7: Bis-N-methyl-2-nitro ethane; (i) Impurity-8:
[image:4.595.102.497.73.635.2](a)
(b)
(c)
[image:5.595.92.504.71.617.2](d)
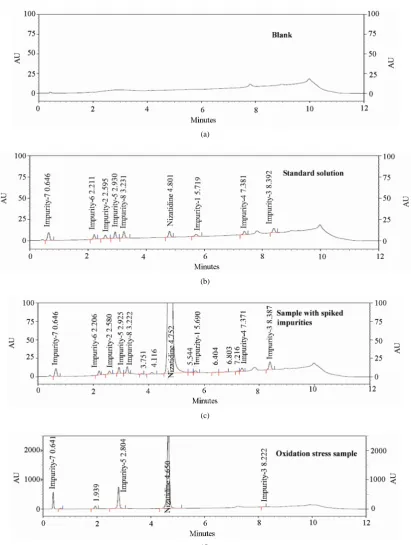
Figure 2. Typical chromatogram of blank, standard solution and Nizatidine spiked with impurities & Oxidation Stress sam-ple Chromatograms.
curve are calculated for the both chromatographic purity and assay methods.
2.4.5. Accuracy
A known amount of the impurity stock solutions are
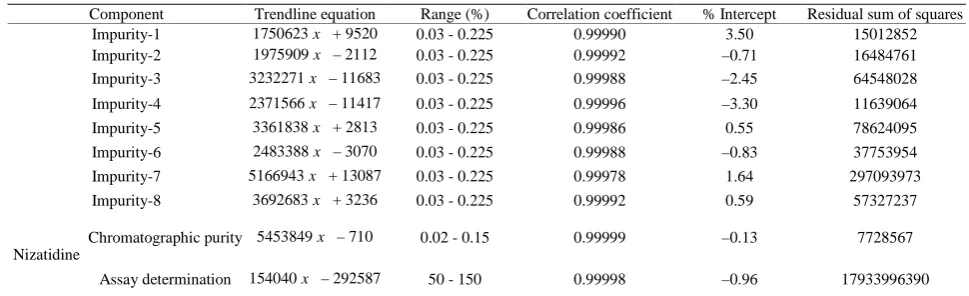
Table 3. Linearity table.
Component Trendline equation Range (%) Correlation coefficient % Intercept Residual sum of squares
Impurity-1 1750623x + 9520 0.03 - 0.225 0.99990 3.50 15012852
Impurity-2 1975909x – 2112 0.03 - 0.225 0.99992 –0.71 16484761
Impurity-3 3232271x – 11683 0.03 - 0.225 0.99988 –2.45 64548028
Impurity-4 2371566x – 11417 0.03 - 0.225 0.99996 –3.30 11639064
Impurity-5 3361838x + 2813 0.03 - 0.225 0.99986 0.55 78624095
Impurity-6 2483388x – 3070 0.03 - 0.225 0.99988 –0.83 37753954
Impurity-7 5166943x + 13087 0.03 - 0.225 0.99978 1.64 297093973
Impurity-8 3692683x + 3236 0.03 - 0.225 0.99992 0.59 57327237
Nizatidine
Chromatographic purity 5453849x – 710 0.02 - 0.15 0.99999 –0.13 7728567
[image:6.595.57.538.273.403.2]Assay determination 154040x – 292587 50 - 150 0.99998 –0.96 17933996390
Table 4. Table for accuracy study
Amount of impurity added (µg) to the
100% sample
% of Recovery
Imp-1 Imp-2 Imp-3 Imp-4 Imp-5 Imp-6 Imp-7 Imp-8
Assay determination
Amount of sub-stance added
%Recovery (Nizatidine)
0.6 98.8 93.9 94.5 98.0 92.6 94.2 92.1 96.0 50% 99.2
3.0 91.9 103.1 104.3 106.3 99.0 105.7 104.4 102.2 100% 101.3
4.5 94.3 106.5 100.4 100.2 102.3 99.7 102.3 103.0 150% 100.5
Nizatidine stock solution spiked to the sucrose at 50%, 100% and 150% of the analyte concentration (200 µg·mL–1). Each concentration level is prepared for three times. The percentage of recovery is calculated.
2.4.6. Robustness
To determine the robustness of the developed method, experimental conditions are deliberately changed and the resolution between each component is evaluated. The flow rate of the mobile phase is 1.5 mL·min–1. To study the effect of flow rate on the resolution, 0.2 units changed i.e. 1.3 and 1.7 mL·min–1. The effect of column temperature on resolution is studied at 25˚C and 35˚C instead of 30˚C. The above all varied conditions done at two single matrix analysis and the components of the mobile phase were held constant.
2.4.6.1. Robustness Change 1 (Lower):
Flow rate—1.3 mL·min–1, Column oven temperature –25˚C.
Gradient program is 0/4, 2/12, 7/37, 9/47, 10/4 and 12/4 (time (min)/% B).
2.4.6.2. Robustness Change 2 (Upper):
Flow rate—1.7 mL·min–1, Column oven temperature
–35˚C.
Gradient program is 0/0, 2/8, 7/33, 9/43, 10/0 and 12/0 (time (min)/% B).
2.4.7. Solution Stability and Mobile Phase Stability The solution stability of Nizatidine and its related impur-ities are carried out by leaving spiked sample solution in tightly capped volumetric flask at room temperature for 48 h. Impurity content is determined for every 6 h inter-val up to the study period. Mobile phase stability is also carried out for 48 h by injecting the freshly prepared sample solutions for every 6 h interval. Impurity content and assay is checked in the test solutions. Mobile phase prepared is kept constant during the study period.
3. Results and Discussions
3.1. Specificity and Stress Studies
Stress studies on Nizatidine under different stress condi-tions suggested the following degradation behavior. (See Table 2)
3.1.1. Degradation in Acid Stress Condition
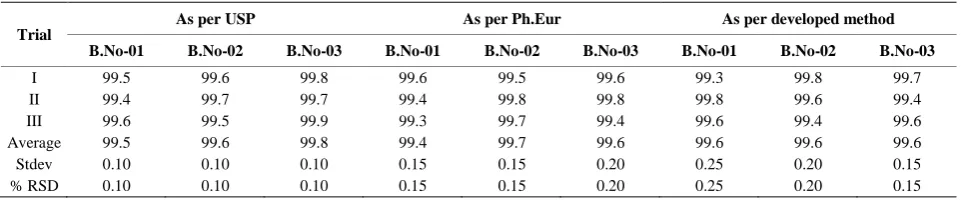
Table 5.1. Table for batch analysis of assay.
Trial
As per USP As per Ph.Eur As per developed method
B.No-01 B.No-02 B.No-03 B.No-01 B.No-02 B.No-03 B.No-01 B.No-02 B.No-03
I 99.5 99.6 99.8 99.6 99.5 99.6 99.3 99.8 99.7
II 99.4 99.7 99.7 99.4 99.8 99.8 99.8 99.6 99.4
III 99.6 99.5 99.9 99.3 99.7 99.4 99.6 99.4 99.6
Average 99.5 99.6 99.8 99.4 99.7 99.6 99.6 99.6 99.6
Stdev 0.10 0.10 0.10 0.15 0.15 0.20 0.25 0.20 0.15
% RSD 0.10 0.10 0.10 0.15 0.15 0.20 0.25 0.20 0.15
80˚C, no significant degradation is observed.
3.1.2. Degradation in Base Stress Condition
Nizatidine is exposed to 0.1 N NaOH upon heating for 10 minutes at 80˚C, no significant degradation is ob-served.
3.1.3. Degradation in Peroxide Stress Condition Nizatidine is more sensitive to the oxidative treatment, Nizatidine is undergone degradation with 10% H2O2 of fresh preparation and prominent degradation is observed as impurity-5.
3.1.4. Degradation in Neutral (Water) Stress Condition
Nizatidine is exposed water upon heating for 2 h at 80˚C, no degradation is observed.
3.1.5. Photolytic Stress Condition
Nizatidine is exposed to light for an overall illumination of 1.2 million Klux hours and an integrated near ultra-violet energy of 200-watt hours/square meter (w/mhr) (in photo stability chamber), no significant degradation is observed.
3.1.6. Thermal Stress Condition
Nizatidine exposed to dry heat at 80˚C for 24 hours, no degradation is observed.
The mass balance of stressed samples is close to 99.2%. The assay of Nizatidine is unaffected in the presence of eight impurities and its degradation products confirm the stability indicating power of the developed method.
3.2. Method Validation
3.2.1. Precision
The % RSD of area of Nizatidine, impurity-1, impuri-ty-2, impurity-3, impurity-4, impurity-5, impurity-6, im-purity- 7 and imim-purity-8 and % RSD of area % of each impurity in precision study are within 2.0 % confirming the good precision of the developed analytical method. The % RSD obtained in intermediate precision study for
Nizatidine, impurity-2, impurity-3, impurity-4, impuri-ty-5, impurity-6, impurity-7 and impurity-8 are well within 4.0%, confirming the intermediate precision of the method. The % RSD obtained in precision and interme-diate precision studies for Nizatidine are well within 1.0% of assay determination method.
95% confidence interval of mean calculated for both chromatographic purity and assay results at precision study.
3.2.2. Sensitivity
The limit of detection of Nizatidine, impurity-1, impuri-ty-2, impurity-3, impurity-4, impurity-5, impurity-6, im-purity-7 and impurity-8 is 0.006% (of analyte concentra-tion, i.e. 2000 µg·mL–1) for 10 µL injection volume. The limit of quantification of Nizatidine, impurity-1, impuri-ty-2, impurity-3, impurity-4, impurity-5, impurity-6, im-purity-7 and impurity-8 is 0.03% (of analyte concentra-tion, i.e. 2000 µg·mL–1) for 10 µL injection volume. The % RSD for area of Nizatidine, impurity-1, impurity-2, impurity-3, impurity-4, impurity-5, impurity-6, impuri-ty-7 and impurity-8 are below 5 for precision at LOQ level.
3.2.3. Linearity and Range
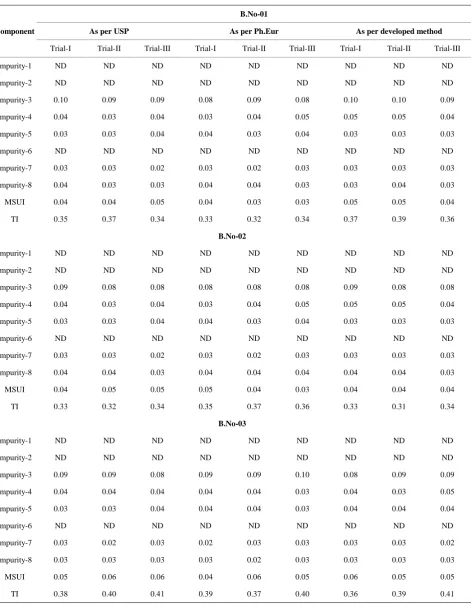
Table 5.2. Table for Batch analysis of Chromatographic purity
Component
B.No-01
As per USP As per Ph.Eur As per developed method
Trial-I Trial-II Trial-III Trial-I Trial-II Trial-III Trial-I Trial-II Trial-III
Impurity-1 ND ND ND ND ND ND ND ND ND
Impurity-2 ND ND ND ND ND ND ND ND ND
Impurity-3 0.10 0.09 0.09 0.08 0.09 0.08 0.10 0.10 0.09
Impurity-4 0.04 0.03 0.04 0.03 0.04 0.05 0.05 0.05 0.04
Impurity-5 0.03 0.03 0.04 0.04 0.03 0.04 0.03 0.03 0.03
Impurity-6 ND ND ND ND ND ND ND ND ND
Impurity-7 0.03 0.03 0.02 0.03 0.02 0.03 0.03 0.03 0.03
Impurity-8 0.04 0.03 0.03 0.04 0.04 0.03 0.03 0.04 0.03
MSUI 0.04 0.04 0.05 0.04 0.03 0.03 0.05 0.05 0.04
TI 0.35 0.37 0.34 0.33 0.32 0.34 0.37 0.39 0.36
B.No-02
Impurity-1 ND ND ND ND ND ND ND ND ND
Impurity-2 ND ND ND ND ND ND ND ND ND
Impurity-3 0.09 0.08 0.08 0.08 0.08 0.08 0.09 0.08 0.08
Impurity-4 0.04 0.03 0.04 0.03 0.04 0.05 0.05 0.05 0.04
Impurity-5 0.03 0.03 0.04 0.04 0.03 0.04 0.03 0.03 0.03
Impurity-6 ND ND ND ND ND ND ND ND ND
Impurity-7 0.03 0.03 0.02 0.03 0.02 0.03 0.03 0.03 0.03
Impurity-8 0.04 0.04 0.03 0.04 0.04 0.04 0.04 0.04 0.03
MSUI 0.04 0.05 0.05 0.05 0.04 0.03 0.04 0.04 0.04
TI 0.33 0.32 0.34 0.35 0.37 0.36 0.33 0.31 0.34
B.No-03
Impurity-1 ND ND ND ND ND ND ND ND ND
Impurity-2 ND ND ND ND ND ND ND ND ND
Impurity-3 0.09 0.09 0.08 0.09 0.09 0.10 0.08 0.09 0.09
Impurity-4 0.04 0.04 0.04 0.04 0.04 0.03 0.04 0.03 0.05
Impurity-5 0.03 0.03 0.04 0.04 0.04 0.03 0.04 0.04 0.04
Impurity-6 ND ND ND ND ND ND ND ND ND
Impurity-7 0.03 0.02 0.03 0.02 0.03 0.03 0.03 0.03 0.02
Impurity-8 0.03 0.03 0.03 0.03 0.02 0.03 0.03 0.03 0.03
MSUI 0.05 0.06 0.06 0.04 0.06 0.05 0.06 0.05 0.05
TI 0.38 0.40 0.41 0.39 0.37 0.40 0.36 0.39 0.41
tion method (See Figure 3, Table 3).
Theoretical response calculated for each component with Trendline equation and also calculated residuals, residual sum of squares and sensitivity plot (Response for unit concentration) of each component. There is no trend in residuals and sensitivity plot obtained within the specified range.
3.2.4. Accuracy
The percentage recovery of impurity-1, impurity-2, im-purity-3, impurity-4, impurity-5, impurity-6, impurity-7 and impurity-8, in Active pharmaceutical Ingredient (API) samples ranged from 91.9 to 106.5. LC chromato-gram of spiked sample with four impurities in Nizatidine sample is shown in Figure 2(b). The percentage recov-ery of Nizatidine in assay determination method ranged from 99.2 to 101.3 (See Table 4).
3.2.5. Robustness
Close observation of analysis results for deliberately ch- anged chromatographic conditions (flow rate and column temperature) revealed that the resolution between closely eluting impurities, namely impurity-5 and impurity-8 is greater than 2.5, illustrating the robustness of the me- thod.
And also done system precision and method precision studies in robustness conditions. The % RSD of area of Nizatidine, impurity-1, impurity-2, impuri-ty-3,impurity-4, impurity-5, impurity-6, impurity-7 and impurity-8 and % RSD of area % of each impurity in robustness study for replicate injections and preparations (n=3) are within 5.0% confirming the good precision of method in robustness conditions.
[image:9.595.58.287.549.678.2]3.2.6. Solution Stability and Mobile phase Stability The % RSD of assay of Nizatidine during solution stabil-ity and mobile phase stabilstabil-ity experiments is within 1.0. No significant changes are observed in the content of
Figure 3. Typical chart for comparison of system suitability parameters in Robustness condition with as such condition (Medium).
impurity-1, impurity-2, impurity-3, impurity-4, impurity- 5, impurity-6, impurity-7 and impurity-8 during solution stability and mobile phase stability experiments. The solution stability and mobile phase stability experiments data confirms that sample solutions and mobile phase used chromatographic purity and assay determination are stable up to the study period of 48 h.
3.2.7. Comparative analysis
Three consecutive batches are selected and analyzed as per USP, Ph.Eur methods as well as developed method for both chromatographic purity and assay by HPLC for three times and the percentage of each impurity and as-say results are compared for three methods. The USP and Ph.Eur methods results are comparable with the new developed method (See Table 5).
4. Conclusions
The Stability indicating fast LC method for Nizatidine and its impurities Quantification is developed and vali-dated as per ICH requirements. The gradient RRLC me-thod developed and used for stress studies is also fit for quantitative, chromatographic purity and assay determi-nation of Nizatidine. The developed method is stability indicating which can be used for the impurity testing and assay determination in routine analysis of production samples and also to analyze stability samples.
5. Acknowledgements
The authors wish to thank the management of Shasun chemicals and drugs Limited for supporting this work.
6. References
[1] M. Atmaca, M. Kuloglu, E. Tezcan, B. Ustundag and N. Kilic, “Nizatidine for the Treatment of Patients with Que-tiapine-Induced Weight Gain,” Hum Psychopharmacol, Vol. 19, No. 1, 2004, pp. 37-40
[2] PRNewswire,
Marketing Rights to Axid (R),” Indianapolis, September 7, 2000.
[3] “Acid Inhibitory
Characteris-tics of Nizatidine in Man: An Overview,” Scandinavian Journal of Gastroenterology, Vol. 29, No. s206, 1994, pp.
3-7
[4] The United States Pharmacopoeia 32 National Formulary 27. (USP)
[5] European Pharmacopoeia 4.2, Council of Europe, 2002, pp. 2737-2739.
Col-umns of Reduced Dimensions and Particle Sizes,” Phar-macopeial Forum, Vol. 35, No. 6, 2009, pp.1622-1626. [7] International Conference on Harmonization (ICH),
“Sta-bility Testing of New Drug Substances and Products,” ICH Topic Q1A (R2), ICH Secretariat, Geneva, 2005. [8] International Conference on Harmonization (ICH),
“Pho-tostability Testing of New Drug Substances and Prod-ucts,” ICH Q1B Guidline, ICH Secretariat, Geneva, 2005. [9] S. W. Baertschi, K. Alsante and R. A. Reed,
“Pharma-ceutical Stress Testing: Predicting Drug Degradation,” Drugs and the Pharmaceutical Sciences, Vol. 153, 2005,
pp. 1- 482
[10] US FDA guidance, “Analytical Procedures and Methods Validation,” Food and Drug Administration, Rockville, 2000.
[11] The United States Pharmacopeial Convention, “Valida-tion of Compendial Methods <1225>,” The United States Pharmacopeia, Rockville, 2009.
[12] M. E. Swartz and I. S. Krull, “Developing and Validating Stability-Indicating Methods by Michael Swartz and Ira Krull,” LC-GC North America, 2005.
[13] International Conference on Harmonization (ICH), “Va-lidation of Analytical Procedures: Text and Methodolo-gy,” Q2 (R1), ICH Secretariat, Geneva, 2005.
[14] J. Ermer and J. H. McB. Miller, “Method Validation in Pharmaceutical Analysis: A Guide to Best Practice,” Wi-ley-VCH, enero, 2005.
![Figure 1. Chemical structures and labels of Nizatidine and its impurities. (a) Nizatidine: NN-methyl-NN-[2-[[[2-[(dimethylamino)methyl]-4- thiazolyl] methyl]thio]ethyl]-2-nitro-1-thiomethyl etheneamine; (f) Impurity-5: 2-[[[2-[(dimethylamino)methyl]-4-thia](https://thumb-us.123doks.com/thumbv2/123dok_us/9066810.403076/4.595.102.497.73.635/structures-nizatidine-impurities-nizatidine-dimethylamino-thiomethyl-etheneamine-dimethylamino.webp)