ISSN Online: 2327-4344 ISSN Print: 2327-4336
DOI: 10.4236/gep.2019.77012 Jul. 26, 2019 172 Journal of Geoscience and Environment Protection
A Novel Simulation Framework for Predicting
the Formation Parameters Variation in
Unconsolidated Sandstone Reservoir
Hongying Li, Wei Zhang, Bin Liu, Xinran Wang, Xilin Liu
Tianjin Branch of CNOOC (China) Limited, Tianjin, China
Abstract
After long-term waterflooding in unconsolidated sandstone reservoir, the high-permeability channels are easy to evolve, which leads to a significant reduction in water flooding efficiency and a poor oilfield development effect. The current researches on the formation parameters variation are mainly based on the experiment analysis or field statistics, while lacking quantitative research of combining microcosmic and macroscopic mechanism. A network model was built after taking the detachment and entrapment mechanisms of particles in unconsolidated sandstone reservoir into consideration. Then a coupled mathematical model for the formation parameters variation was es-tablished based on the network modeling and the model of fluids flowing in porous media. The model was solved by a finite-difference method and the Gauss-Seidel iterative technique. A novel field-scale reservoir numerical si-mulator was written in Fortran 90 and it can be used to predict 1) the evolve-ment of high-permeability channels caused by particles release and migration in the long-term water flooding process, and 2) well production performances and remaining oil distribution. In addition, a series of oil field examples with inverted nine-spot pattern was made on the new numerical simulator. The results show that the high-permeability channels are more likely to develop along the main streamlines between the injection and production wells, and the formation parameters variation has an obvious influence on the remain-ing oil distribution.
Keywords
Formation Parameters Variation, Network Modeling, Numerical Simulation, High-Permeability Channels, Remaining Oil Distribution, Unconsolidated Sandstone Reservoir
How to cite this paper: Li, H. Y., Zhang, W., Liu, B., Wang, X. R., & Liu, X. L. (2019). A Novel Simulation Framework for Predicting the Formation Parameters Vari-ation in Unconsolidated Sandstone Reser-voir. Journal of Geoscience and Environ-ment Protection, 7, 172-183.
https://doi.org/10.4236/gep.2019.77012
Received: May 22, 2019 Accepted: July 23, 2019 Published: July 26, 2019
Copyright © 2019 by author(s) and Scientific Research Publishing Inc. This work is licensed under the Creative Commons Attribution International License (CC BY 4.0).
http://creativecommons.org/licenses/by/4.0/
DOI: 10.4236/gep.2019.77012 173 Journal of Geoscience and Environment Protection
1. Introduction
Because of its low expense and high effectiveness, waterflooding is the most pop-ular enhanced oil recovery technique applied in Chinese oil fields, such as Daqing oil field and Shengli oil field. During the waterflooding process, water is injected into the formation via the injection wells continually and the injected water will make great impacts on the formation parameters, such as permeability, porosity, content of clay minerals and contact pattern of skeleton particles. Consequently, these impacts could be of great importance for the distribution of the remaining oil and development of the oil fields (Han, 2010; Shokri & Babadagli, 2016).
Usually, researches about the formation parameters variation are carried out from the macroscopic perspective and the main techniques are the indoor dis-placement experiment and the core analysis (You et al., 2007; Li, 2005; Wu et al., 2002; He & Xu, 2010; Shi et al., 2013). For indoor displacement experiment, rock cores obtained from the field are used and the water displacement process is ap-plied to them. During the displacement process, experimental data of the per-meability and porosity at different injected pore volume are recorded and curves based on the experiment data will be made for the analysis of parameters varia-tion. For core analysis, coring is conducted and cores at various water-cut stages are gained. Then the parameters of these cores could be measured and analyzed. However, results of these methods are just the reflection of the variation rules of formation parameters and the reasons and mechanisms of these variations are still unknown.
For its advantages of low expense and dynamic prediction, reservoir simula-tion is quite a significant technique used during the long period of reservoir de-velopment. Besides, it is also quite useful for the study of the remaining oil dis-tribution (Rege & Fogler, 1987; Jiang et al., 2005; Cui et al., 2012; Feng et al., 2009; Crandell et al., 2012; Feng & Bai, 2011). However, formation permeability in the traditional reservoir simulators is set as a constant which is quite different from that of the actual conditions and this will result in the inaccuracy of predic-tive development results.
Based on the analysis above, several works are conducted here. A network model for formation parameter variation is introduced by taking various particle mechanisms into consideration, such as particle detachment, particle deposition. Variation of the formation permeability and porosity is studied and a mathe-matical model is proposed based on the simulation results. Then the coupled ma-thematical model for formation parameters variation is established and simula-tions under different condisimula-tions are conducted based on a novel reservoir nu-merical simulator. The reservoir permeability variation and its influence on the remaining oil distribution are analyzed.
2. Pore Network Modeling for Formation Parameters
Variation
DOI: 10.4236/gep.2019.77012 174 Journal of Geoscience and Environment Protection multiphase flow. In recent years, there has been increasingly interest in pore-scale modeling for researchers from various fields and great progress has been made. Pore network modeling is no longer limited to the simple two-phase flow and the computation of relative permeability. For two-phase flow, effects of wettabil-ity, wetting hysteresis and mass transfer between phases could also be studied. Besides, some more applications of pore network modeling have been devel-oped, such as modeling of three-phase flow, non-Newtonian flow and formation impairment (Hou et al., 2005; Blunt et al., 2013; Feng et al., 2015; Li et al., 2017; Watson et al., 2017).
In this part, a pore network model of formation parameters variation is pro-posed by taking into account different mechanisms about particles. The main mechanisms considered in this model are detachment and entrapment. In addi-tion, pores and throats of the rock are represented by cylinders in this model and have circular cross-section.
2.1. Detachment of Particles from Pore/Throat
As analyzed above, flow of injected water will bring drag force on the particles attached on the surface of pore/throat. And if the fluid velocity goes higher, par-ticles will be detached from the surface and flow out of the reservoir with in-jected fluid. Then the pore/throat size will increase, which will be in favor of flu-id flowing through the reservoir. The mathematical model presented by Jalel & Jean-Francois (1999) is employed to calculate the detachment rate of particles from the pore surface,
(
)
ri i i c bi
r =α u u C− (1)
where, rri is the detachment rate of particles from the pore/throat surface per
unit area, 1 m s
(
2⋅)
;i
u is the rate of fluid flowing in pore space, m/s; uc is
the critical flowing rate and the particles just begin to detach when the fluid flow-ing rate is higher than the critical rate, m/s; αi is the release coefficient, and equals
to zero when u ui≤ c; Cbi is the volumetric concentration of particles on the
pore/throat surface, dimensionless.
2.2. Entrapment of Particles to Pore/Throat Surface
Particles flowing with injected water may also be precipitated and attached on the surface of pore/throat again or strained at the pore/throat entrance which will result in the blockage of pore/throat. The main entrapment mechanisms in-clude surface deposition, direct blockage and bridging.
Surface deposition means that detached particles with smaller size may be reat-tached to the pore/throat surface under the effect of gravity or electric forces and re-sult in the decrease of pore/throat radius. The equation for describing particle depo-sition in the pore network simulation was proposed by Jalel & Jean-Francois (1999),
2
6 p
ci i i fi
i d
r r u C
L
π
= ⋅ ⋅ ⋅ ⋅
DOI: 10.4236/gep.2019.77012 175 Journal of Geoscience and Environment Protection where, rci is the deposition rate per unit pore surface area, 1 m s
(
2⋅)
; Cfi is thevolumetric particle concentration of the fluid in pore space, dimensionless; ri
is the radius of pore/throat, m; ui is the fluid flowing rate through the pore/throat,
m/s; dp is the particle radius, m; Li is the length of throat, m.
Particle blockage happens when particles flow through a pore or throat whose radius is smaller than the particles. Then the particle will be entrapped at the en-trance and make the pore/throat blocked.
Particle bridging means that several particles whose radius is smaller than that of their passing pore/throat could plug the pore/throat by bridging at its en-trance. Generally, scholars consider that when the size of the particle is bigger than 1/3 of its passing pore/throat, bridging would take place and result in the blockage of the pore/throat (Faruk, 2010).
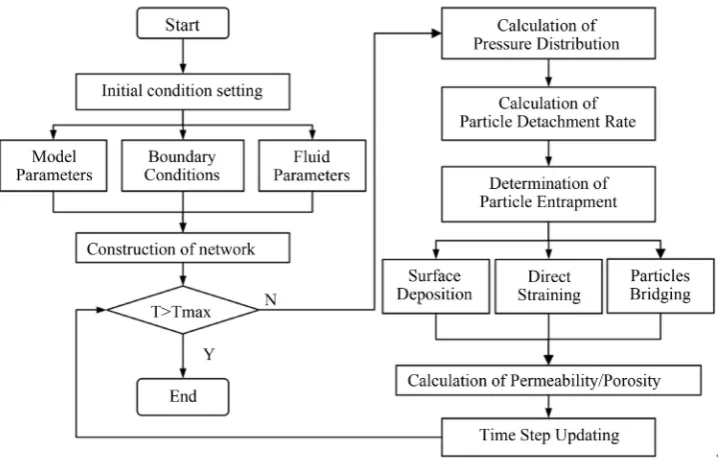
Computation algorithm for the pore network modeling is shown in Figure 1. Simulations are conducted to study formation parameters variation under ous pressure gradients. The simulation results of permeability and porosity vari-ation are shown in Figure 2 and Figure 3.
As shown in Figure 1, firstly, set the initial conditions, including model pa-rameters, boundary conditions, and fluid parameters. Secondly, construct the pore network for formation parameters variation. Thirdly, based on the pore network model, calculate the formation permeability and porosity with the itera-tive method.
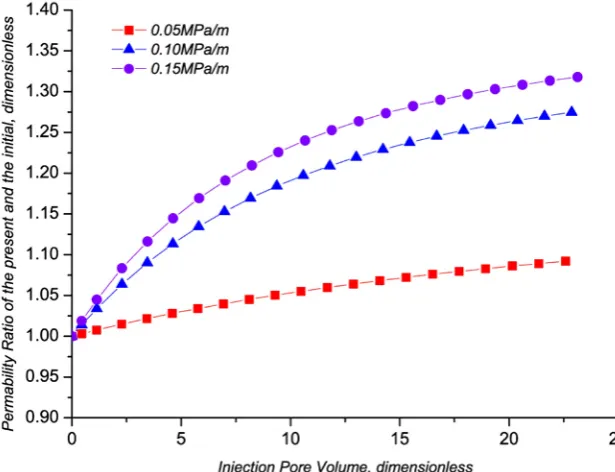
[image:4.595.179.540.476.714.2]As shown in Figure 2, for a certain pressure gradient, permeability of the net-work increases gradually and the curve goes stable after long-term water flood-ing. For simulations at different pressure gradient, the permeability increases more quickly at higher pressure gradient. And Figure 3 reveals that the porosity variation principle is similar to that of permeability.
DOI: 10.4236/gep.2019.77012 176 Journal of Geoscience and Environment Protection
[image:5.595.216.534.349.578.2]Figure 2. Simulation results of permeability variation.
Figure 3. Simulation results of porosity variation.
3. The Coupled Mathematical Model for Formation
Parameters Variation
3.1. The Coupled Mathematical Model
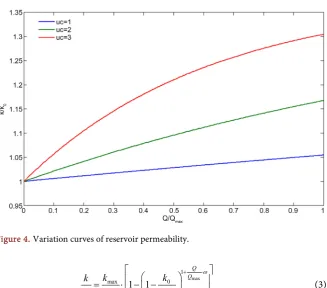
Based on the pore network modeling for formation parameters variation, the varia-tion curves of reservoir permeability under different condivaria-tions are shown in
DOI: 10.4236/gep.2019.77012 177 Journal of Geoscience and Environment Protection
Figure 4. Variation curves of reservoir permeability.
max
1
max 0
0 0 max
1 1
Q Q
k k
k
k k k
ω + ⋅ = ⋅ − − (3)
max 0 1 2.38 sh
k k = + V (4)
2
0.235uc 0.375uc 0.26
ω = − + (5)
where, k, k0, kmax mean the absolute permeability at every moment, the initial
absolute permeability, and the maximum absolute permeability, respectively. μm2; Q, Q
max mean the cumulative flowing rate per unit pore/throat area, the
maximum cumulative flowing rate per unit pore/throat area, respectively, m/s; uc means the cementation strength among sand particles, which is classified into
three groups (uc = 1, 2, 3), dimensionless, and uc = 3 indicates the minimum
ce-mentation strength. Vsh means the clay content, dimensionless.
The basic mathematical model for fluids flowing in porous media is,
(
)
(
)
(
)
(
)
(
)
rw w
w w vw
w w w
ro o
o o vo
o o o
rg so ro
g g o o
g g o o
g
sw rw so o sw w
w w vg
w w g o w
kk p gD q s
B t B
kk p gD q s
B t B
kk p gD R kk p gD
B B
s
R kk p gD q R s R s
B t B B B
φ ρ µ φ ρ µ ρ ρ µ µ ρ φ µ ∂ ∇ ⋅ ∇ − + = ∂ ∂ ∇ ⋅ ∇ − + = ∂ ∇ ⋅ ∇ − + ∇ ⋅ ∇ − + ∂ ∇ ⋅ ∇ − + = + + ∂ (6)
where, so, sg, sw mean the saturation of oil phase, gas phase, water phase,
respec-tively; ρo, ρg, ρw mean the density of oil phase, gas phase, water phase,
re-DOI: 10.4236/gep.2019.77012 178 Journal of Geoscience and Environment Protection spectively; Bo, Bg, Bw mean the formation volume factor of oil phase, gas phase,
water phase, respectively; kro, krg, krw mean the relative permeability of oil phase,
gas phase, water phase, respectively; μo, μg, μw mean the viscosity of oil phase, gas
phase, water phase, respectively; Po, Pg, Pw mean the pressure of oil phase, gas
phase, water phase, respectively; qvo, qvg, qvw mean the injection/production rate
of oil, gas, water, respectively.
Combined Equations (3)-(5) with Equation (6), the formation permeability variation will be taken into consideration in the mathematical model for fluids flowing in porous media, i.e., the coupled mathematical model for formation parameters variation is established.
3.2. Numerical Solution
The coupled mathematical model for formation parameters variation consists of a set of nonlinear equations, which mainly includes the continuity equations of oil, water, and gas phase, the equations of formation permeability variation, and a series of auxiliary equations. The finite difference method is used to solve the nonlinear equation system since the analytical solutions of the system are in-tractable. In this work, the implicit pressure and explicit saturation method (IMPES) and Gauss-Seidel iterative technique are used to solve the coupled ma-thematical model. The procedures of the solution are listed as follows:
1) The pressure and saturation of oil, water, and gas are obtained first by IMPES.
2) The cumulative flowing rate per unit pore/throat is calculated by Darcy’s law.
3) The new absolute permeability (k) is calculated by formation permeability variation model (Equations (3)-(5)).
4) The next iteration is computed if maximum time is not reached.
4. Numerical Results and Discussions
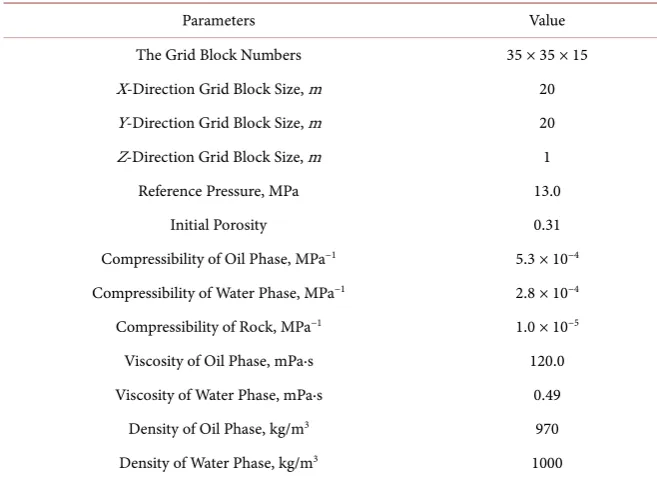
Based on the coupled mathematical model for formation parameters variation, a novel three dimensional (3D) field-scale reservoir numerical simulator is devel-oped in Fortran 90. A conceptual model is simplified from a typical well group in a China offshore oilfield. The geological model parameters are given in Table 1 and Table 2, and the relative permeability curves are shown in Figure 5. On the basis of the novel 3D field-scale reservoir numerical simulator, the permea-bility and remaining oil distribution is studied in reverse rhythm reservoir with inverted nine-spot pattern.
4.1. Comparisons of the Permeability and Remaining Oil
Distribution with and without Considering Formation
Parameters Variation
DOI: 10.4236/gep.2019.77012 179 Journal of Geoscience and Environment Protection
Table 1. The geological model description.
Parameters Value
The Grid Block Numbers 35 × 35 × 15
X-Direction Grid Block Size, m 20
Y-Direction Grid Block Size, m 20
Z-Direction Grid Block Size, m 1
Reference Pressure, MPa 13.0
Initial Porosity 0.31
Compressibility of Oil Phase, MPa−1 5.3 × 10⁻⁴
Compressibility of Water Phase, MPa−1 2.8 × 10⁻⁴
Compressibility of Rock, MPa−1 1.0 × 10⁻⁵
Viscosity of Oil Phase, mPa·s 120.0
Viscosity of Water Phase, mPa·s 0.49
Density of Oil Phase, kg/m3 970
[image:8.595.208.537.353.709.2]Density of Water Phase, kg/m3 1000
Table 2. Reservoir initial horizontal permeability.
No. Initial horizontal permeability, 10−3 μm2 No. Initial horizontal permeability, 10−3 μm2
1 3000 9 1600
2 2850 10 1400
3 2700 11 1200
4 2550 12 1050
5 2400 13 900
6 2200 14 750
7 2000 15 600
8 1800
DOI: 10.4236/gep.2019.77012 180 Journal of Geoscience and Environment Protection
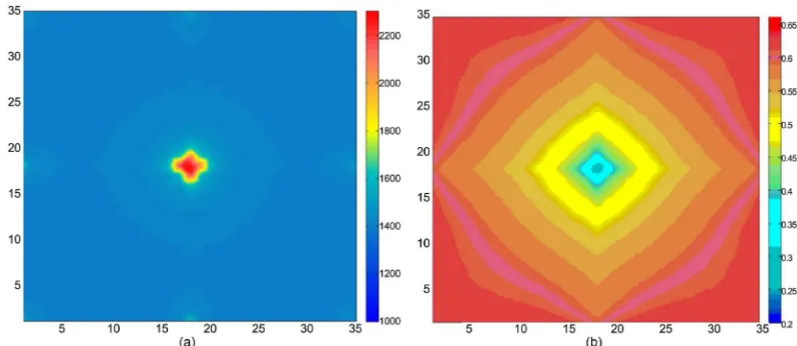
Figure 6. The permeability and remaining oil distribution of the 10th layer considering the formation pa-rameters variation. (a) Permeability distribution; (b) Remaining oil distribution.
formation parameters is not taken into consideration in the reservoir numerical simulator, the permeability distribution and remaining oil distribution of the 10th layer is shown in Figure 7.
Compared Figure 6 with Figure 7, when the variation of formation parame-ters is taken into consideration, the reservoir permeability changes obviously around the injection well and the main streamlines between the injection and production wells, and the remaining oil saturation, as is shown in Figure 6, is higher than that in Figure 7. The results can be validated by the experiment data carried out by Chen et al. (2016). In the experiment, the initial formation per-meability is 5661.9 × 10−3 μm2. After long-term water flooding, the formation
permeability increases to 7574.5 × 10−3 μm2. For the reverse rhythm reservoir
with large permeability ratio, the injection water flow to production wells along the top layers preferentially. Therefore, the high-permeability channels are more likely to develop in the top layers and the remaining oil mainly accumulates in the bottom layers.
4.2. The Sensitivity Analysis for Permeability Ratio
Take the conceptual model with permeability ratio of 1 and 5 for example. When the water cut reaches 90%, the permeability distribution and remaining oil dis-tribution of the 2nd and the 12th layer are shown in Figure 8 and Figure 9 re-spectively.
DOI: 10.4236/gep.2019.77012 181 Journal of Geoscience and Environment Protection
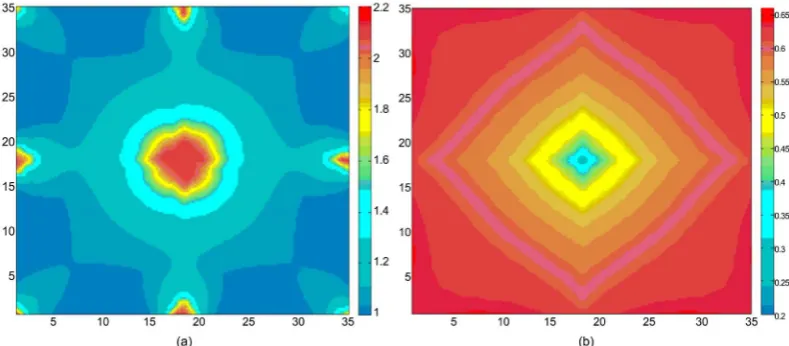
[image:10.595.138.537.301.471.2]Figure 7. The permeability and remaining oil distribution of the 10th layer without considering the forma-tion parameters variaforma-tion. (a) Permeability distribuforma-tion; (b) Remaining oil distribuforma-tion.
Figure 8. The permeability and remaining oil distribution when permeability ratio is 1. (a) Permeability dis-tribution of the 2nd layer; (b) Remaining oil disdis-tribution of the 12th layer.
[image:10.595.141.536.519.692.2]DOI: 10.4236/gep.2019.77012 182 Journal of Geoscience and Environment Protection the experiment, the permeability of high permeability ratio formation increases due to the injected water during the later stage of production. The high-permeability channels are more obvious influenced by water flooding and later physical and chemical reformation.
5. Conclusion
The novel simulation framework combining microcosmic and macroscopic me-chanism provides considerable guiding significance for predicting the formation parameters variation. What’s more, the study also demonstrates that the novel simulation framework provides sufficient information for remaining oil descrip-tion.
But the formation parameters variation is difficult to determine. Therefore, it can only be approximately simulated through the novel simulation framework. To obtain more precise results, a series of experiments on formation parameters variation are necessary to be carried out.
Conflicts of Interest
The authors declare no conflicts of interest regarding the publication of this pa-per.
References
Blunt, M. J., Bijeljic, B., Dong, H. et al. (2013). Pore-Scale Imaging and Modelling. Ad-vances in Water Resources, 51, 197-216.
https://doi.org/10.1016/j.advwatres.2012.03.003
Chen, D. Q., Li, J. Y., Zhu, W. S., & Xin, Z. (2016). Experimental Research on Reservoir Parameters Variation after Water Flooding for Offshore Unconsolidated Sandstone Heavy Oil Reservoirs. China Offshore Oil and Gas, 28, 64-60.
Crandell, L. E., Peters, C. A., Um, W., Jones, K. W., & Lindquist, W. B. (2012). Changes in the Pore Network Structure of Hanford Sediment after Reaction with Caustic Tank Wastes. Journal of Contaminant Hydrology, 131, 89-99.
https://doi.org/10.1016/j.jconhyd.2012.02.002
Cui, C. Z., Geng, Z. L., Wang, Y. Z., Huang, Y., & Liu, H. (2012). Calculation Model of Dynamic Permeability Distribution and its Application to Water Drive Reservoir at High Water Cut Stage. Journal of China University of Petroleum (Edition of Natural Science), 36, 118-122.
Faruk, C. (2010). Non-Isothermal Permeability Impairment by Fines Migration and De-position in Porous Media Including Dispersive Transport. Transport in Porous Media, 85, 223-258.https://doi.org/10.1007/s11242-010-9557-0
Feng, Q. H., & Bai, J. W. (2011). Network Simulation on Effect of Displacement Pressure Gradient on Relative Permeability Curve. Petroleum Geology and Oilfield Develop-ment in Daqing, 30, 84-88.
Feng, Q. H., Li, S., Han, X. D. et al. (2015). Network Simulation for Formation Impair-ment due to Suspended Particles in Injected Water. Journal of Petroleum Science and Engineering, 133, 384-391.https://doi.org/10.1016/j.petrol.2015.06.027
DOI: 10.4236/gep.2019.77012 183 Journal of Geoscience and Environment Protection Development, 36, 498-502.
Han, D. K. (2010). Status and Challenges for Oil and Gas Field Development in China and Directions for the Development of Corresponding Technologies. Engineering Science, 12, 51-57.
He, W. X., & Xu, Y. (2010). Law and Mechanism of Reservoir Parameters Change Both Before and After Waterflooding in Gangdong Development Area. Fault-Block Oil & Gas Field, 17, 191-193.
Hou, J., Li, Z. Q., Guan, J. T., Wang, K., & Chen, Y. (2005). Water Flooding Microscopic Seepage Mechanism Research Based on Three-Dimension Network Model. Acta Me-chanica Sinica, 37, 783-787.
Jalel, O., & Jean-Francois, V. (1999). A Two-Dimensional Network Model to Simulate Permeability Decrease under Hydrodynamic Effect of Particle Release and Capture. Transport in Porous Media, 37, 303-325. https://doi.org/10.1023/A:1006690700000
Jiang, H. Q., Gu, J. W., Chen, M. F., & Sun, M. (2005). Reservoir Simulation of Remaining Oil Distribution Based on Time-Variant Reservoir Model. Petroleum Exploration and Development, 32, 91-93.
Li, J., McDougall, S. R., & Sorbie, K. S. (2017). Dynamic Pore-Scale Network Model (PNM) of Water Imbibition in Porous Media. Advances in Water Resources, 107, 191-211.https://doi.org/10.1016/j.advwatres.2017.06.017
Li, Y. (2005). Variation Rule of Macro Parameters and Dynamic Model of Oil Reservoirs in Continental Faulted Basin. Acta Petrolei Sinica, 26, 65-68.
Liu, H. Q., Li, B. Y., Wang, W. F. et al. (2014). Characteristics Analysis of the Reservoir and Predominate Channel in Block Jin-16. Journal of Southwest Petroleum University (Science & Technology Edition), 36, 60-68.
Rege, S. D., & Fogler, H. S. (1987). Network Model for Straining Dominated Particle En-trapment in Porous Media. Chemical Engineering Science, 42, 1553-1564.
https://doi.org/10.1016/0009-2509(87)80160-4
Shi, C. L., Zhang, F. H., & Chen, P. (2013). Affection of Simulating Water-flooding by Water Injection Tests on Reservoir Properties. Journal of Southwest Petroleum Uni-versity (Science & Technology Edition), 35, 87-93.
Shokri, A. R., & Babadagli, T. (2016). Field Scale Modeling of CHOPS and Sol-vent/Thermal Based Post CHOPS EOR Applications Considering Non-equilibrium Foamy Oil Behavior and Realistic Representation of Wormholes. Journal of Petroleum Science and Engineering, 137, 144-156. https://doi.org/10.1016/j.petrol.2015.11.026
Watson, M. G., Bondino, I., Hamon, G., &McDougall, S. R. (2017). A Pore-Scale Inves-tigation of Low-Salinity Waterflooding in Porous Media: Uniformly Wetted Systems. Transport in Porous Media, 118, 201-223.https://doi.org/10.1007/s11242-017-0854-8
Wu, X. S., Su, X. J., & Wu, Z. L. (2002). Logging Geology Evaluation of Reservoir Para-meter Changes in Water Flooding Production. Well Logging Technology, 26, 311-314. You, Q. D., Zhou, F. X., Zhang, J. L., & Chen, Y. (2007). Law and Mechanism of