ISSN Print: 2162-2078
DOI: 10.4236/tel.2019.93035 Mar. 15, 2019 499 Theoretical Economics Letters
The Performance of Dividend ETFs: The Study
of the Spillover and Leverage Effects
Jo-Hui Chen
1, Dang Trung Kien
21Department of Finance, Chung Yuan Christian University, Taiwan
2College of Business, Chung Yuan Christian University, Taiwan
Abstract
The objective of this study is to identify the existence of spillover and leverage effects from returns and return volatilities of high yield and low yield divi-dend ETFs on tracing market stock indices, and vice versa. The Generalized Autoregressive Conditional Heteroscedasticity-in-Mean-Autoregressive Moving Average (GARCH-M-ARMA) and the Exponentially Generalized Autore-gressive Conditional Heteroscedasticity-in Mean AutoreAutore-gressive Moving Av-erage (EGARCH-M-ARMA) are utilized by authors. The six ETFs, recog-nized in Top 100 ETFs of etfdb.com database, with their underlying indices are selected to represent the high and low dividend yield ETFs group. The findings show that the spillover effect in return is more happening in a group of low yield dividend ETFs, while the spillover effect on return volatilities is more dominant in a group of high yield dividend ETFs. In the case of the le-verage effect, it exists in all ETFs and the stock Index, in which the negative asymmetric volatility effect more happens when comparing the positive asymmetric volatility effect.
Keywords
Dividend ETFs, Spillover Effect, Leverage Effect, GARCH, EGARCH
1. Introduction
The dividend-payout policy is measured as one of the critical financial decisions, and dividend payment may influence the interests of shareholders and the future growth of a firm.
Even from some school of thought, such as Miller and Modigliani [1], the dividend does not affect the value of shares based on the assumption of a perfect capital market as non-taxable dividend and issuing additional shares with the How to cite this paper: Chen, J.-H. and
Kien, D.T. (2019) The Performance of Dividend ETFs: The Study of the Spillover and Leverage Effects. Theoretical Econom-ics Letters, 9, 499-510.
https://doi.org/10.4236/tel.2019.93035
Received: December 24, 2018 Accepted: March 12, 2019 Published: March 15, 2019
Copyright © 2019 by author(s) and Scientific Research Publishing Inc. This work is licensed under the Creative Commons Attribution International License (CC BY 4.0).
DOI: 10.4236/tel.2019.93035 500 Theoretical Economics Letters free cost. Proved by experimental studies of Brennan [2] and Litzenberger and Ramaswamy [3], if the dividend tax is higher than income tax from the sale of shares (capital gain), the higher dividend will reduce the value of shares.
With its primary function as a fund distribution of firms to its shareholders, dividend makes a belief that a high dividend payout should be a potential idea when investing in the stock market. According to Graham and Dodd [4], if in-vestors prefer dividends, an increase in the dividend may enhance the shares value. Besides, high dividend payments may reduce the volatility of future cash flows; a high payout ratio minimizes the cost of capital, making a higher value of shares. Experimental studies of Gordon [5] and Fisher [6] bring results that support this argument. Their findings show that the dividend has a greater im-pact on the share price, compared to the effect of retained earnings. Using NYSE stock return data from 1963 to 1994, the study conducted by Naranjo et al. [7]
reveals that the returns are positively related to long-run taxable dividend yield. Since early 90’s, the creation of Exchange-Traded Funds (ETFs) has become one of the most outstanding financial innovations in decades. By following the performance of their benchmark indices, ETFs help investors with the less amount of capital to have a chance of investing in a basket of potential profit stocks, bonds or other types of investments. Many ETFs have been classified as dividend ETFs funds related high yields and more stability for investment port-folios growing in popularity for a while now. However, it is hard to find a spe-cific academic study of this investment instrument. There is an interesting ques-tion if the factors lead to high yield stocks. They are the same as for the high yield ETFs. The findings of this study will be a useful application because many shareholders evaluate their target investments based on profit earning. Mainly, there are those investors who prefer the dividend payout, not only to stabilize portfolio and minimize risk, but also hedge against inflation or even accumulate a revenue stream.
The objective is to examine bilateral effects and asymmetric volatility effect of dividend ETFs on their benchmark stock index, and vice versa, utilizing ARMA-M-GARCH and ARMA-M-EGARCH model. Instead of using the stan-dard deviation to investigate risk and return relationships in ETFs as a variety of existing literature, the coefficient of variance will be chosen in this study. The data of high yield dividend ETFs based on the list provided by etfdb.com data-base in which three ETFs on the top of the list will be chosen as high yield ETFs, while the other three at the bottom will be considered as the group of low yield dividend ETFs. This database may secure the accuracy as well as the popularity of those ETFs in the financial market. The separation of two yield groups not only helps to compare their performance with each other but also gives a broad-er view of the diffbroad-erent influence of each group on market returns and return volatilities.
DOI: 10.4236/tel.2019.93035 501 Theoretical Economics Letters especially those interested in dividend investing. As of their most concerns when choosing to invest in dividend type ETFs are how much they may earn and how risky they have to face. To the best of our understanding, with no other previous research conducting about dividend ETFs, the results of spillover and the leve-rage effects on this financial instrument may fulfill some missing in the litera-ture. At the same time, this finding contributes economic importance to the in-vestors when evaluating between ETFs and stock index for their portfolios, which results in more accurate decisions to balance between risk and return of investment.
Section 2 of this study is a brief review of previous studies and some major ideas in the stock dividend yield, the ETFs and the method of GARCH-M-ARMA and EGARCH-M-ARMA also applied in this field. Section 3 represents the sam-ple data for describing the group of high and low yield dividend ETFs, and the testing hypothesis. The empirical results will be presented in Section 4 to reveal the existences of the spillover effect of returns and return volatilities between the ETFs and stock index. The risk and leverage effects are also reviewed at the end. Section 5 is the conclusion.
2. Literature Review
The discussion on whether the positive relationship between stock returns and dividend yields has been evidenced in empirical studies. Litzenberger and Ra-maswamy [3] revealed that there was a positive and non-linear relationship be-tween expected dividends and stock returns. Intuitively, high dividends are de-sirable for stockholders as an immediate profit, but low payout ratios can be good too. According to Zvi, Alex and Alan [8], low payouts can signal the com-pany growing rapidly, while capital turnover associated with the potential in-vestment project brings high total returns. Other studies by Cochrane [9] re-vealed that the key element of variation for the dividend yield connected with the market portfolio was return predictability. Likewise, the study of Maio and Clara [10] implied the estimates from a first-order vector autoregression (VAR) shows that future dividend growth can be predicted by the dividend-to-price ra-tio of small stocks, while it is a signal about return predictability, especially with larger stocks at longer horizons.
DOI: 10.4236/tel.2019.93035 502 Theoretical Economics Letters provided a high risk-adjusted returns as part of an internationally diversified portfolio comparing to closed-end funds.
The effects of ETFs have been strongly backed by prior research in which mentioning about pricing efficiency of ETFs and underlying stock index changes in the volatility of security are examined [14] [15]. Moreover, Gao [16] hig-hlighted the advantage of ETFs which were “diversification, convenience, sim-plicity, cost-effectiveness, transparency, flexibility, tax-efficiency, and variety”. Deville [17] pointed out that the advent of ETFs not only enhanced the liquidity of the individual stock, but also increased the efficiency of an index for deriva-tives markets. Compared to other types of funds, the benefits of ETFs are more attractive to study in this field. Among them, the study of the spillover and leve-rage effects on ETFs returns and return volatilities present potential. Lin and Chiang [15] applied the GARCH model and found that asymmetric volatility in Taiwan’s Top 50 Tracker Fund was contingent on increased volatility of finan-cial and electronic component stocks. While using GARCH-ARMA and EGARCH-ARMA models to check spillover effects of ETFs, Chen and Huang
[18] and Singh [19] [20] examined the spillover and the leverage effects on re-turns and return volatilities of stock indexes and ETFs for both emerging mar-kets and developed countries.
Furthermore, Chen [21] focused on the ethical and non-ethical ETFs against their underlying stock indices. Chen and Diaz [22] studied Faith-based ETFs using GARCH-M-ARMA and EGARCH-M-ARMA. They all show a bilateral connection between ETFs and the benchmark indexes. Another study is apply-ing GARCH family model by Huang et al. [23]. They used MSCI world index to compare their forecasting performance on value-at-risk (VaR), and the findings suggested that GARCH-in-mean model outperformed other models.
The dividend ETFs is one of the popular financial instruments. However, among the variety of research conducted about ETFs, of no earlier study has examined for the influence of high and low yield dividend ETFs. Thus, this study aims to fill this gap by considering the high yield ETFs performance when com-pared to the low yield ETFs. Following the method applied by Chen [21] and Chen and Diaz [22], this work will study the spillover and leverage effects to learn wherever the effects that ETFs may bring their market index, vice versa.
3. Data and Methodology
DOI: 10.4236/tel.2019.93035 503 Theoretical Economics Letters no data earlier than January 1st of 2012. In total, 22,800 daily data of ETFs and stock index was used as the dataset for this study.
The logarithm of daily closing prices (return) is used to compute the return of both the stock index and the ETF. In detail, the difference between the logarithm of the price at time t − 1 for ETFs and the difference between the logarithm of the index (I) at time t and time t − 1 for the stock index is calculated with the equations below. , 1 ln 100 m t i t t I R I− = ∗
, (1)
, 1 ln 100 e t i t t P R P− = ∗
, (2) where, Rm and Re represent stock index returns and the ETFs returns at time t, respectively. I and P are stock index and ETF closing price, respectively.
Followed by the study of Chen and Huang [18] and Chen [21], the EGARCH-M-ARMA model is applied in the study of the spillover effect. The interdependence between a stock index and ETF returns is affected by market shocks.
The spillover effects for returns and return volatilities are illustrated as fol-lows:
, 1 , , 1 , 1 , ,
g s
e e m e e e
i t o i i i t i i t i t i i i t i i t
R =α +
∑
=α R − +wR − +ε +∑
=θ ε − +zh , (3)2
, 1 , 1 ,
p p
e e e
i t o i i i t i i i i t i
h =a +
∑
=α ε − +∑
=Ψh − , for GARCH, (4), 1 , , 1 , 1 , ,
g s
m e e m m m
i t o i i i t i i t i t i i i t i i t
R =β +
∑
=αR − +dR − +ε +∑
=γ γ − +kh , (5)2
, 1 , 1 ,
q q
m m m
i t o i i i t i i i i t i
h =b +
∑
=bε − +∑
=ζ h − , for GARCH, (6), 1 , , 1 , 1 , ,
g s
e e m e e e
i t o i i i t i i t i t i i i t i i t
R =α +
∑
=α R − +wR − +ε +∑
=θ ε − +zh , (7)( )
( )
2 2 2 , , , 1 , , , , 1 log log e eq i t i i t i
e
i t o i i e i e
i t i i t i
p e m
i i t i i t i
i
h a a
h h h v ε ε δ ε − − = − − − − = = + +
+ Ψ +
∑
∑
, for EGARCH, (8)
(
)
, 1~ 0, ( , )
e e
i t t N hi t
ε Ψ− ,
, 1 , , 1 , 1 , ,
g s
m e e m m m
i t o i i i t i i t i t i i i t i i t
R =β +
∑
=αR − +dR − +ε +∑
=γ γ − +kh , (9)( )
( )
2 2 2 , , , 1 , , , , 1 log log m mq i t i i t i
e
i t o i i m i m
i t i i t i
p m e
i i t i i t i
i
h b b
h h h l ε ε δ ζ ε − − = − − − − = = + + + +
∑
∑
, for EGARCH, (10)
(
)
1 ,
, ~ 0,
m
i t t N hi tm
ε Ψ− ,
DOI: 10.4236/tel.2019.93035 504 Theoretical Economics Letters return volatilities. ε represents the residual, h is the conditional variances, and θ,
γ stand for the unknown parameters. Previous studies by Chou [24] and French, Schwert, and Stambaugh [25] used the standard deviation to represent the risk, and the relationship between risk and return is denoted by z and k coefficients in the variance in this study.
Based on the null hypothesis of:
- There is no spillover effects of returns: w = 0; d = 0,
- There is no spillover effects of returns volatilities: v = 0; l = 0,
against the alternative hypotheses of there is an existence of spillover effect be-tween the returns (volatility) of ETF and its corresponding stock index.
In addition, from the comparison between GARCH’s family model with the leverage effect in the study of Rodriguez and Ruiz [26], they concluded that EGARCH specification is the most flexible. Also, the reviews of Chen and Diaz
[22], Chou [24], Singh [19] [20] and French, Schwert, and Stambaugh [25] con-sidered the leverage effect between the stock index and ETFs trading in the market, EGARCH-M-ARMA was also chosen to apply, where δ is leverage term in this research.
4. Empirical Findings
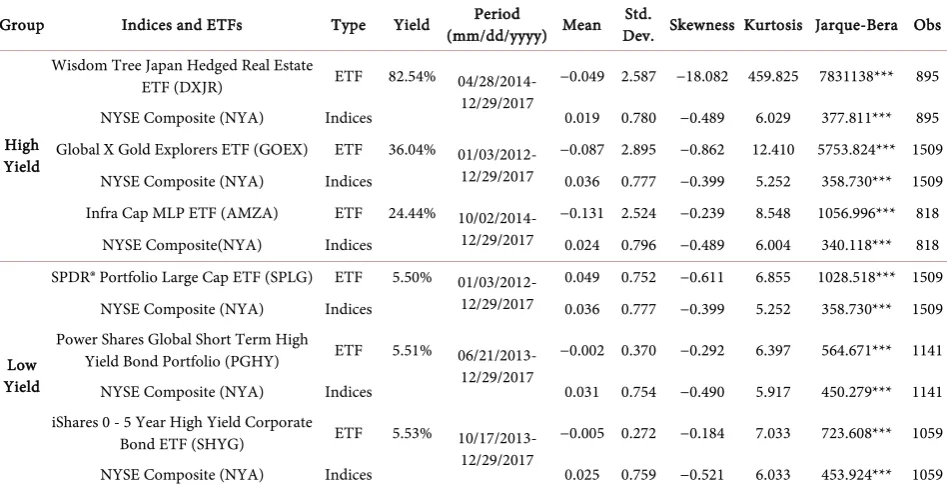
[image:6.595.63.537.466.711.2]A majority of ETFs presents a slightly negative return in mean (Table 1). How-ever, as a characteristic of the sample ETFs, the investors are concentrating on high dividend payout. And a common behavior of dividend preferred investor, and they look for a stable and acceptable income from dividend share, rather than on the different earning from trading the securities.
Table 1. Descriptive statistic.
Group Indices and ETFs Type Yield (mm/dd/yyyy) Mean Period Dev. Skewness Kurtosis Jarque-Bera Obs Std.
High Yield
Wisdom Tree Japan Hedged Real Estate
ETF (DXJR) ETF 82.54% 04/28/2014- 12/29/2017
−0.049 2.587 −18.082 459.825 7831138*** 895
NYSE Composite (NYA) Indices 0.019 0.780 −0.489 6.029 377.811*** 895 Global X Gold Explorers ETF (GOEX) ETF 36.04% 01/03/2012-
12/29/2017
−0.087 2.895 −0.862 12.410 5753.824*** 1509 NYSE Composite (NYA) Indices 0.036 0.777 −0.399 5.252 358.730*** 1509 Infra Cap MLP ETF (AMZA) ETF 24.44% 10/02/2014-
12/29/2017
−0.131 2.524 −0.239 8.548 1056.996*** 818 NYSE Composite(NYA) Indices 0.024 0.796 −0.489 6.004 340.118*** 818
Low Yield
SPDR® Portfolio Large Cap ETF (SPLG) ETF 5.50% 01/03/2012- 12/29/2017
0.049 0.752 −0.611 6.855 1028.518*** 1509 NYSE Composite (NYA) Indices 0.036 0.777 −0.399 5.252 358.730*** 1509 Power Shares Global Short Term High
Yield Bond Portfolio (PGHY) ETF 5.51% 06/21/2013- 12/29/2017
−0.002 0.370 −0.292 6.397 564.671*** 1141
NYSE Composite (NYA) Indices 0.031 0.754 −0.490 5.917 450.279*** 1141 iShares 0 - 5 Year High Yield Corporate
Bond ETF (SHYG) ETF 5.53% 10/17/2013- 12/29/2017
−0.005 0.272 −0.184 7.033 723.608*** 1059
DOI: 10.4236/tel.2019.93035 505 Theoretical Economics Letters It can be observed that the high yield dividend ETFs group has more volatility than the low yield dividend group. In particular, GOEX presented the highest volatility (2.895). Based on the findings of Docking and Koch [27], dividend change announcements cause a larger variation in the stock price. While Black and Scholes [28] revealed that the stock price might change temporarily related to the change in the dividend, the results indicated that the change signals something about the likelihood for future earnings. Due to the high dividend announcement, it can be explained by the high volatility in this group. In addi-tion, all the ETFs from the group of low yield dividend also perform lower vola-tility than its corresponding market stock index. Further, most of the samples are negatively skewed and are of leptokurtic distribution. The assumption of the normal distribution cannot be accepted because all Jarque-Bera statistics are sig-nificant.
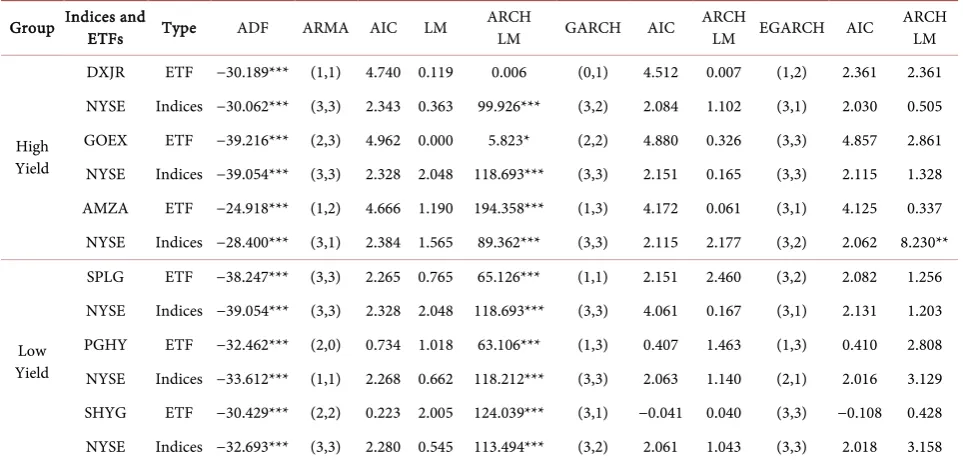
In Table 2, it indicates that all the Augmented Dickey-Fuller (ADF) test is
significant, which mean the testing time series data for ETFs returns and stock index returns are all stationary. This paper used the minimum value of the Akaike Information Criterion (AIC) to choose the best orders of the ARMA, GARCH and EGARCH models. A null hypothesis of no serial correlation has been tested by the Breusch-Godfrey LM test. The results indicate that there is no serial correlation due the fact that the null hypotheses cannot be rejected.
[image:7.595.59.541.478.710.2]To test for the ARCH effect, the Autoregressive Conditional Heteroscedastic-ity Lagrange Multiplier (ARCH-LM) was chosen. High yield ETF, i.e. DXJR, presents the insignificant result. Most of other ETFs and stock index are significant in ARCH-LM test. It means that the null of no ARCH effect for the model rejected. The ARCH-LM can be re-conducted to examine the capability to eliminate ARCH
Table 2. Unit Root, LM, ARCH-LM, and EGARCH tests for Stock Index and ETFs return.
Group Indices and ETFs Type ADF ARMA AIC LM ARCH LM GARCH AIC ARCH LM EGARCH AIC ARCH LM
High Yield
DXJR ETF −30.189*** (1,1) 4.740 0.119 0.006 (0,1) 4.512 0.007 (1,2) 2.361 2.361 NYSE Indices −30.062*** (3,3) 2.343 0.363 99.926*** (3,2) 2.084 1.102 (3,1) 2.030 0.505 GOEX ETF −39.216*** (2,3) 4.962 0.000 5.823* (2,2) 4.880 0.326 (3,3) 4.857 2.861 NYSE Indices −39.054*** (3,3) 2.328 2.048 118.693*** (3,3) 2.151 0.165 (3,3) 2.115 1.328 AMZA ETF −24.918*** (1,2) 4.666 1.190 194.358*** (1,3) 4.172 0.061 (3,1) 4.125 0.337 NYSE Indices −28.400*** (3,1) 2.384 1.565 89.362*** (3,3) 2.115 2.177 (3,2) 2.062 8.230**
Low Yield
DOI: 10.4236/tel.2019.93035 506 Theoretical Economics Letters errors in the residuals of both GARCH-M-ARMA and EGARCH-M-ARMA models. The ARCH-LM test results suggest no autoregressive conditional hete-roskedasticity for all ETFs samples, while there is an exception in the stock index sample.
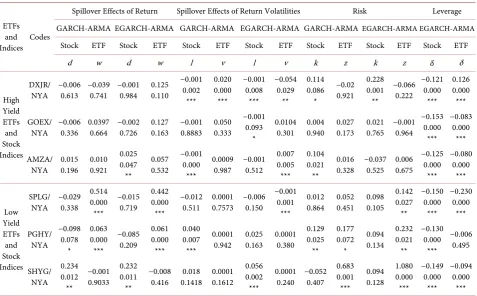
Table 3 reveals the empirical results of GARCH-M-ARMA and
EGARCH-M-ARMA models to estimate the spillover effects between stock in-dex return (volatility) and ETFs’ return (volatility) for groups of high and low yield dividend ETFs. Meanwhile, the existence of the leverage effect is verified by checking the significant autocorrelation through EGARCH-M-ARMA.
[image:8.595.62.540.416.712.2]The spillover effect for returns has been explained by the coefficients of lagged stock index returns (w) and lagged ETF returns (d) which were influential in the current ETF and stock return [22]. The findings show that the spillover effect is more happening in groups of low yield dividend ETFs with a unilateral positive effect (SPLG/NYA, PGHY/NYA, SHYG/NYA), while most of the result in high yield dividend ETFs are insignificant. To explain for this phenomenon, we may consider the decision-making the process of the investor in low yield dividend ETFs. Investing in dividend ETFs somehow also means they are investing in a portfolio of stocks. When a company distributes the dividend, it also needs to retain the earning for the future project or other investment opportunities. It makes a high dividend not always a good signal for the investor as of their scare on the lower future growth of companies. Thus, the investor when investing in
Table 3. Spillover effects of returns, Spillover effects of volatilities and Leverage effect for Stock Indices and ETF return.
ETFs and Indices Codes
Spillover Effects of Return Spillover Effects of Return Volatilities Risk Leverage GARCH-ARMA EGARCH-ARMA GARCH-ARMA EGARCH-ARMA GARCH-ARMA EGARCH-ARMA EGARCH-ARMA
Stock ETF Stock ETF Stock ETF Stock ETF Stock ETF Stock ETF Stock ETF
d w d w l v l v k z k z 𝛿𝛿 δ
High Yield ETFs and Stock Indices DXJR/
NYA −0.006 0.613 −0.039 0.741 −0.001 0.984 0.125 0.110
−0.001 0.002 *** 0.020 0.000 *** −0.001 0.008 *** −0.054 0.029 ** 0.114 0.086 * −0.02 0.921 0.228 0.001 ** −0.066 0.222 −0.121 0.000 *** 0.126 0.000 *** GOEX/
NYA −0.006 0.336 0.0397 0.664 −0.002 0.726 0.127 0.163 −0.001 0.8883 0.050 0.333 −0.001
0.093 *
0.0104
0.301 0.004 0.940 0.027 0.173 0.021 0.765 −0.001 0.964 −0.153 0.000 *** −0.083 0.000 *** AMZA/
NYA 0.015 0.196 0.010 0.921 0.025 0.047 ** 0.057 0.532 −0.001 0.000 *** 0.0009 0.987 −0.001 0.512
0.007 0.005 *** 0.104 0.021 ** 0.016
0.328 −0.037 0.525 0.006 0.675 −0.125 0.000 *** −0.080 0.000 *** Low Yield ETFs and Stock Indices SPLG/ NYA −0.029 0.338
0.514 0.000 *** −0.015 0.719 0.442 0.000 *** −0.012
0.511 0.0001 0.7573 −0.006 0.150 −0.001
0.001 ***
0.012
0.864 0.052 0.451 0.098 0.105 0.142 0.027 ** −0.150 0.000 *** −0.230 0.000 *** PGHY/ NYA −0.098 0.078 * 0.063 0.000 *** −0.085 0.209 0.061 0.000 *** 0.040 0.007 *** 0.0001
0.942 0.025 0.163 0.0001 0.380 0.129 0.025 ** 0.177 0.072 * 0.094 0.134 0.232 0.021 ** −0.130 0.000 *** −0.006 0.495 SHYG/ NYA 0.234 0.012 ** −0.001 0.9033 0.232 0.011 ** −0.008
0.416 0.1418 0.018 0.0001 0.1612 0.056 0.002 ***
0.0001 0.240 −0.052 0.407
DOI: 10.4236/tel.2019.93035 507 Theoretical Economics Letters the dividend ETFs, they may not only expect for a good income currently but also maintain the stable growth of firms in the long term. This idea is especially suitable in the case of low yield dividend group.
From the side of return volatilities, the lagged of stock indices return (l) and ETFs return (v) have been used to test. The results showed that some spillover effects are more dominant in high yield dividend group. The result of the bila-teral relationship of GARCH-M-ARMA model for DXJR/NYA is mixed by both positive and negative significant relationship. For the low yield group, the spil-lover effect is likely less existence. However, most of the coefficients are signifi-cantly positive, except for the slight negatively relative. The negative bilateral re-lationship for EGARCH-M-ARMA model such as DXJR/NYA indicates that the return volatility of the stock index may impact on the conditional variance for ETF return volatility. Meanwhile, there turn volatility of ETFs also spillover to the stock index return volatility. In reality, we may consider that the active movement on ETFs trading may create a significant influence on the market in-dices trade as well. This idea is essential for the investor when observing and predict stock market movement, which is identical to the finding of Chen and Huang [18] regarding the relationship between bilateral influence on volatility and trading strategy.
The empirical results of variance k and z stand for the relationship between return and risk. There are several coefficients significantly, which were the ma-jorly positive sign. The results proved a widely accepted economic movement, when the risk increased, and it induced the expected return. In the case of high and low yield dividend ETFs and stock index, the raising of risk results in unilater-al higher gaining for both stock index and ETFs. This finding is consistent with Chen and Diaz [22] of the Faith-based ETFs. The results of EGARCH-M-ARMA model for most of the leverage effect (δ) are all negatively significant, which mean there is the leverage effect in all ETFs and stock indices. These results are consistent with Balaban [29] and Chen and Huang [18]. The negative asymme-tric volatility effect performed strongly in most of high and low yield dividend ETFs as well as the NYA (NYSE Composite Index).
5. Conclusions
Among many types of research on ETFs, the missing of study on the specific field of dividend ETFs has been recognized. This study investigated the spillover and leverage effects of dividend ETFs and stock index return as well as return volatilities to fulfill the gap. Followed by the study of Chen and Huang [18],
Chen [21] and Singh [19] [20], GARCH-M-ARMA and EGARCH-M-ARMA
have been applied in the comparison of two groups of high yield and low yield dividend ETFs.
sig-DOI: 10.4236/tel.2019.93035 508 Theoretical Economics Letters nificant, mostly positive, in the relationship between risk and return. This result supports the idea that riskier investment goes with a higher expected return. In addition, there is the leverage effect in all ETFs and the stock Index, in which the negative asymmetric volatility effect more happens when comparing the positive asymmetric volatility effect.
The finding of this study, first, fulfills a gap in the research of dividend ETFs performance regarding the spillover effect. Secondly, it provides some evidence to the investor in predicting the market movement as well as trading deci-sion-making, based on the connection between the ETFs and the stock market index. It is especially beneficial for dividend preferred investors. Those seeking for a stable investment channel may look at the relationship between low yield ETFs and market index as of its spillover dominant. While those preferring the price trading may consider about high yield dividend ETFs as a matter of spil-lover effect for volatility between ETFs and stock index more frequently in this group. However, this study remains some limitations, for example the identifica-tion of high and low dividend ETFs is still quite simple. Future researchers can improve it by applying some critical approaches to ETF’s yield calculation and definition. At the same time, classifying the high yield ETFs by market, industry, geography may be potential for future investigations.
Conflicts of Interest
The authors declare no conflicts of interest regarding the publication of this pa-per.
References
[1] Miller, M. and Modigliani, F. (1961) Dividend Policy, Growth, and the Valuation of
Shares. Journal of Business, 34, 411-433. https://doi.org/10.1086/294442
[2] Brennan, M. (1970) Tax, Market Valuation, and Corporate Financial Policy.
Na-tional Tax Journal, 23, 417-427.
[3] Litzenberger, R. and Ramaswamy, K. (1982) The Effects of Dividends on Common
Stock Prices Tax Effects or Information Effects? The Journal of Finance, 37,
429-443.https://doi.org/10.1111/j.1540-6261.1982.tb03565.x
[4] Graham, B. and Dodd, D.L. (1951) Security Analysis. McGraw Hills, New York.
[5] Gordon, M.J. (1959) Dividends, Earnings, and Stock Prices. The Review of
Eco-nomics and Statistics, 41, 99-105.https://doi.org/10.2307/1927792
[6] Fisher, G.R. (1961) Some Factors Influencing Share Prices. Economic Journal, 71,
121-141.https://doi.org/10.2307/2228227
[7] Naranjo, A., Nimalendran, M. and Ryngaert, M. (1998) Stock Returns, Dividend
Yields, and Taxes. The Journal of Finance, 53, 2029-2057. https://doi.org/10.1111/0022-1082.00082
[8] Zvi, B., Alex, K. and Alan, J.M. (2012) Essentials of Investments. McGraw-Hill/Irwin,
9.
[9] Cochrane, J. (2008) The Dog That Did Not Bark: A Defense of Return
DOI: 10.4236/tel.2019.93035 509 Theoretical Economics Letters
[10] Maio, P. and Santa, C.P. (2015) Dividend Yields, Dividend Growth, and Return
Predictability in the Cross Section of Stocks. Journal of Financial and Quantitative
Analysis, 50, 33-60.https://doi.org/10.1017/S0022109015000058
[11] Anderson, S.C., Born, J.A. and Schnusenberg, O. (2010) Closed-End Funds,
Exchange-Traded Funds, and Hedge Funds. Innovations in Financial Markets and
Institutions.https://doi.org/10.1007/978-1-4419-0168-2
[12] Patro, D.K. (2001) Market Segmentation and International Asset Prices: Evidence
from the Listing of World Equity Benchmark Shares. Journal of Financial Research,
24, 83-98.https://doi.org/10.1111/j.1475-6803.2001.tb00819.x
[13] Harper, J.T., Madura, J. and Schnusenberg, O. (2006) Performance Comparison
between Exchange-Traded Funds and Closed-End Country Funds. Journal of
In-ternational Financial Market Institutions and Money, 16, 104-122. https://doi.org/10.1016/j.intfin.2004.12.006
[14] Ackert, L.F. and Tian, Y.S. (2000) Arbitrage and Valuation in the Market for
Standard and Poor’s Depositary Receipts. Financial Management, 29, 71-88.
https://doi.org/10.2307/3666230
[15] Lin, C. and Chiang, M. (2005) Volatility Effect of ETFs on the Constituents of the
Underlying Taiwan 50 Index. Applied Financial Economics, 15, 1315-1322.
https://doi.org/10.1080/09603100500389630
[16] Gao, S. (2001) ETFs, the New Generation of Investment Funds. ETFs and Indexing,
1, 101-105.
[17] Deville, L. (2008) Exchange Traded Funds: History, Trading and Research.
Hand-book of Financial Engineering, 18, 1-37. https://doi.org/10.1007/978-0-387-76682-9_4
[18] Chen, J. and Huang, C. (2010) An Analysis of the Spillover Effects of Exchange
Traded Funds. Applied Economics, 42, 1155-1168.
https://doi.org/10.1080/00036840701721182
[19] Singh, A.P. (2016) Do Technology Spillovers Accelerate Performance of Firms?
Unravelling a Puzzle from Indian Manufacturing Industry. Economics and Applied
Informatics, 3, 108-120.
[20] Singh, A.P. (2017) Does FDI Promote Productivity? A Deep Dive. Indian Journal of
Industrial Relations, 52, 443-455.
[21] Chen, J. (2011) The Spillover and Leverage Effects of Ethical Exchange Traded
Fund. Applied Economics Letters, 18, 983-987. https://doi.org/10.1080/13504851.2010.520663
[22] Chen, J. and Diaz, J.F. (2012) Spillover and Leverage Effects of Faith-Based
Ex-change Traded Funds. Journal of Business and Policy Research, 7, 1-12.
[23] Huang, H.C., Su, Y.C. and Tsui, J.T. (2015) Asymmetric GARCH Value-at-Risk
over MSCI in Financial Crisis. International Journal of Economics and Financial
Issues, 5, 390-398.
[24] Chou, R.Y. (1987) Volatility Persistence and Stock Valuations: Some Empirical
Evidence Using GARCH. Journal of Applied Econometrics, 3, 279-294.
https://doi.org/10.1002/jae.3950030404
[25] French, K.R., Schwert, G.W. and Stambaugh, R.F. (1987) Expected Stock Returns
and Volatilities. Journal of Financial Economics, 19, 3-29. https://doi.org/10.1016/0304-405X(87)90026-2
[26] Rodriguez, M.J. and Ruiz, E. (2009) GARCH Models with Leverage Effect:
Univer-DOI: 10.4236/tel.2019.93035 510 Theoretical Economics Letters
sidad Carlos III de Madrid.
[27] Docking, D.S. and Koch, P.D. (2005) Sensitivity of Investor Reaction to Market
Direction and Volatility: Dividend Change Announcements. Journal of Finance
Research, 28, 21-40.https://doi.org/10.1111/j.1475-6803.2005.00112.x
[28] Black, F. and Scholes, M. (1974) The Effects of Dividend Yield and Dividend Policy
on Common Stock Prices and Returns. Journal of Financial Economics, 1, 1-22.
https://doi.org/10.1016/0304-405X(74)90006-3
[29] Balaban, E.A. (2005) Stock Returns and Volatility: Empirical Evidence from