Munich Personal RePEc Archive
Destination performance: Introducing
the utility function in the mean-variance
space
Zhang, Linjia and Botti, Laurent and Petit, Sylvain
Heilongjiang University, CRESEM – CAEPEM, IAE de l’UPV, IDP (EA 1384), University of Valenciennes
2016
1
Destination performance: Introducing the utility
function in the Mean-Variance space
By Linjia Zhang (IDP, University of Valenciennes), Laurent Botti (CAEPEM, University of Perpignan) and Sylvain Petit (IDP, University
of Valenciennes)
ABSTRACT
Economic characteristics of home countries can cause considerable
variations in the tourism demand. For example, the average level of
expenditure per tourist varies from one origin to another and these
variations may alter overtime. Thus different tourist nationalities are
associated with different level of expenditures and risks. Therefore
strategies aimed at minimizing the variations may become an important
issue for the policy makers. In this paper, we aim to use the productivity
measurement theory in a mean-variance space to a French region (Nord
Pas-de-Calais) by introducing the utility function in a mean-variance
framework. With this method, we can calculate the optimal portfolio share
for each origin and give some useful political advices to the policy decision
makers to improve the performance of the tourist sector.
Keywords: Productivity Measurement ; Mean-Variance ; Tourism
Efficiency ; Efficiency Decomposition ; Utility Function ; Nord
Pas-de-Calais.
2
1. Introduction
Tourism is an important Industry in the French region of Nord
Pas-de-Calais (NPDC). Given its favourable location in the heart of North-East
Europe, in the middle of London-Paris-Brussels triangle, NPDC receives
over 175 million trips per year. In order to take full advantage of this
industry to strengthen the local economy, actions are being implemented
to further develop regional tourism. The Eurostar and Thalys high-speed train make Lille, the capital of NPDC ever closer to London and Brussels.
Development of Lille Airport connect the region to other major markets
such as Barcelona, which is now only two hours away by flight even more
accessible. .
In terms of employment, tourism generated an average of nearly 39,000
salaried jobs in 2009 for the NPDC, representing an increase of 16 %
compared to 2003. This job places creation allows NPDC to rank only ninth
at regional level. However, compared to the national average which is 4.8%,
the tourism employment represents only 2.7% of salaried jobs in this
region1. In terms of tax revenue, tourism is a springboard for the economy of the region. Indeed, tourism and leisure represent 3.30% of regional GDP
in 2009, equivalent to the compulsory residence permit paid by the locals
and amounting to 3.5 million euros. Nevertheless, the economic
contribution from the tourism sector in this region is lower than the average
French level as tourism represents more than 6.5% of the national GDP.
There is room for improving the efficiency of the tourism industry of in
order to increase the economic contribution of the sector of tourism in this
region of France. The region Nord Pas-de-Calais represents only 0.2% of
the total national investment in tourism. The local authorities have
understood the economic potential from tourism. Since the beginning of
3 the 2000s, the local authorities had invested in the organization of different
business events. More than 55% of tourists are professional customers. The
advantage of this strategy is to develop new opportunities of market. If the
British is the first foreign market, the local authorities expect to attract
another nationalities with the centenary of the 1st World War (Canadian, American and Australian soldiers were present in this region just as well
as Chinese workers) and the 70th birthday of the end of the 2nd World War. The geographic localization of the NPDC region can also provide another
advantage if it is well exploited.
Authors such as Barros (2004), Barros et al., (2011) and Assaf (2012) have developed efficiency measurement of tourism industry. But very few
works have been done on the efficiency measurement following origins of
tourists. A viable and resilient tourism destination should try to maximize
the number of tourists come from different origins, and minimize the
instabilities in revenues by diversifying its market mix (Kennedy, 1998).
The efficiency following the tourist’s origins is one of the essential questions to understand the composition and characteristics of the local
tourism industry. In order to answer this question, the performance
evaluation (in terms of possible revenue augmentation and/or possible risk
contraction) of inbound tourist is valuable and necessary. The result of this
kind of analysis can guide the policy makers by giving them the accurate
efficiency indicators for future decision-making process.
The aim of the current paper is to introduce a nonparametric efficiency
measurement framework into a mean-variance space, in order to evaluate
the performance of tourism sector and identify the possible source of the
existing inefficiency. The contribution of this paper is two-fold. First it
improves the existing measures of efficiency by introducing the decision
4 proposes a framework for the evaluation of destination performance which
can assist Destination Management Organizations (DMO) in enhancing the performance of the industry.
The paper is organized as follows: section 2 critically reviews the
existing literature on the measurement the tourism efficiency; section 3
presents our theoretical framework; in section 4, data from NPDC is
analyzed using mean-variance method. The paper ends by a discussion of
the results and develops a framework for policy makers. .
2. Efficiency measurement in tourism
The performance of a firm, particularly as measured by productivity and
efficiency, has been a common subject in tourism studies. The hotel sector
has attracted the most attentions, followed by travel agents and restaurants.
The empirical literature on the effectiveness of the tourism business has
been dominated by the non-parametric approach: Data Envelopment
Analysis (DEA; Seiford, 1996).
The first effort of applying DEA to tourism begins in the year 80s.
Hruschka (1986a) measured then different Australian restaurant groups
and found that there exists difference efficiency among these groups.
Banker and Morey (1986b) who introduced quasi-fixed variables in DEA,
evaluated the technical and scale efficiency of 60 fast food restaurants with
discretional variables. Morey and Dittman (1995) evaluated the
performance of 54 hotels of a national chain in the U.S, and found these
hotels were quite efficient, with an efficient score of 0.89. More recent
applications include Anderson, Fok and Scott (2000), Hwang and Chang
(2003), Barros and Alves (2004), Daniels (2004), Chiang, Tsai and Wang
(2004), Barros (2005), Barros and Santos (2006), Köksal and Aksu (2007),
5 studied the tourism sector at a territory level: Bosetti et al. (2006), Peypoch (2007), Barros et al. (2011) and these papers have used basic DEA model (CCR for Charnes et al. (1978) model and/or BCC for Banker et al. (1984)
model) as theoretical framework. And only two papers (Botti et al., 2009; Ratsimbanierana et al., 2013) make an efficiency assessment of regions with a directional distance function (DDF – Chambers et al., 1998).
In his paper, theoretical framework applies a nonparametric efficiency
measurement, and uses DDF in a mean-variance space to calculate an
overall efficiency (OE) indicator, which can be decomposed into a
technical efficiency (TE) indicator and an allocative efficiency (AE)
indicator. The advantage of this technique is that with consideration of
utility function in a Mean-Variance space, we can find out more precisely
the source of the inefficiency, thus propose a more appropriate suggestion
to the policy decision maker.
To the author’s knowledge, there are only two articles (Botti et al., 2012; Ratsimbanierana et al., 2013), which used DDF in a mean-variance framework to measure the destination efficiency according to tourist
origins. However, these papers have just measured the technical efficiency
and did not attempt to find other kind of inefficiencies in the tourism sector.
The next sections of this present article fill this gap in the literature.
3. Theoretical Framework
Scarcity of resource and ever growing needs for justifying investment
has lead to more and more emphasis being laid on the analysis of the
relationship between resources allocation and their economic return. For a
given country or region, ways to minimize the instability and maximizing
the return of their inbound tourism with consideration of utility function
are very important issues for the policy decision makers (Kennedy, 1998;
6 investment theory. Therefore, the mean-variance space seems a suitable
framework in our case.
3.1 Efficient frontier and portfolio management
Consider n funds with a return vectorR( ,R R1 2,...,Rn) ', each fund is then characterized by an expected return E R( )i and a varianceV R( )i , where
1, 2,...,
i n. Then the expected return vector and the variance vector can be
written separately by E R( )
E R E R( 1), ( 2),..., (E Rn) '
and
1 2
( ) ( ), ( ),..., ( n) '
V R V R V R V R . Then the covariance matrix of these funds
can be written by ij COVA R R( ,i j) , where i1, 2,...,n and j1,2,...,n .
Then we can define a portfolioX , which is composed by these n funds, with the vector x( ,x x1 2,... )xn , i 1
i
x
indicate the weight of each fund.The return of portfolio X is R(X)=xR. The expected return and its
variance can be calculated as follows:
( )
( )E R X xE R (1)
( )
ij 'V R X x x (2)
If all the constraints faced by the investors for each funds can be written
by a linear function of the fund’s weight, then the set of possible portfolio
is defined as:
, 1, ' , 0
n i i
x R x Ax b x
(3)Then the Markowitz mean-variance space is defined as:
V X E X( ), ( ) ;x
(4)
But from a mathematical point of view, this representation cannot be
used directly for quadratic programming (see Briec, Kerstens, and Lesourd
(2004)). The above set is then extended by defining a portfolio
7
( ', ')V E R R x; ,( V E', ') V X E X( ), ( )
(5)
Then the efficiency frontier is defined as:
( ) , ( ) ; ( ) , ( ) ( ', ') ( ', ')V R X E R X
x V R X E R X V E V E
(6)
This frontier represents the set of all the mean-variance points that are
not strictly dominated in the two-dimensional space.
3.2 Markowitz efficiency frontier
Markowitz defines an optimization program to determine the portfolio
corresponding to a given degree of risk aversion. This portfolio maximizes
a mean-variance utility function defined by:
( , )
U E R x V R x (7)
where 0and 0 represent separately the marginal utility for the
investors for the expected return and risk. The ratio f =r
m traditionally
represents investors’ risk aversion. The quadratic program is written as:
* ( , )
1,...,
sup ( ) ( )
. . ' b 1
0 i i n
U E R x V R x
s t Ax x x
(8)So given the investors’ risk aversion, this program allows one to choose an “optimal” portfolio in the efficiency frontier, which can maximize their utility function. Following Uysal, Trainer, and Reiss (2001), the
conventional values for risk aversion f = r
8 In this article, 2 (with r =2 and m =1 ) is used3 according to Morey
and Morey (1999) and Briec et al. (2004).
3.3 Efficiency measurement
The efficiency measurement of a set of decision units (or a portfolio for
the Markowitz model) consists in roughly enveloping the data and then
measuring the distance between the realized performance of each unit
(each portfolio in the Markowitz model) and this estimated frontier. This
gap between the unit and the frontier is defined as inefficiency. In fact, the
technology is represented by the frontier between feasible and infeasible
productions. The frontier itself is important as it contains all the relevant
information about marginal productivity, elasticity of substitution and
returns to scale; it is not directly observable and must then be estimated.
The characterization of the frontier rests on an axiom that provides some
indication on expectations from the frontier. This paper proposes to use a
directional distance function to measure the inefficiency. The directional
distance function measures the distance between the observation and the
efficient frontier along a chosen directional vector pre-chosen. This idea
was introduced by Luenberger (1992) and has been used in several sectors:
Briec et al. (2004) and Briec et al. (2007) suggest an application in the financial sector, as did Peypoch and Solonandrasana (2006) and Peypoch
(2007). Botti et al. (2012), and Ratsimbanierana et al. (2013) have already applied DDF in a Mean-Variance framework. However, as we explain at
the end of this section, they just measured the technical efficiency in their
papers and did not try to find other kind of inefficiency for the tourism
sector.
3 A robustness check of our results by testing different values of risk aversion will be presented in the
9 Following the demonstration of Briec, Kerstens, and Lesourd (2004), the
directional distance efficiency measurement function is defined as:
( ) sup ; ( ) , ( )
g V E
S x V R x g E R x g (9)
The DDF seeks the greatest possible risk (variance) contraction in the
negative direction vector gV in order to obtain the maximum attainable expansion of expected return in the positive direction gE.
In summary, this function measures the potential improvement in term
of the possible increase in expected return and reduction in variance for a
given direction vector g ( g gV, E) . The advantage of this method compared to the classical DEA model is the possibility to control the
projection direction of the inefficient points to the efficient frontier. Morey
and Morey (1999) already introduced the DEA model in portfolio
efficiency measurement. But their model had two specific perspectives:
maximize the expected return for a fixed variance, or minimize the risk for
a given expected return. As we can see, their model is just a specific case
of the DDF approach (with gV 0 or gE 0). In fact, in their paper, they
just used a Shephard’s distance function, which is commonly used in the
classic DEA models. Among other differences between these two functions
(see Färe and Grosskopf, 2000 for detail), one difference is DDF has an
additive structure while the other ones are additive by nature.
For the policy makers, not only evaluating the performance of their
sector is necessary, but also knowing the sources of its inefficiency is
equally or even more important. Here the distinction between allocative,
and technical efficiency is proposed when evaluating the scope for
improvements of tourism strategies. OE indicator measures the distance
between the maximum utility that the portfolio can reach and the current
utility for one portfolio normalized by the directional vector. This idea is
10 proposed by Chambers et al. (1998b) is followed to calculate this indicator,
which allows us to a dual relationship between the Markowitz utility
function and the DDF.
For a chosen risk aversion parameters ( , ), the maximum utility
function is defined as U*
(r ,m )³ m E R
( )
(x) - r V R( )
(x) for x. This impliesthat the efficient utility is no less than the value of the feasible
mean-variance vector. Thus, for the portfolio k, we have the relation:
* , k E V E VU E R x g V R x g
E R x V R x g g
(10)
This function establishes the relationship between portfolio k’s utility function *
, k
U and the DDF. This relation can also be interpreted as the one
portfolio’s maximal utility is greater than or at least equal to the actual or observed utility, plus the gain in utility resulting from reductions in
technical inefficiency. And we have:
* ,
( , ) (x) gE gV
U U Max
(11)
From the portfolio’sspecific utility function established earlier it can be observed, after the necessary re-arrangement, that a portfolio’s utility efficiency or so we called OE in general can be expressed as:
*
( , ) (x) gE gV
U U
(12)
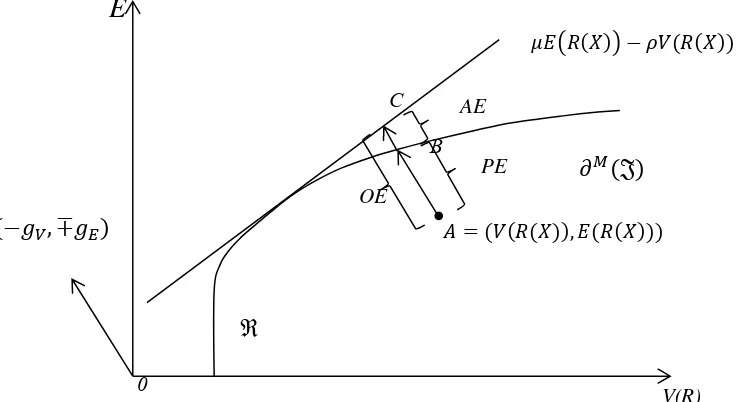
The above inequality is explained by the possible presence of inefficient
allocation of resources even when all technical inefficiencies are
eliminated, like point B in the figure 1. While it is technically efficient for
being on the efficient frontier; it is not overall efficient. The presence of
inefficient resource allocation in portfolio B is a possible source of its profit inefficiency. The inequality is thus closed when the allocative inefficiency
11 means that the allocative inefficiency is residually determined from the
Nerlovian profit and technical inefficiencies. It should be observed that the elimination of technical and allocative inefficiencies is expected, all else
remaining constant, to achieve full efficiency. The equality between the
utility, technical, and allocative efficiencies is given by the following
expression: *
( , ) (x)
(x) gE gV
U U
AE
(13)
Then the Overall efficiency (OE) is calculated as:
OE(x,r ,m )= U*
(m ,r )- U(x)
(
)
(
m gE+r gV)
(14)Portfolio efficiency indicator (PE) it is called technical efficiency (TE),
as in Briec et al. (2007) and is calculated by:
( ) g(x)
PE x S (15)
This indicator measures the possible improvement of a portfolio by
projecting it to the efficiency frontier. But it cannot guarantee that the
corresponded point on the frontier can maximize the utility function;
therefore, this indicator just reflects the technical efficiency.
Allocative efficiency (AE) indicator is calculated:
(x) ( , , ) ( )
AE OE x PE x (16)
The difference between the OE and PE gives us an idea about the
allocation of resources to funds, taking into account decision maker’s preferences. For the production theory, the allocative inefficiency arises
from the provision of services in the wrong mix, give their prices, which
means the manager has rooms to combine inputs and/or outputs in a better
proportions in light of prevailing prices. For the tourism portfolio
perspective, it means given the destination’s preference of risk, we can change the combinaisons of origins to improve destinations’
overall efficiency. If AE is not equals to zero, we have to move the
12 regards prioritization of objectives by the policy maker. The idea is
presented in figure 1 and the specification of this function is presented in
the next section.
In their paper, Botti et al. (2012) did not take the utility function (presented by the tangent line in Figure 1) into consideration. Therefore, they
estimated the efficient frontier in their paper, and calculated PE. By
calculating the optimal utility function, our framework is able to estimate
the technical efficiency for the tourist origins and assess the possible
improvement of decision maker‘s utility for each origin. The improvement in utility can be further decomposed into technical efficiency improvement
and allocative efficiency improvement.
3.4 Statistic model
This sub-section presents the statistic model used to calculate OE, PE
and AE. In accordance with the non-parametric efficiency measurement
theory, the best practical observable points are taken as benchmarks. The
definition in Equation 8, leads to the following quadratic program in order
to calculate the technical efficiency oPE for the objective origin Ro : E
0 V(R)
𝐴 = (𝑉(𝑅(𝑋)), 𝐸(𝑅(𝑋))) B
C
𝜇𝐸 𝑅(𝑋) − 𝜌𝑉(𝑅(𝑋))
AE
PE
OE 𝜕
𝑀(𝔍)
ℜ
[image:13.595.111.479.168.369.2](−𝑔𝑉, ∓𝑔𝐸)
13 1,..., max . . ( ) ( ) ' 1 0 PE o PE o o E
PE
o o V ij i
i n
s t E R g xE R
V R g x x
x x
(17)The overall efficiencyoOE is calculated in a 3 steps procedure:
1- Equation (8) is used to obtain * ( , )
U
,
2- Equation (14) to obtain oOE, and finally
3- The allocative efficiency oAEis calculated as follow:
AE OE PE
o o o
(18)
For n origins, we have to repeat n times this process.
It is clear that the risk related parameters (, ) will influence the slope
of the utility function. Therefore, oOE is variant with and . However,
since the calculation of OE is not directly related to risk aversion, oPE
should remain invariant to these parameters. As we mentioned above, a
robust test of our results by testing different values of risk aversion will be
presented at the end of the empirical section of this paper.
4. An application to Nord Pas-de-Calais (France)
Instead of using the price of funds as in the traditional financial
investment theory, we have to choose a variable, which can represent the
value of inbound tourists for the concerned local economy. In the tourism
industry, it’s not the number of visitors’ arrival, which is the most important element for an economy. The expenditure of tourists is a more
proper variable to evaluate the contribution of tourism to an economy.
However, in our case, only the overnight stays data are available. This
variable is commonly used in the literature (see for example Peypoch, 2007
14
stay in a “one star” hotel will normally spend less than a tourist who chose to stay in “five star” hotel. The database for NPDC, includes data on average hotel price of different categories (null and 1 star, 2 star, 3 and 4
star) for 2013, and the number of overnight stays for tourists from different
origins in different category hotels. Therefore, monthly data of the
overnight stays from 16 different countries is weighted by their hotel rates
to take into account different expenditure level. This variable will be used
as a proxy of the value of inbound tourist for NPDC. Risk and return are
calculated over a 7 years horizon between 2006-2012. The statistical
description of our data is presented in table 1. Table 2 presents the average
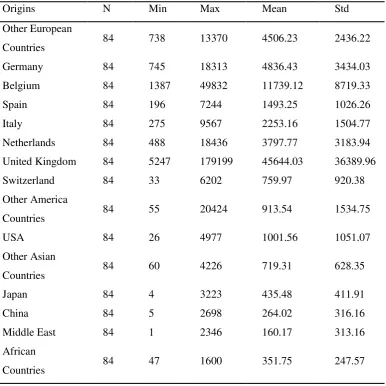
15 Table 1
[image:16.595.93.480.121.507.2]Statistical description of NPDC tourists monthly overnight stays between 2006 and 2012
Table 2
Average price for hotels category in NPDC
Average price (euro) for peak season (May, June, July, August)
Average price (euro) for normal season
Null and 1 star 48,4444 43,4091
2 star 78,0056 63,7955
3 and 4 star 124,6173 96,0125
Origins N Min Max Mean Std
Other European
Countries 84 738 13370 4506.23 2436.22
Germany 84 745 18313 4836.43 3434.03
Belgium 84 1387 49832 11739.12 8719.33
Spain 84 196 7244 1493.25 1026.26
Italy 84 275 9567 2253.16 1504.77
Netherlands 84 488 18436 3797.77 3183.94
United Kingdom 84 5247 179199 45644.03 36389.96
Switzerland 84 33 6202 759.97 920.38
Other America
Countries 84 55 20424 913.54 1534.75
USA 84 26 4977 1001.56 1051.07
Other Asian
Countries 84 60 4226 719.31 628.35
Japan 84 4 3223 435.48 411.91
China 84 5 2698 264.02 316.16
Middle East 84 1 2346 160.17 313.16
African
[image:16.595.88.516.551.650.2]16 In this paper, we have used a Matlab program written by ourselves to
run the estimation and produce the graphics. The results are presented in
the following Tables (Table 3 to Table 6). As aforementioned, there are
three models:
1. Model 1 maximizes the expected return for a fixed variance;
2. Model 2 minimizes the risk for a given expected return;
3. Model 3 maximizes the expected return and minimizes the risk for a
pre-chosen direction (withg
V E,
) and therefore identifies the inefficiencylevel.
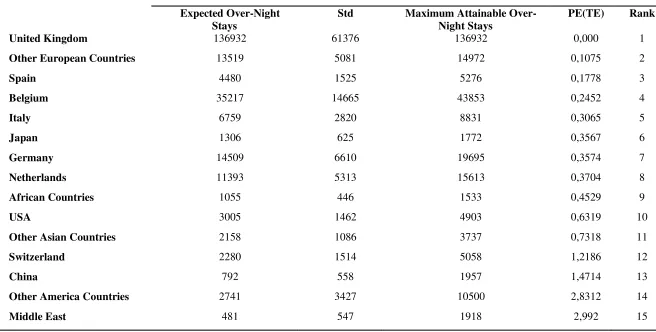
Table 3 demonstrates the results of the mean-augmentation approach
(Model 1). Column 2 and 3 shows origins expected overnight stays and
standard deviation for the year 2013. Column 4 shows the maximum
attainable overnight stays for each origin, Column 5 shows the technical
efficiency and the last column gives the rank of each origin according to
its performance. For example, for next year, for the given risk level and
optimal portfolio weights, NPDC can expect a maximum 43,853 overnight
stays from Belgium, being an increase of 24.52% compared to the past.
Meantime, this increase can be as high as 63.19% for USA,which means
that USA as a tourist origin places further from the efficient frontier than
Belgium. Therefore, USA performs worse than Belgium in the tourist
portfolio of NPDC. Table 4 displays the risk-contraction approach (Model
2). As for Belgium, for the same level of overnight stays, NPDC can reduce
the risk, so the average volatility of tourism expenditures, from this origin
by 22.9%.
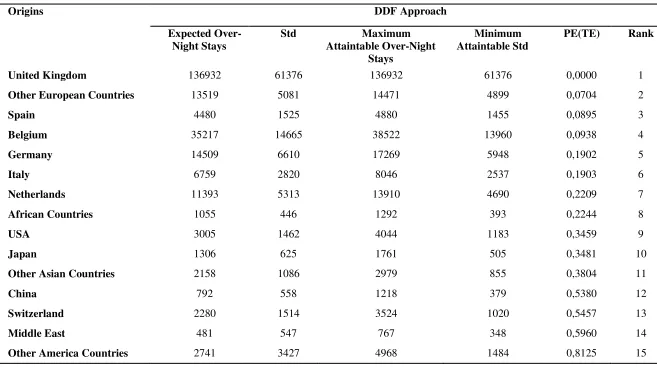
However, if NPDC seeks to rise the overnight stays and at the same time
reduce the risk, then the results of DDF approach presented in Table 5
should be considered (Model 3). Taking Belgium for example, for the year
17 standard deviation of 14,665. But according to the results of our model,
NPDC should be able to attract 38,522 overnight stays with a risk level of
13,960; it means NPDC could at the same time improve the return and
reduce the instability of Belgium tourists by 9.4%.
For these three models, the UK is the most efficient origin and therefore
severs as the benchmark for all the other origins. This can be explained by
its geographic localization since the EUROSTAR train line and The
Channel Tunnel link the UK and NPDC. The historical and cultural links
shared between UK and NPDC is also explanation of this fact. The same
explanation can be applied to Belgium. As the middle point between Paris
and Brussels, it is not surprising that tourist from Belgium performs very
well for NPDC. As for Spain and Italy, their good performance can be
explained by the fact that firstly, there is lots of Spanish and Italian former
immigrants in the region since the 19th and 20th centuries, lots of family reunion occurs in NPDC; secondly, as a European country, tourists from
these two countries know well the tourist monuments and culture attraction
in NPDC. As for the tourists from USA, China and Japan, NPDC is just a
stop over to visit Paris, Brussels, Amsterdam or Luxembourg. And since
the tourists from these countries traditionally do not know the region very
well, so the poor performance of these markets is not surprising. This result
is very interesting, since in the paper Botti et al. (2012), the authors found USA is quite efficient to France, here the explanation is once more the
American tourists who enjoy Paris and other more popular French
destinations, may not be familiar with the tourism products of the NPDC.
The region NPDC played a prominent role during the First World War.
At any given moment, every community in the Pas-de-Calais had, to a
greater or lesser extent, an involvement in the war and considered as a
microcosm of the world at war. Therefore, local public authorities of
18
Tourism” to commemorate the beginning of the 100th anniversary of the First World War to show case its products to Northern American and
Chinese tourists.
As we can see in Table 6, the average performance of the origins is poor.
According to the average overall inefficiency score, NPDC can improve
86.53% of its utility obtained in the tourist sector for the given utility
function. And the decomposition results show that among these potential
utility improvements, 30.97% comes from technical inefficiency and 55.55%
comes from allocative inefficiency. There is no origin perfectly satisfy
NPDC’s preference (The most efficient is the African countries, with an OE equals to 39.17%). This result means besides the possible return
augmentation and risk contraction, the wrong choice of values of risk
aversion is the main source of inefficiency for the region. In order to
improve the allocative efficiency, NPDC should guide their tourist policy
to change the combination of return and risk for these origins according to
region’s own preference (utility function). Once all the origins achieve the efficient frontier, NPDC need to move these origins along the frontier to
reach the tangent point (maximum utility for NPDC). Optimal portfolio
share (PS) for each origin, which allows NPDC to achieve its maximum
utility ( *
240903
U ) is also reported in Table 6.
Results of DDF approach and efficiency decomposition are also
illustrated in Figure 2, 3 and 4 in the appendix. Figure 2 and Figure 3
present each origin in the mean-variance space and their projection on the
efficient frontier. Figure 3 is obtained by omitting England, which is
behaving as an outlier from the sample to present a clear representation of
the framework. To illustrate the decomposition analysis, the Figure 4
proposes an utility function characterized by a risk aversion equal to 0.01,
few origins and the optimal portfolio (in terms of OE). Shares of origins
19 (which represent China and African countries) are very close to the utility
function which corresponds to decomposition results in Table 8 ; the AE
for these two origins is not far away from null (0.0063 for China, and
0.0191 for African countries).
One potential issue is the sensitivity of our decomposition result since
importance of OE and AE is related to the risk aversion . In order to test
the robustness of our result, computed the OE, AE for a large range of
were computed Since according to the literature the conventional value
should range between 0.5 and 10, Figure 5 shows the decomposition of the
[image:20.595.101.502.328.599.2]average efficiency for 1 and
0.01 10
. The detail result will be showed in table 7.Fig. 5. Evaluation of overall efficiency decomposition for a range of risk aversion
Even as the risk aversion changes, the relative importance of OE, PE and
AE remains the same for NPDC. The main resource of inefficiency always
comes from AE. This result shows that our conclusion is robust to the
different value of .
0 0,1 0,2 0,3 0,4 0,5 0,6 0,7 0,8 0,9 1 0 ,0 1 0 ,0 5 0 ,1 0 ,2 0 ,3 0 ,4 0 ,5 0 ,6 0 ,7 0 ,8 0
,9 1 2 3 4 5 6 7 8 9 10
rho/mu
OE
TE
20
5. Conclusion and Future Research
Efficiency analysis is attracting more and more attention in tourism
economic research. The traditional method is data envelopment analysis
applied to hotels and restaurants. Researchers often neglect the competition
among tourism destinations and the heterogeneity between different tourist
origins4. In this paper, the model introduced by Botti et al. (2012) is augmented by the inclusion of a utility function which allows for the
measurement of not only tourism efficiency by origins but also
identification of inefficiency in resource allocation. By relating the
Markowitz’s Mean-Variance framework and non-parametric frontier estimation method, policy makers are provided with accurate performance
indicators for future strategic decision.
Our empirical results clearly show that NPDC has loads to do to improve
the performance in tourism sector. The number of overnight stays
generated by the tourists neighboring countries (England, Belgium, Spain,
Italy) are quite efficient, however, NPDC has to improve its marketing
strategies to the market outside of Europe (China, Japan, USA, etc.). The
main source of utility inefficiency for NPDC comes from AE, which means
the wrong choice of risk and return of the origins, therefore, by applying
certain promotion policy (pubs, discount, etc), NPDC can change the
proportion of origin’s return and variance and try to maximize its
preference. Lastly, this region contains many historic and cultural tourism
capitals (as Braderie de Lille, Louvre-Lens, Piscine of Roubaix, Fine Art
Museum of Lille, Nausicaà, Memorial of Helfaut, etc.), which can provide
new sources of tourism receipts if they are well exploited.
4 Even we can use two stage DEA model to identify the influence of tourist nationalities on tourism
21 This kind of methodology can be very useful for territories which have
a need to develop their international tourism market and which are
characterized by a strong proportion of internal tourism (as NPDC). It is
well known in tourism that the international market can provide a better
economic contribution than the local market but all the marketing strategies,
according to the nationality aimed, are not always efficient.
The other advantage of this methodology is to provide some crucial
information about the power of attraction for a given destination according
to the tourist’s country of origin. A gravitational model, by using bilateral data, gives some important descriptions about this power of attraction. But,
the method developed in this present paper provides a new source of
information: the potential of output that can be expected and the risk
associated. An interesting further research can be to combine these two
methodologies (gravitational model and mean-variance analysis) and
comparing the different results in order to understand how the international
tourism marketing strategy developed by the local authorities can be
improved. And another research line reports to the vector x introduced in
the theoretical framework of this paper. It should be interesting for policy
decision makers to know the composition of this vector i.e. the weight of
22 Table 3
Results of mean Augmentation Approach
Origins Mean Augmentation Approach
Expected Over-Night Stays
Std Maximum Attainable Over-Night Stays
PE(TE) Rank
United Kingdom 136932 61376 136932 0,000 1
Other European Countries 13519 5081 14972 0,1075 2
Spain 4480 1525 5276 0,1778 3
Belgium 35217 14665 43853 0,2452 4
Italy 6759 2820 8831 0,3065 5
Japan 1306 625 1772 0,3567 6
Germany 14509 6610 19695 0,3574 7
Netherlands 11393 5313 15613 0,3704 8
African Countries 1055 446 1533 0,4529 9
USA 3005 1462 4903 0,6319 10
Other Asian Countries 2158 1086 3737 0,7318 11
Switzerland 2280 1514 5058 1,2186 12
China 792 558 1957 1,4714 13
Other America Countries 2741 3427 10500 2,8312 14
23
Table 4
Results of risk contraction approach
Origins Risk Contraction Approach
Expected Over-Night Stays
Std Minimum Attainable Std
PE(TE) Rank
United Kingdom 136932 61376 61376 0 1
Other European Countries 13519 5081 4544 0,2004 2
Belgium 35217 14665 12877 0,229 3
Spain 4480 1525 1323 0,2467 4
African Countries 1055 446 354 0,3716 5
Germany 14509 6610 4913 0,4475 6
Italy 6759 2820 2091 0,45 7
Netherlands 11393 5313 3755 0,5004 8
Middle East 481 547 348 0,596 9
Japan 1306 625 396 0,5988 10
China 792 558 348 0,6115 11
USA 3005 1462 863 0,652 12
Other Asian Countries 2158 1086 614 0,6804 13
Switzerland 2280 1514 649 0,8163 14
24
Table 5
Results of mean augmentation and risk contraction approach
Origins DDF Approach
Expected Over-Night Stays
Std Maximum
Attaintable Over-Night Stays
Minimum Attaintable Std
PE(TE) Rank
United Kingdom 136932 61376 136932 61376 0,0000 1
Other European Countries 13519 5081 14471 4899 0,0704 2
Spain 4480 1525 4880 1455 0,0895 3
Belgium 35217 14665 38522 13960 0,0938 4
Germany 14509 6610 17269 5948 0,1902 5
Italy 6759 2820 8046 2537 0,1903 6
Netherlands 11393 5313 13910 4690 0,2209 7
African Countries 1055 446 1292 393 0,2244 8
USA 3005 1462 4044 1183 0,3459 9
Japan 1306 625 1761 505 0,3481 10
Other Asian Countries 2158 1086 2979 855 0,3804 11
China 792 558 1218 379 0,5380 12
Switzerland 2280 1514 3524 1020 0,5457 13
Middle East 481 547 767 348 0,5960 14
25
Table 6
Decomposition of efficiency score for DDF approach
OE PE(TE) AE PS
Other European
Countries 0,9948 0,0704 0,9244 0.00000
Germany 0,9969 0,1902 0,8067 0.00000
Belgium 0,9993 0,0938 0,9055 0.00000
Spain 0,9463 0,0895 0,8568 0.00000
Italy 0,9840 0,1903 0,7937 0.00000
Netherlands 0,9953 0,2209 0,7744 0.00000
United Kingdom 0,9999 0,0000 0,9999 0.00000
Switzerland 0,9465 0,5457 0,4008 0.00000
Other America
Countries 0,9895 0,8125 0,1770 0.00053
USA 0,9423 0,3459 0,5965 0.00000
Other Asian Countries 0,8961 0,3804 0,5157 0.00000
Japan 0,6889 0,3481 0,3408 0.23423
China 0,6110 0,5380 0,0729 0.24089
Middle East 0,5963 0,5960 0,0003 0.16720
African Countries 0,3917 0,2244 0,1673 0.35716
Mean 0,8653 0,3097 0,5555 *
240903
26
Table 7
Robust test for the sensibility of OE decomposition
rho/mu OE PE(TE) AE
0,01 0,755396 0,309748 0,445649
0,05 0,839618 0,309748 0,529870
0,1 0,852454 0,309748 0,542707
0,2 0,859117 0,309748 0,549369
0,3 0,861376 0,309748 0,551628
0,4 0,862513 0,309748 0,552765
0,5 0,863198 0,309748 0,553450
0,6 0,863655 0,309748 0,553907
0,7 0,863982 0,309748 0,554234
0,8 0,864228 0,309748 0,554480
0,9 0,864419 0,309748 0,554671
1 0,864572 0,309748 0,554824
2 0,865262 0,309748 0,555514
3 0,865492 0,309748 0,555744
4 0,865607 0,309748 0,555859
5 0,865676 0,309748 0,555929
6 0,865722 0,309748 0,555975
7 0,865755 0,309748 0,556008
8 0,865780 0,309748 0,556032
9 0,865799 0,309748 0,556052
27
[image:28.595.121.487.109.696.2]Appendix
Fig. 2. Origins and their projection on the frontier
[image:28.595.138.486.415.672.2]29 Table 8
Decomposition of efficiency score for DDF approach, with risk aversion 0.01
Origins OE PE(TE) AE PS
Other European
Countries 0.8998 0.0704 0.8293 0.00000
Germany 0.9353 0.1902 0.7450 0.00000
Belgium 0.9677 0.0938 0.8739 0.00000
Spain 0.6698 0.0895 0.5803 0.00000
Italy 0.8410 0.1903 0.6507 0.00000
Netherlands 0.9217 0.2209 0.7008 0.00000
United Kingdom 0.9928 0.0000 0.9928 0.00000
Switzerland 0.8113 0.5457 0.2656 0.00000
Other America
Countries 0.9528 0.8125 0.1402 0.00934
USA 0.7456 0.3459 0.3998 0.00000
Other Asian Countries 0.6767 0.3804 0.2963 0.00737
Japan 0.4615 0.3481 0.1134 0.26922
China 0.5444 0.5380 0.0063 0.20750
Middle East 0.6672 0.5960 0.0712 0.01597
African Countries 0.2435 0.2244 0.0191 0.49059
Mean
0.7554 0.3097 0.4456
*
38998.5
30
References
Anderson, R. I., Fok, R., and Scott, J. (2000). "Hotel industry efficiency: an advanced linear programming examination". American Business Review, 18(1), 40-48.
Assaf, A., Barros, C.P. and Machado, L.P. (2011). "The future outlook for Portuguese travel agents". Tourism Economics, 17(2), 405-423.
Assaf, A.G. (2012) "Benchmarking the Asia Pacific tourism industry: a Bayesian combination of DEA and stochastic frontier". Tourism Management, 33(5), 1122–1127.
Banker, R.D., Charnes, A. and Cooper, W.W. (1984). "Some Models for Estimating Technical and Scale Inefficiencies in Data Envelopment Analysis". Management Science, 30, 1078-1092.
Banker, R. D., and Morey, R. C. (1986). "Efficiency analysis for exogenously fixed inputs and outputs". Operations Research, 34(4), 513-521.
Barros, C. P. (2004). "A Stochastic Cost Frontier in the Portuguese Hotel Industry". Tourism Economics, 10(2), 177-192.
Barros, C. P., and Alves, F. P. (2004). "Productivity in the tourism industry". International Advances in Economic Research, 10(3), 215-225.
Barros, C. P., and Santos, C. (2006). "The measurement of efficiency in Portuguese hotels using Data Envelopment Analysis". Journal of Hospitality and Tourism Research, 30(3), 378–400.
Barros, C.P., Botti, L., Peypoch, N., Robinot, E., Solonandrasana, B. and Assaf, A.G. (2011) "Performance of French destinations: Tourism attraction perspectives". Tourism Management, 32(1), 141-146.
Bosetti, V., Cassinelli, M. and Lanza, A. (2006). "Benchmarking in tourism destination, keeping in mind the sustainable paradigm". Nota di Lavoro 12.2006, Fondazione Eni Enrico Mattei.
Botti, L., Peypoch, N., Robinot, E. and Solonandrasana, B. (2009). "Tourism Destination Competitiveness: the French regions case".
European Journal of Tourism Research, 2, 5-24.
Botti, L., Goncalves, O., and Ratsimbanierana. H. (2012). "French Destination Efficiency: A Mean-Variance Approach". Journal of Travel Research, 51(2), 115-129.
31 Briec, W., Kerstens, K. and Lesourd. J. B. (2004). "Single Period Markowitz Portfolio Selection, Performance Gauging and Duality: A Variation on the Luenberger Shortage Function". Journal of Optimization Theory and Applications, 120(1), 1-27.
Briec, W., Kerstens, K. and Jokung, O. (2007). "Mean-Variance- Skewness Portfolio Performance Gauging: A General Shortage Function and Dual Approach". Management Science, 53(1), 135-49.
Charnes, A., Cooper, W.W. and Rhodes, E. (1978). "Measuring the efficiency of decision making units". European Journal of Operational Research, 2(6), 49-444.
Chambers, R.G, Chung, Y. and Färe, R. (1998). "Profit, directional distance functions, and Nerlovian efficiency". Journal of Optimization Theory and Applications, 98, 351–364.
Chiang, W., Tsai, M., and Wang, L. S. (2004). "A DEA evaluation of Taipei hotels". Annals of Tourism Research, 31(3), 712-715.
Daniels, M. J. (2004). "Beyond Input-Output Analysis: Using Occupation-Based Modeling to Estimate Wages Generated by a Sport Tourism Event". Journal of Travel Research, 43(1), 75.
Färe, R., and S. Grosskopf. (2000). "Theory and Application of Directional Distance Functions". Journal of Productivity Analysis, 13, 93-103.
Hwang, S. N., & Chang, T. Y. (2003). "Using Data Envelopment
Analysis to Measure Hotel Managerial Efficiency Change in Taïwan".
Tourim Management, 24(4), 357-369.
Hruschka, H. (1986). "Ansätze der Effizienmessung von Betrieben". Journal für Betriebswirtschaft, 36(2), 76-85.
Kennedy, V. (1998). "Risk Management in the Irish Tourism Industry: The contribution of a Portfolio Investment Approach". Tourism Management, 19(2), 119-126.
Köksal, C. D., and Aksu, A. A. (2007). "Efficiency evaluation of A-group travel agencies with data envelopment analysis (DEA): A case study in the Antalya region, Turkey". Tourism Management, 28(3), 830–834.
Luenberger, D. G. (1992). "Benefit Function and Duality". Journal of
Mathematical Economics, 21, 461-81.
Markowitz, H. (1952). "Portfolio Selection". Journal of Finance, 7, 77-91.
32
Morey, R. C. and Dittman, D. A. (1995). "Evaluating a hotel GM’s
performance: a case study in benchmarking". Cornell Hotel Restaurant & Administration Quarterly, 36(5), 30–35.
Morey, M. R., and Morey, R. C. (1999). "Mutual Fund Performance Appraisals: A Multi-Horizon Perspective with Endogenous Benchmarking". Omega, 27, 241-58.
Perrigot R., Cliquet G. and Piot-Lepetit I. (2009), "Plural form Chain and Efficiency: Insights from the French Hotel Chains and the DEA Methodology". European Management Journal, 27, 268-280.
Peypoch, N. and Solonandrasana, B. (2006). "A Note on Technical Efficiency in Tourism Industry". Tourism Economics, 12(4), 653-57.
Peypoch, N. (2007). "On Measuring Tourism Productivity". Asia Pacific Journal of Tourism Research, 12(3), 237-44.
Peypoch, N. (2007). "Productivité du Secteur Touristique Français : Une comparaison inter-régionale". Économie et Prévision, Programme National Persée, 177(1), 65-76.
Ratsimbanierana, H., Sbai, S. and Stenger, A. (2013). "Moroccan tourist portfolio efficiency with the mean-variance approach". European Journal of Tourism Research, 6(2), 122-131.
Seiford, L. M. (1996). "Data Envelopment Analysis: The Evolution of the State of the Art (1978–1995)". Journal of Productivity Analysis, 7(2/3), 99–138
Tang, C. F. and Tan, E. C. (2013). "How stable is the tourism-led growth hypothesis in Malaysia? Evidence from disaggregated tourism markets".
Tourism Management, 37, 52-57.