Integrating history-length interpolation and classes in language modeling
Hinrich Sch ¨utze
Institute for NLP University of Stuttgart
Germany
Abstract
Building on earlier work that integrates dif-ferent factors in language modeling, we view (i) backing off to a shorter history and (ii) class-based generalization as two complemen-tary mechanisms of using a larger equivalence class for prediction when the default equiv-alence class is too small for reliable estima-tion. This view entails that the classes in a language model should be learned from rare events only and should be preferably applied to rare events. We construct such a model and show that both training on rare events and preferable application to rare events improve perplexity when compared to a simple direct interpolation of class-based with standard lan-guage models.
1 Introduction
Language models, probability distributions over strings of words, are fundamental to many ap-plications in natural language processing. The main challenge in language modeling is to estimate string probabilities accurately given that even very large training corpora cannot overcome the inherent sparseness of word sequence data. One way to im-prove the accuracy of estimation is class-based gen-eralization. The idea is that even though a particular word sequencesmay not have occurred in the train-ing set (or too infrequently for accurate estimation), the occurrence of sequences similar toscan help us better estimatep(s).
Plausible though this line of reasoning is, the lan-guage models most commonly used today do not incorporate class-based generalization. This is par-tially due to the additional cost of creating classes
and using classes as part of the model. But an equally important reason is that most models that integrate class-based information do so by way of a simple interpolation and achieve only a modest im-provement in performance.
In this paper, we propose a new type of class-based language model. The key novelty is that we recognize that certain probability estimates are hard to improve based on classes. In particular, the best probability estimate for frequent events is often the maximum likelihood estimator and this estimator is hard to improve by using other information sources like classes or word similarity. We therefore design a model that attempts to focus the effect of class-based generalization on rare events.
Specifically, we propose to employ the same strategy for this that history-length interpo-lated (HI) models use. We define HI models as models that interpolate the predictions of different-length histories, e.g., p(w3|w1w2) = λ1(w1w2)p′(w3|w1w2) + λ2(w1w2)p′(w3|w2) + (1 −λ1(w1w2) −λ2(w1w2))p′(w3) where p′ is a
simple estimate; in this section, we use p′ = p
ML,
the maximum likelihood estimate, as an example. Jelinek-Mercer (Jelinek and Mercer, 1980) and modified Kneser-Ney (Kneser and Ney, 1995) models are examples of HI models.
HI models address the challenge that frequent events are best estimated by a method close to max-imum likelihood by selecting appropriate values for the interpolation weights. For example, ifw1w2w3
is frequent, thenλ1 will be close to 1, thus
ensur-ing thatp(w3|w1w2)≈pML(w3|w1w2)and that the
components pML(w3|w2) and pML(w3), which are
The main contribution of this paper is to propose the same mechanism for class language models. In fact, we will use the interpolation weights of a KN model to determine how much weight to give to each component of the interpolation. The difference to a KN model is merely that the lower-order distribution is not the lower-order KN distribution (as in KN), but instead an interpolation of the lower-order KN distribution and a class-based distribution. We will show that this method of integrating history interpo-lation and classes significantly increases the perfor-mance of a language model.
Focusing the effect of classes on rare events has another important consequence: if this is the right way of using classes, then they should not be formed based on all events in the training set, but only based on rare events. We show that doing this increases performance.
Finally, we introduce a second discounting method into the model that differs from KN. This can be motivated by the fact that with two sources of generalization (history-length and classes) more probability mass should be allocated to these two sources than to the single source used in KN. We propose a polynomial discount and show a signifi-cant improvement compared to using KN discount-ing only.
This paper is structured as follows. Section 2 discusses related work. Section 3 reviews the KN model and introduces two models, the Dupont-Rosenfeld model (a “recursive” model) and a top-level interpolated model, that integrate the KN model (a history interpolation model) with a class model. Section 4 details our experimental setup. Results are presented in Section 5. Based on an analysis of strengths and weaknesses of Dupont-Rosenfeld and top-level interpolated models, we present a new polynomial discounting mechanism that does better than either in Section 6. Section 7 presents our conclusions.
2 Related work
A large number of different class-based models have been proposed in the literature. The well-known model by Brown et al. (1992) is a class sequence model, in which p(u|w) is computed as the prod-uct of a class transition probability and an emission
probability, p(g(u)|g(w))p(u|g(u)), where g(u) is the class ofu. Other approaches condition the prob-ability of a class on n-grams of lexical items (as op-posed to classes) (Whittaker and Woodland, 2001; Emami and Jelinek, 2005; Uszkoreit and Brants, 2008). In this work, we use the Brown type of model: it is simpler and has fewer parameters. Mod-els that condition classes on lexical n-grams could be extended in a way similar to what we propose here.
Classes have been used with good results in a number of applications, e.g., in speech recognition (Yokoyama et al., 2003), sentiment analysis (Wie-gand and Klakow, 2008), and question answering (Momtazi and Klakow, 2009). Classes have also been shown to improve the performance of exponen-tial models (Chen, 2009).
Our use of classes of lexical n-grams forn > 1
has several precedents in the literature (Suhm and Waibel, 1994; Kuo and Reichl, 1999; Deligne and Sagisaka, 2000; Justo and Torres, 2009). The nov-elty of our approach is that we integrate phrase-level classes into a KN model.
Hierarchical clustering (McMahon and Smith, 1996; Zitouni and Zhou, 2007; Zitouni and Zhou, 2008) has the advantage that the size of the class to be used in a specific context is not fixed, but can be chosen at an optimal level of the hierarchy. There is no reason why our non-hierarchical flat model could not be replaced with a hierarchical model and we would expect this to improve results.
The key novelty of our clustering method is that clusters are formed based on rare events in the train-ing corpus. This type of clustertrain-ing has been applied to other problems before, in particular to unsuper-vised part-of-speech tagging (Sch¨utze, 1995; Clark, 2003; Reichart et al., 2010). However, the impor-tance of rare events for clustering in language mod-eling has not been investigated before.
symbol denotation P
[[w]] P
w(sum over all unigramsw) c(wi
j) count ofwij
[image:3.612.68.291.351.599.2]n1+(•wji) # of distinctwoccurring beforewij
Table 1: Notation used for Kneser-Ney.
baseline.
3 Models
In this section, we introduce the three models that we compare in our experiments: Kneser-Ney model, Dupont-Rosenfeld model, and top-level interpola-tion model.
3.1 Kneser-Ney model
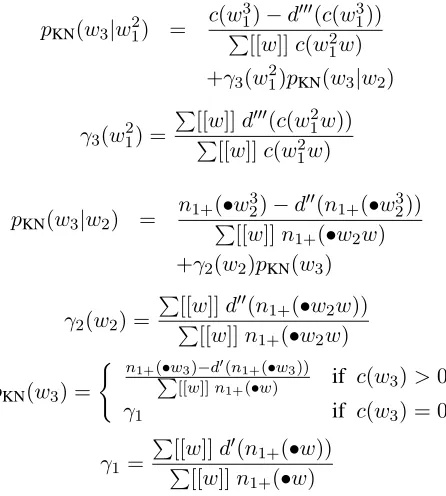
Our baseline model is the modified Kneser-Ney (KN) trigram model as proposed by Chen and Good-man (1999). We give a comprehensive description of our implementation of KN because the details are important for the integration of the class model given below. We use the notation in Table 1.
We estimatepKNon the training set as follows.
pKN(w3|w12) =
c(w31)−d′′′(c(w3
1))
P[[w]]c(w2
1w) +γ3(w21)pKN(w3|w2)
γ3(w21) =
P[[w]]d′′′(c(w2
1w))
P
[[w]]c(w2 1w)
pKN(w3|w2) =
n1+(•w32)−d′′(n1+(•w23))
P
[[w]]n1+(•w2w) +γ2(w2)pKN(w3)
γ2(w2) =
P
[[w]]d′′(n
1+(•w2w))
P
[[w]]n1+(•w2w)
pKN(w3) =
( n1+(•w3)−d′(n1+(•w3))
P
[[w]]n1+(•w) if c(w3)>0
γ1 if c(w3) = 0
γ1=
P[[w]]d′(n
1+(•w))
P
[[w]]n1+(•w)
The parameters d′,d′′, andd′′′ are the discounts for unigrams, bigrams and trigrams, respectively, as defined by Chen and Goodman (1996, p. 20, (26)). Note that our notation deviates from C&G in that they use the single symbolD1for the three different
valuesd′(1),d′′(1), andd′′′(1)etc.
3.2 Dupont-Rosenfeld model
History-interpolated models attempt to find a good tradeoff between using a maximally informative his-tory for accurate prediction of frequent events and generalization for rare events by using lower-order distributions; they employ this mechanism recur-sively by progresrecur-sively shortening the history.
The key idea of the improved model we will adopt is that class generalization ought to play the same role in history-interpolated models as the lower-order distributions: they should improve estimates for unseen and rare events. Following Dupont and Rosenfeld (1997), we implement this idea by lin-early interpolating the class-based distribution with the lower order distribution, recursively at each level. For a trigram model, this means that we in-terpolatepKN(w3|w2)andpB(w3|w1w2)on the first
backoff level and pKN(w3) and pB(w3|w2) on the
second backoff level, wherepBis the (Brown) class
model (see Section 4 for details onpB). We call this
modelpDRfor Dupont-Rosenfeld model and define
it as follows:
pDR(w3|w21) =
c(w31)−d′′′(c(w3 1))
P
[[w]]c(w2 1w)
+ γ3(w21)[β1(w12)pB(w3|w21) +(1−β1(w21))pDR(w3|w2)]
pDR(w3|w2) =
n1+(•w32)−d′′(n1+(•w23))
P
[[w]]n1+(•w2w) + γ2(w2)[β2(w2)pB(w3|w2)
+(1−β2(w2))pDR(w3)]
whereβi(v)is equal to a parameterαiif the history
(w2
1 orw2) is part of a cluster and 0 otherwise:
βi(v) =
(
αi if v∈ B2−(i−1)
0 otherwise
B1(resp.B2) is the set of unigram (resp. bigram)
his-tories that is covered by the clusters. We cluster bi-gram histories and unibi-gram histories separately and writepB(w3|w1w2)for the bigram cluster model and pB(w3|w2)for the unigram cluster model.
The unigram distribution of the Dupont-Rosenfeld model is set to the unigram distribution of the KN model:pDR(w) =pKN(w).
The model (or family of models) defined by Dupont and Rosenfeld (1997) is more general than our versionpDR. Most importantly, it allows a truly
parallel backoff whereas in our model the recursive backoff distributionpDRis interpolated with a class
distribution pBthat is not backed off. We prefer this
version because it makes it easier to understand the contribution that unique-event vs. all-event classes make to improved language modeling; the parame-tersβare a good indicator of this effect.
An alternative way of setting up the Dupont-Rosenfeld model would be to interpolate
pKN(w3|w1w2) and pB(w3|w1w2) etc – but this is
undesirable. The strength of history interpolation is that estimates for frequent events are close to ML, e.g., pKN(share|cents a) ≈ pML(share|cents a) for
our corpus. An ML estimate is accurate for large counts and we should not interpolate it directly with pB(w3|w1w2). ForpDR, the discount d′′′ that
is subtracted from c(w1w2w3) is small relative to c(w1w2w3) and therefore pDR ≈ pML in this case
(exactly as inpKN).
3.3 Top-level interpolation
Class-based models are often combined with other models by interpolation, starting with the work by Brown et al. (1992). Since we cluster both unigrams and bigrams, we interpolate three models:
pTOP(w3|w1w2)
= µ1(w1w2)pB(w3|w1w2) +µ2(w2)pB(w3|w2) + (1−µ1(w1w2)−µ2(w2))pKN(w3|w1w2)
whereµ1(w1w2) = λ1 ifw1w2 ∈ B2 and 0
other-wise,µ2(w2) =λ2ifw2 ∈ B1and 0 otherwise and λ1andλ2are parameters. We call this the top-level
modelpTOP because it interpolates the three models
at the top level. Most previous work on class-based model has employed some form of top-level inter-polation.
4 Experimental Setup
We run experiments on a Wall Street Journal (WSJ) corpus of 50M words, split 8:1:1 into training, val-idation and test sets. The training set contains
256,873 unique unigrams and 4,494,222 unique bi-grams. Unknown words in validation and test sets are mapped to a special unknown wordu.
We use the SRILM toolkit (Stolcke, 2002) for clustering. An important parameter of the class-based model is size|Bi|of the base set, i.e., the total
number of n-grams (or rather i-grams) to be clus-tered. As part of the experiments we vary|Bi|
sys-tematically to investigate the effect of base set size. We cluster unigrams (i = 1) and bigrams (i = 2). For all experiments, |B1| = |B2|(except in cases
where|B2|exceeds the number of unigrams, see
be-low). SRILM does not directly support bigram clus-tering. We therefore represent a bigram as a hyphen-ated word in bigram clustering; e.g., Pan Am is rep-resented as Pan-Am.
The input to the clustering is the vocabulary Bi
and the cluster training corpus. For a particular base set sizeb, the unigram input vocabularyB1is set to
thebmost frequent unigrams in the training set and the bigram input vocabulary B2 is set to thebmost
frequent bigrams in the training set.
In this section, we call the WSJ training corpus the raw corpus and the cluster training corpus the cluster corpus to be able to distinguish them. We run four different clusterings for each base set size (except for the large sets, see below). The cluster corpora are constructed as follows.
• All-event unigram clustering. The cluster corpus is simply the raw corpus.
• All-event bigram clustering. The cluster
cor-pus is constructed as follows. A sentence of the raw corpus that contains s words is included twice, once as a sequence of the⌊s/2⌋bigrams “w1−w2 w3−w4 w5−w6 . . . ” and once as a
sequence of the⌊(s−1)/2⌋bigrams “w2−w3 w4−w5 w6−w7. . . ”.
• Unique-event unigram clustering. The
clus-ter corpus is the set of all sequences of two un-igrams∈ B1 that occur in the raw corpus, one
sequence per line. Each sequence occurs only once in this cluster corpus.
• Unique-event bigram clustering. The cluster
one sequence per line. Each sequence occurs only once in this cluster corpus.
As mentioned above, we need both unigram and bigram clusters because we want to incorporate class-based generalization for histories of lengths 1 and 2. As we will show below this significantly in-creases performance. Since the focus of this paper is not on clustering algorithms, reformatting the train-ing corpus as described above (as a sequence of hy-phenated bigrams) is a simple way of using SRILM for bigram clustering.
The unique-event clusterings are motivated by the fact that in the Dupont-Rosenfeld model, frequent events are handled by discounted ML estimates. Classes are only needed in cases where an event was not seen or was not frequent enough in the train-ing set. Consequently, we should form clusters not based on all events in the training corpus, but only on events that are rare – because this is the type of event that classes will then be applied to in predic-tion.
The two unique-event corpora can be thought of as reweighted collections in which each unique event receives the same weight. In practice this means that clustering is mostly influenced by rare events since, on the level of types, most events are rare. As we will see below, rare-event clusterings perform better than all-event clusterings. This is not surprising as the class-based component of the model can only benefit rare events and it is there-fore reasonable to estimate this component based on a corpus dominated by rare events.
We started experimenting with reweighted cor-pora because class sizes become very lopsided in regular SRILM clustering as the size of the base set increases. The reason is that the objective function maximizes mutual information. Highly differenti-ated classes for frequent words contribute substan-tially to this objective function whereas putting all rare words in a few large clusters does not hurt the objective much. However, our focus is on using clustering for improving prediction for rare events; this means that the objective function is counter-productive when contexts are frequency-weighted as they occur in the corpus. After overweighting rare contexts, the objective function is more in sync with what we use clusters for in our model.
pML maximum likelihood
pB Brown cluster model
pE cluster emission probability
pT cluster transition probability
pKN KN model
pDR Dupont-Rosenfeld model
pTOP top-level interpolation
pPOLKN KN and polynomial discounting
pPOL0 polynomial discounting only
Table 2: Key to probability distributions
It is important to note that the same intu-ition underlies unique-event clustering that also motivates using the “unique-event” dis-tributions n1+(•w32)/(Pn1+(•w2w)) and n1+(•w3)/(Pn1+(•w)) for the backoff
distri-butions in KN. Viewed this way, the basic KN model also uses a unique-event corpus (although a different one) for estimating backoff probabilities.
In all cases, we set the number of clusters to
k= 512. Our main goal in this paper is to compare different ways of setting up history-length/class in-terpolated models and we do not attempt to optimize
k. We settled on a fixed number ofk= 512because Brown et al. (1992) used a total of 1000 classes. 512 unigram classes and 512 bigram classes roughly cor-respond to this number. We prefer powers of 2 to facilitate efficient storage of cluster ids (one such cluster id must be stored for each unigram and each bigram) and therefore choose k = 512. Clustering was performed on an Opteron 8214 processor and took from several minutes for the smallest base sets to more than a week for the largest set of 400,000 items.
To estimate n-gram emission probabilities pE, we
first introduce an additional cluster for all unigrams that are not in the base set; emission probabilities are then estimated by maximum likelihood. Cluster transition probabilities pT are computed using
add-one smoothing. Both pE and pT are estimated on
the raw corpus. The two class distributions are then defined as follows:
pB(w3|w1w2) =pT(g(w3)|g(w1w2))pE(w3|g(w3)) pB(w3|w2) =pT(g(w3)|g(w2))pE(w3|g(w3))
pDR
all events unique events |Bi| α1 α2 perp. α1 α2 perp.
1a1×104 .20 .40 87.42 .2 .4 87.41
2a2×104 .20 .50 86.97 .2 .5 86.88 3a3×104 .10 .40 87.14 .2 .5 86.57 4a4×104 .10 .40 87.22 .3 .5 86.31
5a5×104 .05 .30 87.54 .3 .6 86.10 6a6×104 .01 .30 87.71 .3 .6 85.96
pTOP
all events unique events |Bi| λ1 λ2 perp. λ1 λ2 perp.
1b1×104 .020 .03 87.65 .02 .02 87.71 2b2×104 .030 .04 87.43 .03 .03 87.47 3b3×104 .020 .03 87.52 .03 .03 87.34
4b4×104 .010 .04 87.58 .03 .04 87.24 5b5×104 .003 .03 87.74 .03 .04 87.15 6b6×104 .000 .02 87.82 .03 .04 87.09
[image:6.612.71.547.43.167.2]Perplexity of KN model: 88.03
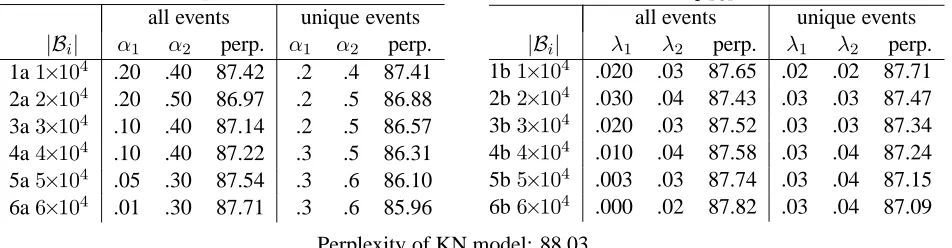
Table 3: Optimal parameters for Dupont-Rosenfeld (left) and top-level (right) models on the validation set and per-plexity on the validation set. The two tables compare performance when using a class model trained on all events vs a class model trained on unique events.|B1|=|B2|is the number of unigrams and bigrams in the clusters; e.g., lines 1a and 1b are for models that cluster 10,000 unigrams and 10,000 bigrams.
Table 2 is a key to the probability distributions we use.
5 Results
Table 3 shows the performance ofpDRandpTOPfor a
range of base set sizes|Bi|and for classes trained on
all events and on unique events. Parametersαi and λi are optimized on the validation set. Perplexity is
reported for the validation set. All following tables also optimize on the validation set and report results on the validation set. The last table, Table 7, also reports perplexity for the test set.
Table 3 confirms previous findings that classes improve language model performance. All models have a perplexity that is lower than KN (88.03).
When comparing all-event and unique-event clus-terings, a clear tendency is apparent. In all-event clustering, the best performance is reached for |Bi| = 20000: perplexity is 86.97 with this base
set size for pDR (line 2a) and 87.43 for pTOP (line
2b). In unique-event clustering, performance keeps improving with larger and larger base sets; the best perplexities are obtained for |Bi| = 60000: 85.96
forpDRand 87.09 forpTOP(lines 6a, 6b).
The parameter values also reflect this difference between all-event and unique-event clustering. For unique-event results of pDR, we have α1 ≥ .2 and α2≥.4(1a–6a). This indicates that classes and
his-tory interpolation are both valuable when the model is backing off. But for all-event clustering, the val-ues ofαidecrease: from a peak of .20 and .50 (2a)
to .01 and .30 (6a), indicating that with larger base sets, less and less value can be derived from classes. This again is evidence that rare-event clustering is the correct approach: only clusters derived in rare-event clustering receive high weightsαiin the
inter-polation.
This effect can also be observed for pTOP: the
value of λ1 (the weight of bigrams) is higher for
unique-event clustering than for all-event clustering (with the exception of lines 1b&2b). The quality of bigram clusters seems to be low in all-event cluster-ing when the base set becomes too large.
Perplexity is generally lower for unique-event clustering than for all-event clustering: this is the case for all values of |Bi|for pDR (1a–6a); and for
|Bi|>20000forpTOP(3b–6b).
Table 4 compares the two models in two different conditions: (i) b-: using unigram clusters only and (ii) b+: using unigram clusters and bigram clusters. For all events, there is no difference in performance. However, for unique events, the model that includes bigrams (b+) does better than the model without bi-grams (b-). The effect is larger for pDR than for
pTOP because (for unique events) a larger weight for
the unigram model (λ2 = .05 instead ofλ2 = .04)
apparently partially compensates for the missing bi-gram clusters.
pDR pTOP
all unique all unique
α1 α2 perp. α1 α2 perp. λ1 λ2 perp. λ1 λ2 perp.
b- .3 87.71 .5 86.62 .02 87.82 .05 87.26
[image:7.612.112.486.31.99.2]b+ .01 .3 87.71 .3 .6 85.96 0 .02 87.82 .03 .04 87.09
Table 4: Using both unigram and bigram clusters is better than using unigrams only. Results for|Bi|= 60,000.
pDR pTOP
|Bi| α1 α2 perp. λ1 λ2 perp.
16×104 0.3 0.6 85.96 0.03 0.04 87.09
21×105 0.3 0.6 85.59 0.04 0.04 86.93 32×105 0.3 0.6 85.20 0.05 0.04 86.77 44×105 0.3 0.7 85.14 0.05 0.04 86.74
Table 5: Dupont-Rosenfeld and top-level models for |Bi| ∈ {60000,100000,200000,400000}. Clustering
trained on unique-event corpora.
comparison of all-event and rare-event models to |Bi| ≤ 60,000 in Tables 3-4 and report only
rare-event numbers for|Bi|>60,000in what follows.
As we can see in Table 5, the trends observed in Table 3 continue as |Bi| is increased further. For
both models, perplexity steadily decreases as|Bi|is
increased from 60,000 to 400,000. (Note that for |Bi| = 400000, the actual size of B1 is 256,873
since there are only that many words in the training corpus.) The improvements in perplexity become smaller for larger base set sizes, but it is reassuring to see that the general trend continues for large base set sizes. Our explanation is that the class compo-nent is focused on rare events and the items that are being added to the clustering for large base sets are all rare events.
The perplexity forpDR is clearly lower than that
of pTOP, indicating the superiority of the
Dupont-Rosenfeld model.1
1Dupont and Rosenfeld (1997) found a relatively large
im-provement of the “global” linear interpolation model –ptopin
our terminology – compared to the baseline whereasptop
per-forms less well in our experiments. One possible explanation is that our KN baseline is stronger than the word trigram baseline they used.
6 Polynomial discounting
Further comparative analysis of pDR and pTOP
re-vealed that pDR is not uniformly better than pTOP.
We found thatpTOPdoes poorly on frequent events.
For example, for the history w1w2 = cents a, the
continuationw3 =share dominates. pDRdeals well
with this situation becausepDR(w3|w1w2)is the
dis-counted ML estimate, with a discount that is small relative to the 10,768 occurrences of cents a share in the training set. In thepTOPmodel on the last line
in Table 5, the discounted ML estimate is multiplied by1−.05−.04 =.91, which results in a much less accurate estimate ofpTOP(share|cents a).
In contrast, pTOP does well for productive
histo-ries, for which it is likely that a continuation unseen in the training set will occur. An example is the his-tory in the – almost any adjective or noun can follow. There are 6251 different words that (i) occur after in the in the validation set, (ii) did not occur after in the in the training set, and (iii) occurred at least 10 times in the training set. Because their training set unigram frequency is at least 10, they have a good chance of being assigned to a class that captures their distributional behavior well andpB(w3|w1w2)
is then likely to be a good estimate. For a history with these properties, it is advantageous to further discount the discounted ML estimates by multiply-ing them with .91. pTOP then gives the remaining
probability mass of .09 to wordsw3 whose
proba-bility would otherwise be underestimated.
[image:7.612.89.280.144.225.2]from high-frequency to low-frequency events. We conclude from this analysis that we need to increase the discount valuesdfor large counts.
We could add a constant tod, but one of the ba-sic premises of the KN model, derived from the as-sumption that n-gram marginals should be equal to relative frequencies, is that the discount is larger for more frequent n-grams although in many implemen-tations of KN only the casesc(w3
1) = 1,c(w13) = 2,
andc(w31)≥3are distinguished.
This suggests that the ideal discountd(x)in an in-tegrated history-length/class language model should grow monotonically withc(v). The simplest way of implementing this heuristically is a polynomial of formρxr whereρ and rare parameters. r controls
the rate of growth of the discount as a function ofx;
ρ is a factor that can be scaled for optimal perfor-mance.
The incorporation of the additional polynomial discount into KN is straightforward. We use a dis-count function e(x) that is the sum ofd(x)and the polynomial:
e(x) =d(x) +
(
ρxr for x≥4 0 otherwise
where (e, d) ∈ {(e′, d′),(e′′, d′′),(e′′′, d′′′)}. This model is identical to pDR except thatdis replaced
withe. We call this modelpPOLKN. pPOLKNdirectly
implements the insight that, when using class-based generalization, discounts for countsx≥4should be larger than they are in KN.
We also experiment with a second version of the model:
e(x) =ρxr
This second model, calledpPOL0, is simpler and does
not use KN discounts. It allows us to determine whether a polynomial discount by itself (without us-ing KN discounts in addition) is sufficient.
Results for the two models are shown in Table 6 and compared with the two best models from Ta-ble 5, for|Bi|= 400,000, classes trained on unique
events. pPOLKNandpPOL0achieve a small
improve-ment in perplexity when compared topDR(line 3&4
vs 2). This shows that using discounts that are larger than KN discounts for large counts is potentially ad-vantageous.
α1/λ1 α2/λ2 ρ r perp.
1 pTOP .05 .04 86.74
2 pDR .30 .70 85.14
3 pPOLKN .30 .70 .05 .89 85.01
[image:8.612.317.519.162.362.2]4 pPOL0 .30 .70 .80 .41 84.98
Table 6: Results for polynomial discounting compared topDR andpTOP. |Bi| = 400,000, clusters trained on
unique events.
perplexity
tb:l model |Bi| val test
1 3 pKN 88.03 88.28
2 3:6apDR 6×10⁴ ae b+ 87.71 87.97
3 3:6apDR 6×10⁴ue b+ 85.96 86.22
4 3:6bpTOP 6×10⁴ ae b+ 87.82 88.08
5 3:6bpTOP 6×10⁴ue b+ 87.09 87.35
6 4 pDR 6×10⁴ ae b- 87.71 87.97
7 4 pDR 6×10⁴ue b- 86.62 86.88
8 4 pTOP 6×10⁴ ae b- 87.82 88.08
9 4 pTOP 6×10⁴ue b- 87.26 87.51
10 5:4 pDR 2×10⁵ue b+ 85.14 85.39
11 5:4 pTOP 2×10⁵ue b+ 86.74 86.98
12 6:3 pPOLKN4×105ue b+ 85.01 85.26
13 6:4 pPOL0 4×10⁵ue b+ 84.98 85.22
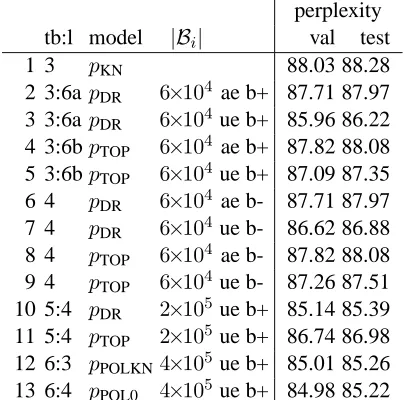
Table 7: Performance of key models on validation and test sets. tb:l = Table and line the validation result is taken from. ae/ue = all-event/unique-event. b- = unigrams only. b+ = bigrams and unigrams.
The linear interpolationαp+ (1−α)qof two dis-tributions p and q is a form of linear discounting:
p is discounted by 1−α and q by α. See (Katz, 1987; Jelinek, 1990; Ney et al., 1994). It can thus be viewed as polynomial discounting for r = 1. Absolute discounting could be viewed as a form of polynomial discounting forr = 0. We know of no other work that has explored exponents between 0 and 1 and shown that for this type of exponent, one obtains competitive discounts that could be argued to be simpler than more complex discounts like KN discounts.
6.1 Test set performance
on the validation set as reported in the table refer-enced in column “tb:l”; e.g., on line 2 of Table 7,
(α1, α2) = (.01, .3) as reported on line 6a of
Ta-ble 3.
There is an almost constant difference between validation and test set perplexities, ranging from +.2 to +.3, indicating that test set results are consistent with validation set results. To test significance, we assigned the 2.8M positions in the test set to 48 dif-ferent bins according to the majority part-of-speech tag of the word in the training set.2 We can then compute perplexity for each bin, compare perplexi-ties for different experiments and use the sign test for determining significance. We indicate results that were significant at p < .05 (n = 48, k ≥ 32 suc-cesses) using a star, e.g., 3<∗2 means that test set perplexity on line 3 is significantly lower than test set perplexity on line 2.
The main findings on the validation set also hold for the test set: (i) Trained on unique events and with a sufficiently large |Bi|, bothpDRandpTOP are
bet-ter than KN:10<∗1,11<∗1. (ii) Training on unique events is better than training on all events: 3<∗2,
5<∗4,7<∗6,9<∗8. (iii) For unique events, using bigram and unigram classes gives better results than using unigram classes only: 3<∗7. Not significant:
5<9. (iv) The Dupont-Rosenfeld modelpDRis
bet-ter than the top-level modelpTOP: 10<∗11. (v) The
model POL0 (polynomial discounting) is the best model overall: Not significant: 13 < 12. (vi) Poly-nomial discounting is significantly better than KN discounting for the Dupont-Rosenfeld modelpDR
al-though the absolute difference in perplexity is small:
13<∗10.
Overall,pDR and pPOL0 achieve considerable
re-ductions in test set perplexity from 88.28 to 85.39 and 85.22, respectively. The main result of the ex-periments is that Dupont-Rosenfeld models (which focus on rare events) are better than the standardly used top-level models; and that training classes on unique events is better than training classes on all events.
2
Words with a rare majority tag (e.g., FW ‘foreign word’) and unknown words were assigned to a special class OTHER.
7 Conclusion
Our hypothesis was that classes are a generalization mechanism for rare events that serves the same func-tion as history-length interpolafunc-tion and that classes should therefore be (i) primarily trained on rare events and (ii) receive high weight only if it is likely that a rare event will follow and be weighted in a way analogous to the weighting of lower-order dis-tributions in history-length interpolation.
We found clear statistically significant evidence for both (i) and (ii). (i) Classes trained on unique-event corpora perform better than classes trained on all-event corpora. (ii) The pDR model (which
ad-justs the interpolation weight given to classes based on the prevalence of nonfrequent events following) is better than top-level model pTOP (which uses a
fixed weight for classes). Most previous work on class-based models has employed top-level interpo-lation. Our results strongly suggest that the Dupont-Rosenfeld model is a superior model.
A comparison of Dupont-Rosenfeld and top-level results suggested that the KN discount mechanism does not discount high-frequency events enough. We empirically determined that better discounts are obtained by letting the discount grow as a func-tion of the count of the discounted event and im-plemented this as polynomial discounting, an ar-guably simpler way of discounting than Kneser-Ney discounting. The improvement of polynomial dis-counts vs. KN disdis-counts was small, but statistically significant.
In future work, we would like to find a theoreti-cal justification for the surprising fact that polyno-mial discounting does at least as well as Kneser-Ney discounting. We also would like to look at other backoff mechanisms (in addition to history length and classes) and incorporate them into the model, e.g., similarity and topic. Finally, training classes on unique events is an extreme way of highly weight-ing rare events. We would like to explore trainweight-ing regimes that lie between unique-event clustering and all-event clustering and upweight rare events less.
Acknowledgements. This research was funded
References
Jeff Bilmes and Katrin Kirchhoff. 2003. Factored lan-guage models and generalized parallel backoff. In
HLT-NAACL.
Peter F. Brown, Vincent J. Della Pietra, Peter V. de Souza, Jennifer C. Lai, and Robert L. Mercer. 1992. Class-based n-gram models of natural language.
Computa-tional Linguistics, 18(4):467–479.
Stanley F. Chen and Joshua Goodman. 1996. An empir-ical study of smoothing techniques for language mod-eling. CoRR, cmp-lg/9606011.
Stanley F. Chen and Joshua Goodman. 1999. An empir-ical study of smoothing techniques for language mod-eling. Computer Speech & Language, 13(4):359–393. Stanley F. Chen. 2009. Shrinking exponential language
models. In HLT/NAACL, pages 468–476.
Alexander Clark. 2003. Combining distributional and morphological information for part of speech induc-tion. In EACL, pages 59–66.
Sabine Deligne and Yoshinori Sagisaka. 2000. Statisti-cal language modeling with a class-based n-multigram model. Computer Speech & Language, 14(3):261– 279.
Pierre Dupont and Ronald Rosenfeld. 1997. Lattice based language models. Technical Report CMU-CS-97-173, Carnegie Mellon University.
Ahmad Emami and Frederick Jelinek. 2005. Random clustering for language modeling. In ICASSP, vol-ume 1, pages 581–584.
Frederick Jelinek and Robert L. Mercer. 1980. Inter-polated estimation of Markov source parameters from sparse data. In Edzard S. Gelsema and Laveen N. Kanal, editors, Pattern Recognition in Practice, pages 381–397. North-Holland.
Frederick Jelinek. 1990. Self-organized language mod-eling for speech recognition. In Alex Waibel and Kai-Fu Lee, editors, Readings in speech recognition, pages 450–506. Morgan Kaufmann.
Raquel Justo and M. In´es Torres. 2009. Phrase classes in two-level language models for ASR. Pattern Analysis
& Applications, 12(4):427–437.
Slava M. Katz. 1987. Estimation of probabilities from sparse data for the language model component of a speech recognizer. IEEE Transactions on Acoustics,
Speech and Signal Processing, 35(3):400–401.
Reinhard Kneser and Hermann Ney. 1995. Im-proved backing-off for m-gram language modeling. In
ICASSP, volume 1, pages 181–184.
Hong-Kwang J. Kuo and Wolfgang Reichl. 1999. Phrase-based language models for speech recognition. In European Conference on Speech Communication
and Technology, volume 4, pages 1595–1598.
John G. McMahon and Francis J. Smith. 1996. Improv-ing statistical language model performance with auto-matically generated word hierarchies. Computational
Linguistics, 22:217–247.
Saeedeh Momtazi and Dietrich Klakow. 2009. A word clustering approach for language model-based sen-tence retrieval in question answering systems. In ACM
Conference on Information and Knowledge Manage-ment, pages 1911–1914.
Hermann Ney, Ute Essen, and Reinhard Kneser. 1994. On structuring probabilistic dependencies in stochastic language modelling. Computer Speech and Language, 8:1–38.
Roi Reichart, Omri Abend, and Ari Rappoport. 2010. Type level clustering evaluation: new measures and a pos induction case study. In Proceedings of the
Four-teenth Conference on Computational Natural Lan-guage Learning, pages 77–87.
Hinrich Sch ¨utze. 1995. Distributional part-of-speech tagging. In EACL 7, pages 141–148.
Andreas Stolcke. 2002. SRILM - An extensible lan-guage modeling toolkit. In International Conference
on Spoken Language Processing, pages 901–904.
Bernhard Suhm and Alex Waibel. 1994. Towards bet-ter language models for spontaneous speech. In Inbet-ter-
Inter-national Conference on Spoken Language Processing,
pages 831–834.
Jakob Uszkoreit and Thorsten Brants. 2008. Distributed word clustering for large scale class-based language modeling in machine translation. In Annual
Meet-ing of the Association for Computational LMeet-inguistics,
pages 755–762.
E.W.D. Whittaker and P.C. Woodland. 2001. Efficient class-based language modelling for very large vocab-ularies. In ICASSP, volume 1, pages 545–548. Michael Wiegand and Dietrich Klakow. 2008.
Opti-mizing language models for polarity classification. In
ECIR, pages 612–616.
T. Yokoyama, T. Shinozaki, K. Iwano, and S. Furui. 2003. Unsupervised class-based language model adaptation for spontaneous speech recognition. In
ICASSP, volume 1, pages 236–239.
Imed Zitouni and Qiru Zhou. 2007. Linearly interpo-lated hierarchical n-gram language models for speech recognition engines. In Michael Grimm and Kris-tian Kroschel, editors, Robust Speech Recognition and
Understanding, pages 301–318. I-Tech Education and
Publishing.
Imed Zitouni and Qiru Zhou. 2008. Hierarchical linear discounting class n-gram language models: A multi-level class hierarchy approach. In International
Con-ference on Acoustics, Speech, and Signal Processing,