SimLean: a reference framework for embedding simulation
in lean projects
JIA, Yan
Available from Sheffield Hallam University Research Archive (SHURA) at:
http://shura.shu.ac.uk/17881/
This document is the author deposited version. You are advised to consult the publisher's version if you wish to cite from it.
Published version
JIA, Yan (2010). SimLean: a reference framework for embedding simulation in lean projects. Doctoral, Sheffield Hallam University.
Copyright and re-use policy
See http://shura.shu.ac.uk/information.html
Sheffield Hallam University Learning and information Services
Adsetts Centre, City Campus Sheffield S1 1WD
1 0 1 9 6 8 1 4 7 0
Sheffield Halfam University
I Mwmng ^od !1 Services
■ Adsetts * Centre Oty Campus
:] Sheffield S1 1WB
SimLean: A Reference Framework for
Embedding Simulation in Lean Projects
Yan Jia
A thesis submitted in partial fulfilment of the requirements of
Sheffield Hallam University
for the degree of Doctor of Philosophy
ABSTRACT
The intense global competition in today’s market is forcing organisations to looking for good process improvement techniques constantly. Currently lean methodology is one of the most popular programs for process improvement. However, the static lean tools have caused problems in lean implementation.
The main aim of the research work is to develop a reference framework about embedding simulation in lean projects. By embedding simulation method in lean projects, deficiencies of static lean tools such as their inability to assess the effects of variation, to validate effects of proposed changes before implementation, to identify other possible improvements or to capture the interactions between system components (Standridge and Marvel, 2006) might be overcome.
A combination of research methodology approaches is adopted. This includes conducting literature review, observing companies’ practices and interviewing experts, and adopting several case studies.
The focal points of the reference framework are designed in the pre implementation stage of lean projects. Referring to the detailed implementation of the framework, a new modelling environment is proposed. This new environment will use customised VSM templates built in Microsoft Visio software and in Arena simulation system respectively to achieve the quick modelling for lean projects. The proposed modelling environment is validated through five case studies.
The main features of the proposed framework are summarized as systematic, generic and the ability to overcome major challenges. A major contribution of the developed system is its ability to simplify, facilitate and standardize simulation modelling in lean projects. It dramatically reduces building blocks in the model, saves model constructing time and eliminates errors in logic design; the simulation models provides better results than static VSM; meanwhile, the interface between Arena and Visio greatly reduces users’ fear for complex simulation modelling environment, and increases the ease of use.
ABREVIATIONS
5S Sort, Set in order, Shine, Standardize and Sustain
ANOVA Analysis of Variance
C/O Time Changeover Time
DES Discrete Event Simulation
DMAIC Design-Measure-Analyze-lmprove-Control
DOE Design of Experiments
FIFO First in First Out
FMEA Failure Modes and Effects Analysis
JIT Just In Time
NVA Non Value Added
PDCA Plan-Do-Check-Act
PCE Process Cycle Efficiency
PLT Production Lead Time
PM Preventative Maintenance
SMED Single Minute Exchange of Dies
SPG Statistical Process Control and Control Charts
SS Six Sigma
TPM Total Productive Maintenance
TPS Toyota Production System
WIP Work In Progress
VA/T Value-Added Time
VOC Voice of Customer
VSM Value Stream Mapping
CONTENTS
ABSTRACT.. ... II
ABREVIATIONS ... Ill
CONTENTS ... ..V
LIST OF FIGURES ... VIII
LIST OF TABLES ... IX
1 INTRODUCTION ... 1
1.1 BACKGROUND ... 1
1.2 MOTIVATION ... 2
1.3 RESEARCH AIM AND OBJECTIVES ... 4
1.4 THESIS STRUCTURE ... 5
2 LITERATURE REVIEW... 7
2.1 LEAN METHODOLOGY... 7
2.1.1 BRIEF HISTORY OF LEAN ... 8
2.1.2 BASIC PRINCIPLES OF LEAN ... 10
2.1.3 THE EIGHT WASTES OF LEAN ... ,...12
2.1.4 LEAN IMPLEMENTATION ROADMAP.... ... 16
2.2 LEAN MANUFACTURING TOOLS ... 18
2.2.1 5S ... ..19
2.2.2 VISUAL CONTROLS... 19
2.2.3 STREAMLINED LAYOUT ... 21
2.2.4 STANDARD WORK.. ...21
2.2.5 BATCH-SIZE REDUCTION ... 21
2.2.6 TEAMS .... 21
2.2.7 QUALITY AT THE SOURCE... 21
2.2.8 POINT-OF-USE STORAGE... 21
2.2.9 QUICK CHANGEOVER... 22
2.2.10 PULL / KANBAN ... 22
2.2.11 CELLULAR / FLOW... 22
2.2.12 TOTAL PRODUCTIVE MAINTENANCE (TPM)... 22
2.2.13 OTHER TOOLS... ... ..23
2.3 VSM (VALUE STREAM MAPPING) ... 23
2.3.1 ADVANTAGES OF VSM...,... 25
2.3.2 PROCESS MAP FOR VSM (Locher, 2008)... 26
2.4 SHORTCOMINGS OF LEAN MANUFACTURING TOOLS ...:.. 27
2.5 SIMULATION APPLICATION IN LEAN PROJECTS ... 29
2.5.1 SIMULATION CLACIFICATIONS... ,... 29
2.5.2 DES (DISCRETE EVENT SIMULATION) MODELLING ...30
2.5.3 STEPS IN A SIMULATION STUDY... 35
2.5.4 VSM MODELS WITH STANDARD TEMPLATES ... 41
2.5.5 VSM MODELS WITH CUSTOMISED TEMPLATE... 42
•2.5.6 ALTERNATIVE APPROACHES FOR MODELLING LEAN PROJECTS ... ...44
2.6 CRITICAL ASSESSMENT OF LITERATURE SURVEY ...47
2.7 SUMMARY ... 49
3.1 RESEARCH QUESTIONS ... ... 50
3.2 DESIGN OF RESEARCH METHODS ... 51
3.3 THE SELECTED RESEARCH METHODOLOGY... ....53
3.4 RESULTS FROM INTERVIEWS... ... 58
3.4.1 RESEARCH QUESTIONS VERIFICATION... 59
3.4.2 CONCLUSIONS DRAWN FROM INTERVIEWS ... 67
4 BUILDING THE FRAMEWORK... ... 70
4.1 MOTIVATION AND DATA COLLECTION... 70
4.2 ANALYSIS OF SIMULATION EMBEDMENT ... 71
4.3 FRAMEWORK DEVELOPMENT... 72
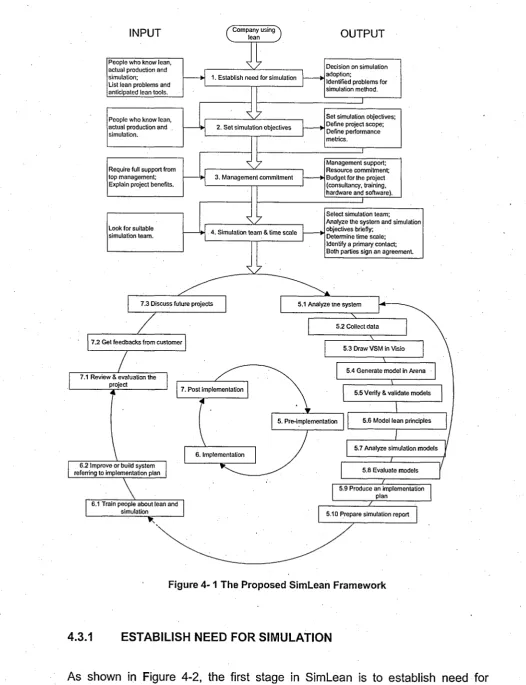
4.3.1 ESTABILISH NEED FOR SIMULATION... ... ...73
4.3.2 SET SIMULATION OBJECTIVES... ... 76
4.3.3 MANAGEMENT COMMITMENT ... 77
4.3.4 SIMULATION TEAM AND TIME SCALE... 78
4.3.5 PRE-IMPLEMENTATION... 80
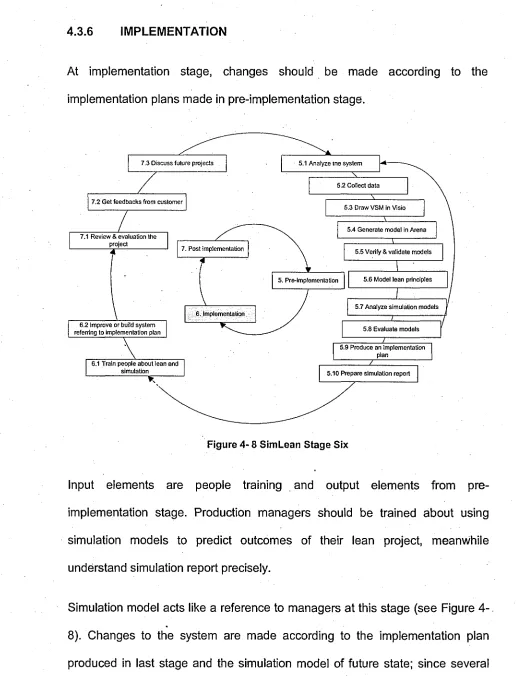
4.3.6 IMPLEMENTATION... 85
4.3.7 POST IMPLEMENTATION ... 86
4.4 FEATURES OF THE SIMLEAN FRAMEWORK... 87
4.4.1 SYSTEMATIC ... 87
4.4.2 GENERIC AND HOLISTIC ... 88
4.4.3 OVERCOME MAJOR CHALLENGES ... 88
5 CUSTOMISED SIMULATION ENVIRONMENT... 90
5.1 INTRODUCTION. ... 90
5.2 OVERVIEW OF ARENA TEMPLATE DEVELOPER ... 91
5.3 THE SYSTEM DEVELOPMENT PROCESS ... 92
5.4 DETERMINE TEMPLATEMODULES... 95
5.5 DESIGN TEMPLATE MODULES ... 99
5.5.1 SUPPLIER MODULE... 100
5.5.2 CUSTOMER MODULE... ....101
5.5.3 TRUCK MODULE ... 101
5.5.4 SAFETY STOCK MODULE...102
5.5.5 PROCESSVSM MODULE... ...103
5.5.6 INVENTORY MODULE... 104
5.5.7 SUPERMARKET MODULE... 105
5.6 TEMPLATE MODIFICATION ... 106
5.6.1 CUSTOMER MODULE MODIFICATION... 107
5.6.2 INVENTORY MODULE MODIFICATION .... 108
5.6.3 SUPERMARKET MODULE MODIFICATION...109
5.6.4 PROCESSVSM MODULE MODIFICATION ... ..110
5.7 TEMPLATE INTERFACE IN VISIO ... 111
5.7.1 ARENA INTERFACE TO VISIO APPLICATIONS (ROCKWELL AUTOMATION, 2005)... 112
5.7.2 PROCESS SIMULATOR INTRODUCTION (ROCKWELL AUTOMATION, 2005)... 113
5.7.3 VISVSM TEMPLATE DEVELOPMENT ...114
5.7.4 MAPPING FILE EDITTING ... 117
5.8 VERIFY AND VALIDATE SIMVSM TEMPLATE... ...119
5.9 SUMMARY.. ... 119
6 EVALUATION OF THE REFERENCE FRAMEWORK... 121
6.1 DESIGN OF CASE STUDIES... 122
6.2 CASE STUDY ONE... 123
6.2.1 VSM DESCRIPTION... .123
6.2.2 THE SIMULATION SCENE ... 124
6.2.3 RESULTS AND FINDINGS ... 127
6.3 CASE STUDY TWO ...127
6.3.1 VSM DESCRIPTION ... 127
6.3.2 THE SIMULATION SCENE... 129
6.3.3 RESULTS AND FINDINGS ... 132
6.4 CASE STUDY THREE ... 132
6.4.1 VSM DESCRIPTION... ...'... 132
6.4.2 THE SIMULATION SCENE ... 134
6.4.3 RESULTS AND FINDINGS... 136
6.5 CASE STUDY FOUR ... 136
6.5.1 VSM DESCRIPTION... 136
6.5.2 THE SIMULATION SCENE ... 138
6.5.3 RESULTS AND FINDINGS... 141
6.6 CASE STUDY FIVE... 141
' 6.6.1 VSM DESCRIPTION ... 141
6.6.2 THE SIMULATION SCENE ... 142
6.6.3 RESULTS AND FINDINGS... 145
6.7 KEY OBSERVATIONS... ... 145
7 CONCLUSIONS AND FUTURE WORK... ... 149
7.1 RESEARCH OBJECTIVES AND ACHIEVEMENTS ... 149
7.1.1 ACHIEVEMENTS OF THE RESEARCH OBJECTIVES 150
7.1.2 DEVELOPPING SIMLEAN FRAMEWORK ... 151
7.1.3 EVALUATION OF THE CUSTOMISED SIMULATION ENVIRONMENT... 152
7.2 CONTRIBUTION TO KNOWLEDGE... 152
7.2.1 NOVELTY IN RESEARCH FINDINGS ... 153
7.2.2 NOVELTY IN CAPABILITY OF SIMLEAN FRAMEWORK... 153
7.2.3 NOVELTY IN CAPABILITY OF THE PROPOSED SYSTEM... 154
7.2.4 SOLUTIONS TO THE IDENTIFIED RESEARCH GAPS 155 7.2.5 ACCOMPLISHMENT OF THE RESEARCH QUESTIONS 155
7.3 RESEARCH LIMITATIONS... 156
7.4 FUTURE RESEARCH WORK... 158
REFERENCES... ... ...161
APPENDIX A: DATA COLLECTION SHEET ... 170
APPENDIX B: DATA COLLECTION SHEET FOR INTERVIEW ... 171
APPENDIX C: DIALOG DESIGN OF SIMVSM TEMPLATE...174
APPENDIX D: VlSVSM TEMPLATE PARAMETERS... 179
LIST OF FIGURES
Figure 2-1 Structure of Lean Manufacturing Implementation... 17
Figure 2- 2 Process Map for VSM ... 27
Figure 2- 3 Elements of System Modelling with DES ... 31
Figure 2- 4 The Simulation Procedure... 36
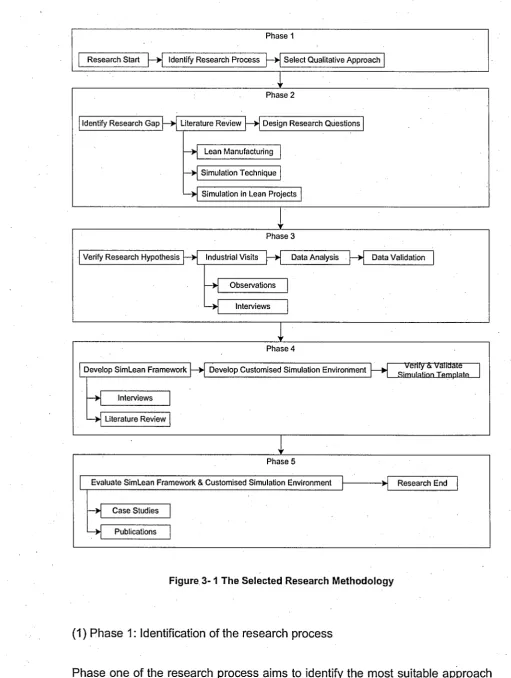
Figure 3-1 The Selected Research Methodology ... 54
Figure 4-1 The Proposed SimLean Framework... ..73
Figure 4- 2 SimLean Stage One... .... ...:... 74
Figure 4- 3 SimLean Stage Two ... 76
Figure 4- 4 SimLean Stage Three ... 78
Figure 4- 5 SimLean Stage Four... 78
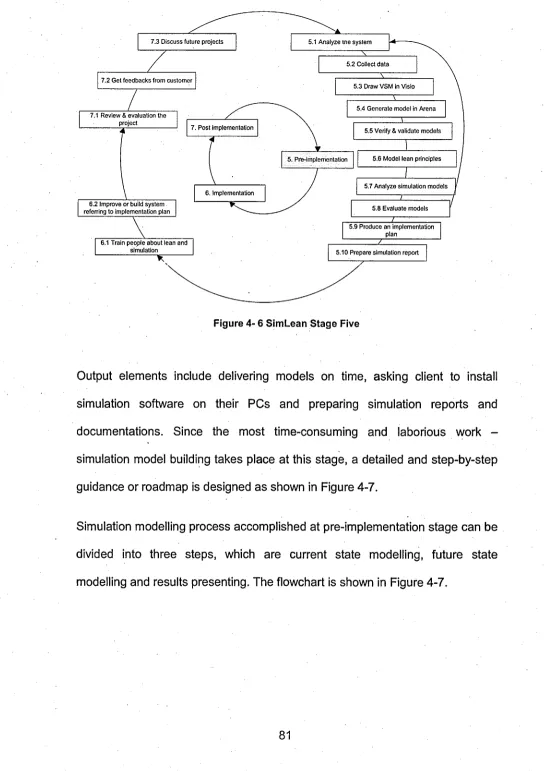
Figure 4- 6 SimLean Stage Five... 81
Figure 4- 7 Simulation Modelling at Pre-implementation Stage... 82
Figure 4- 8 SimLean Stage Six ... 85
Figure4-9 SimLean Stage Seven... ... ..86
Figure 5-1 Five Windows for Module Definition ... 92
Figure 5- 2 Modules Development Process... :... 94
Figure 5- 3 The SimVSM Template ... 99
Figure 5- 4 Logic Concept of Supplier Module... 100
Figure 5- 5 Logic Concept of Customer Module ... 101
Figure 5- 6 Logic Concept of Truck Module... 101
Figure 5- 7 Logic Concept of Safety Stock Module ... 102
Figure 5- 8 Logic Concept of ProcessVSM Module ... 103
Figure 5- 9 Logic Concept of Inventory Module... ....104
Figure 5-10 Logic Concept of Supermarket Module... 105
Figure 5-11 Logic Concept of Modified Customer Module ...107
Figure 5-12 Logic Concept of Modified Inventory Module ... 108
Figure 5-13 Logic Concept of Modified Supermarket Module... 109
Figure 5-14 Logic Concept of Modified ProcessVSM Module ... 110
Figure 5-15 Arena Software Architecture... 113
Figure 5-16 Process Simulation Approach... ...114
Figure 5-17 VisVSM Template Development ...115
Figure 5-18 Visio Shape Mapping File... 118
Figure 6-1 Static VSM of Case Study 1 ... 123
Figure 6- 2 Simulation Scene of Case Study 1... 125
Figure 6- 3 Static VSM of Case Study 2 ... 128
Figure 6- 4 Simulation Scene of Case Study 2... 129
Figure 6- 5 Static VSM of Case Study 3 ... 133
Figure 6- 6 Simulation Scene of Case Study 3... 134
Figure 6- 7 Static VSM of Case Study 4 ... 137
Figure 6- 8 Simulation Scene of Case Study 4 ... 138
Figure 6- 9 Static VSM of Case Study 5... 142
Figure 6-10 Simulation Scene of Case Study 5 ... :.... 143
LIST OF TABLES
Table 2-1 Development Waste Examples ... 15
Table 2- 2 Data Collected for Various DES Elements... 31
Table 2- 3 Examples of Structural Elements in DES... 32
Table 2- 4 Examples of Model Logical Designs... 33
Table 2- 5 Examples of Model Statistics... 35
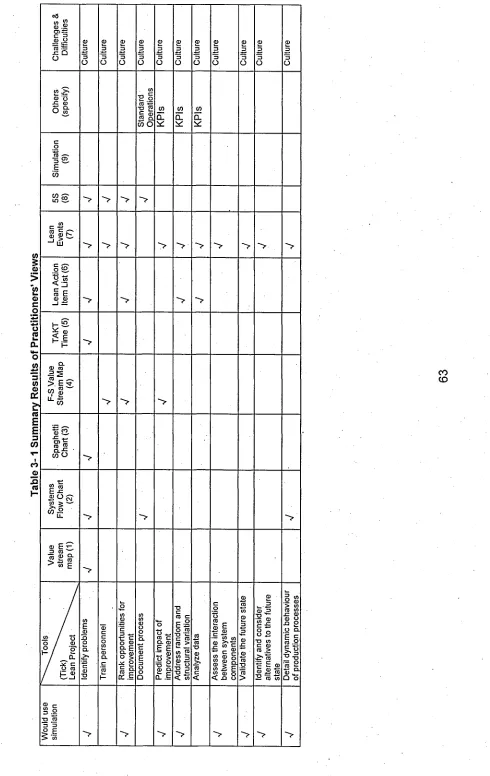
Table 3-1 Summary Results of Practitioners' Views... ...63
Table 4-1 Simulation Applicability for Lean Problems... 75
Table 4- 2 Simulation Team Selection ... 79
• Table 4- 3 System Specification in Six Elements (Kelton, et al. 2004)... 80
Table 5-1 Static VSM Icons in Visio 2007... 95
Table 5- 2 Determined Modules for SimVSM Template ... 97
Table 5- 3 Unselected VSM Icons... 98
Table 5- 4 Block Number of Modules in SimVSM Template ... 99
Table 5-5 Block Number of Modified Modules in SimVSM Template ... 106
Table 5- 6 Custom Property Options... 116
Table 6-1 Data Comparison of Case Study 1 ... 126
Table 6- 2 Data Comparison of Case Study 2 ... 131
Table 6- 3 Data Comparison of Case Study 3 ... 135
Table 6- 4 Data Comparison of Case Study 4 ... 140
Table 6- 5 Data Comparison of Case Study 5 ... 144
1
INTRODUCTION
1.1 BACKGROUND
To survive in an ever increasing global and competitive marketplace,
organisations are forging strategic alliances to gain a competitive advantage
over their rivals. Consequently, it is now recognised that process improvement
techniques are very important. Currently, one of the most popular management
programs is lean management. Lean methodology originated at Toyota in
Japan and has been implemented by many major firms world wide. Lean aims
to continuously minimize waste (non-value-added activities) to maximize flow.
The driving force behind the development of lean management was the
elimination of waste, especially in Japan, a country with few natural resources
(Arnheiter and Maleyeff, 2005).
Lean is a necessary but not a sufficient approach to analyzing production
system issues (Standridge and Marvel, 2006). Deficiencies in lean methodology
have caused problems in implementation of process improvement. Some of
these deficiencies are described as following (Standridge and Marvel, 2006):
(1) Variation such as customer demand, machine breakdowns and different
production schedules must be addressed in operating systems. While lean
methods acknowledge the need for inventory due to variation, no methods are
provided for computing how much is needed.
(2) A more thorough analysis of data is required. Since lean procedure only
computes average value of quantities, the results might be inaccurate or even
(3) Component interaction is not considered in lean approach.
(4) No validating methods are included in lean methodology, and without
validation approach, the results obtained from static models are doubtful.
(5) What's more, no tools are included in lean method to identify the best
solution among several future state alternatives.
To sum up, since lean is a deterministic method and it uses only descriptive
value stream maps to model production operations (Standridge and Marvel,
2006), it has limited the development of manufacturing operations, and caused
bottlenecks in further improvement.
1.2 MOTIVATION
The highlighted market competitiveness that challenging deficiencies or
limitations of lean methodology; has been the major motivating factor for this
research. This research is also valuable for further promoting applications of
lean. *
In order to compensate for the shortcomings of lean methodology, experts in
industry as well as academia scholars are looking for solutions. One possible
way is to embed simulation in lean projects.
Computer simulation is a technique that imitates the operation of a real-world
system as it evolves over time. Process simulation, often used to model
production and business processes in both the manufacturing and service
sectors, is referred to as discrete event simulation (DES) (El-Haik and Al-Aomar,
models. Such models have collectively been termed as discrete event dynamic
models (DEDM) or discrete event simulation (DES) in the literature.
Simulation modelling as an industrial engineering tool for system design and
improvement has undergone tremendous development in the past decade. This
can be pictured through the growing capabilities of simulation software tools
and the application of simulation solutions to a variety of real-world problems in
different business arenas (El-Haik and Al-Aomar, 2006). Ferrin, Miller and
Muthler (2005) explained that "simulation is complimentary with Lean
methodology. Simulation is a well designed capability that brings the statistically
robust solution and associated confidence to meet the customers' expectations
that a process will deliver at Lean Sigma quality levels." Crosslin (1995) stated
that "virtually all of the Fortune 50, a majority of the Fortune 1000 and military
planning units of all technologically advanced countries, use simulation rather
than subjective notions to make decisions about key manufacturing and
logistics process decisions. There are no good reasons why simulation should
not be used to aid decisions about key business processes. On the contrary,
there are numerous good reasons why simulation should be used for BPR."
“Simulation can be considered a worthwhile tool whenever we consider
changes where experience tells us that the outcome is in doubt or, that there
would be a considerable expense due to failure. Simulation can help you
mitigate your risk potential.” (http://leanandagile-mhc.com/Simulate.htm). A
number of case studies also show the great success of their combination (Bayle,
et al. 2001) (Abbas, et al. 2006) (Adams, et al. 1999) (Wang, et al. 2005)
(Bodner and Rouse, 2007) (Huang and Liu, 2005) (Lian and Van, 2007).
However, all the case studies available just make use of simulation in one or
several stages of the individual steps of lean methodology, while does not
explain systematically how simulation can be embedded into the lean projects,
or illustrate how to build a holistic framework or structure to embed simulation
into lean projects. The lack of integrity of the reference framework will in turn
greatly influent simulation application in lean projects. McClellan (2004) stated
that making an accurate simulation model is very difficult because of the
tremendous amount of factors in a normal manufacturing system.
While the use of modelling and simulation in manufacturing is steadily gaining
acceptance for certain applications (such as capacity planning), there is still a
long way to go before it is commonly applied for a multitude of other
applications (Rose 2004). Currently, the combination of simulation and lean has
not yet been widely adopted by industry, fear of their complexity, and
effectiveness. Enterprises do not know how much revenue it will cost and what
benefits can be brought by their integrity; such uncertainty has increased
concerns of the enterprises to adopt lean and simulation.
1.3 RESEARCH AIM AND OBJECTIVES
Research aim is to develop a reference framework which enables embedding of
simulation in lean projects.
Research objectives are listed below:
1. Conduct Literature Survey;
3. Establish role of simulation within the above framework;
4. Develop the reference framework to embed simulation;
5. Validate the reference framework.
A software toolkit is proposed, which integrates simulation and lean, and
accomplishes being a very comprehensive optimization framework about
embedding simulation into Lean projects.
1.4 THESIS STRUCTURE
This research thesis is composed of seven chapters. Chapter one describes
research background, motivation, aim and objectives and thesis structure.
Chapter two provides literature review and critical assessment of related work in
lean manufacturing and DES (discrete event simulation) methodology, and
summarizes the research gap.
Chapter three describes the research methodology adopted for the research
study.
Chapter four presents the overall framework of embedding simulation in lean
projects. The proposed SimLean framework contains seven stages, which cover
the whole project cycle from "qualify need for simulation" to "post
implementation".
Chapter five explains the development of a customised simulation environment,
which has simplified, facilitated and standardized model building process for
lean projects.
Chapter six presents the evaluation process of the proposed system. Through
five case studies discussed in Chapter six, the customised simulation
environment is validated and its limitations are pointed out.
Chapter seven contains discussions and conclusions of the overall research
work. It also highlights the limitations of the research work and recommended
2
LITERATURE REVIEW
In previous chapter the research aim and objectives have been explained. In
this chapter, the literature review has been presented and the literary
contributions towards lean manufacturing and simulation integration have been
provided. The main aim of this chapter is to examine the academic literature
review on the subject of lean manufacturing, DES (discrete event simulation)
and their combination, in order to discover the research gaps and collect
information for research design.
In order to achieve the above aim, this chapter has been structured as follows:
Section 2.1 introduces the history and principles of lean manufacturing; Section
2.2 outlines the available tools used in lean manufacturing; VSM (value stream
mapping) is described in Section 2.3 because of its unique capability to
visualise a whole and complex manufacturing system and represent the
materials and information flow within a facility (Rother and Shook, 1999) and
(Tapping, et al. 2002); Shortcomings of lean manufacturing tools are stated in
Section 2.4; In Section 2.5, simulation applications in lean projects are
described; Section 2.6 presents and discusses the critical assessment of the
overall literature review; At last, Section 2.7 provides conclusion to the literature
review exercise.
2.1 LEAN METHODOLOGY
In the last ten years or so, a new term "lean" has entered our vocabulary.
Executives and decision makers, especially in senior management, quality,
operations, engineering, and human resources have been hearing of lean in a
Lean is a manufacturing or management philosophy that shortens the lead time
between a customer order and the shipment of the parts or services ordered
through the elimination of all forms of waste. Lean helps firms in the reduction of
costs, cycle times, and non-value-added activities, thus resulting in a more
competitive, agile, and market-responsive company (Aliikal and Manos, 2006).
There are many definitions of lean. For instance, here is one that is used by the
Manufacturing Extension Partnership of National Institute of standards and
Technology, a part of the U.S. Department of Commerce: "A systematic
approach in identifying and eliminating waste (non-value-added activities)
through continuous improvement by flowing the product at the pull of the
customer in pursuit of perfection." Lean focuses on value-added expenditure of
resources from the customers' viewpoint. Another way of putting it would be to
give the customers: what they want; when they want it; where they want it; at a
competitive price; in the quantities and varieties they want, but always of
expected quality (Alukal and Manos, 2006).
A planned, systematic implementation of lean leads to improved quality, better
cash flow, increased sales, greater productivity and throughput, improved
morale, and higher profits. Once started, lean is a never-ending journey of ever-
improving processes, services, and products. Many of the concepts in total
quality management and team-based continuous improvement are also
common to the implementation of lean strategies (Alukal and Manos, 2006).
2.1.1 BRIEF HISTORY OF LEAN
engineers Taiichi Ohno and Shigeo Shingo (Inman, 1999). However, most of
the lean concepts are not new. Many of them were being practiced at Ford
Motor Company during the 1920s or are familiar to most industrial engineers
(Alukal and Manos, 2006). Ohno greatly admired and studied Ford because of
his accomplishments and overall reduction of waste at early Ford assembly
plants (Hopp and Spearman, 2001). The TPS is also credited with being the
birthplace of just-in-time (JIT) production method, a key element of lean
production, and for this reason the TPS remains a model of excellence for
advocates of lean management (Arnheiter and Maleyeff, 2005).
A few years after World War II, Eiji Toyoda of Japan's Toyota Motor Company
visited the American car manufacturers to learn from them and to transplant U.S.
automobile production practices to the Toyota plants. With the eventual
assistance of Taiichi Ohno and Shigeo Shingo, the Toyota Motor Company
introduced and continuously refined a system of manufacturing whose goal was
the reduction or elimination of non-value-added tasks (activities for which the
customer was not willing to pay). The concepts and techniques that go into this
system are now known as Toyota Production System (TPS), and were recently
reintroduced and popularized by James Womack's group in the United States
under the umbrella of lean manufacturing (Alukal and Manos, 2006).
Lean concepts are applicable beyond the shop floor. Companies have realized
great benefit by implementing lean techniques in the office functions of
manufacturing firms, as well as in purely service firms such as banks, hospitals,
and restaurants. Lean manufacturing in this context is known as lean enterprise
(Alukal and Manos, 2006).
2.1.2 BASIC PRINCIPLES OF LEAN
Among the several quality management concepts that have been developed,
the lean concept, as in lean manufacturing, lean production, et al. is one of the
most wide-spread and successful attempts. Briefly, lean is about controlling the
resources in accordance with the customers' needs and to reduce unnecessary
waste, including the waste of time (Andersson, etal. 2006). •
Lean principles are fundamentally customer value driven, which makes them
appropriate for many manufacturing and distribution situations. Five basic
principles of lean manufacturing are generally acknowledged (Womack and
Jones, 1996) (Curry and Mclvor, 2001):
1. Understanding customer value. Only what the customers perceive as
value is important.
2. Value stream analysis. Having understood the value for the customers,
the next step is to analyse the business processes to determine which ones
actually add value. If an action does not add value, it should be modified or
eliminated from the process.
3. Flow. Focus on organising a continuous flow through the production or
supply chain rather than moving commodities in large batches.
4. Pull. Demand chain management prevents from producing commodities
to stock, i.e. customer demand pulls finished products through the system. No
5. Perfection. The elimination of non-value-adding elements (waste) is a
process of continuous improvement. There is no end to reduce time, cost,
space, mistakes, and effort.
Lean is especially important today as a winning strategy. Some key reasons are
listed below (Alukal and Manos, 2006):
1) To compete effectively in today's global economy
2) Customer pressure for price reductions
3) Fast-paced technological changes
4) Continued focus by the marketplace on quality, cost, and on-time delivery
5) Quality standards such as TS 16949:2002 and ISO 9001:2000
6) Original equipment manufacturers (OEM) holding on to their core
competencies and outsourcing the rest
7) Higher and higher expectations from customers
8) The need for standardized processes so as to consistently get expected
results
To compete successfully in today's economy we need to be at least as good as
any of our global competitors, if not better. This goes not only for quality, but
also for costs and cycle times (lead time, processing time, delivery time, setup
time, response time, and so on). Lean emphasizes teamwork, continuous
training and learning, production to demand (pull), mass customization and
batch-size reduction, cellular flow, quick changeover, total productive
maintenance, and so on. Not surprisingly, lean implementation utilizes
continuous improvement approaches that are both incremental and
breakthrough (Alukal and Manos, 2006).
2.1.3 THE EIGHT WASTES OF LEAN
Waste of resources has direct impact on our costs, quality, and delivery.
•Conversely, the elimination of wastes results in higher customer satisfaction,
profitability, throughput, and efficiency. Excess inventory, unnecessary
movement, untapped human potential, unplanned downtime, and suboptimal
changeover time are all symptoms of waste (Alukal and Manos, 2006).
Taiichi Ohno, a former executive at Toyota, identified seven categories of waste.
Many in the Lean community consider there to be an eighth category --
Underutilized People -- that can have significant importance to the development
process. The eight categories of waste are explained as follows (Locher, 2008):
1) Overproduction. In overproduction, organizations product more information
or provide greater service than is needed, sooner than is needed either by
the next process step or by the end user or customer. The impetus behind
overproduction is the impulse to "stay ahead." Although this reasoning is
commendable, it creates other problems and other wastes. For example,
information is more subject to changes and can even become out-of-date if it
is processed too early.
2) Excess Inventory. Excess inventory is more than the absolute minimum
required to maintain uninterrupted flow of information or service. People will
often "batch" development activities. Most often they do so because they
believe that it is more efficient. Sometimes there are real reasons to batch
such practices need to be addressed in order to allow for more flexible
processing.
3) Defective product or service. This type of waste refers to the discovery and
correction of information or a service that has been processed incorrectly or
is missing altogether. The correction and clarification of information as it
flows through a company can require tremendous effort and cost. To counter
this unnecessary expenditure of resources and effort, organizations must
address the root causes for the lack of complete and accurate information.
Information or service "defects” simply cannot be allowed to continue and
become the norm in any company.
4) Over processing (or Non-Value-Added - NVA). NVA occurs when teams
expend extra effort beyond what is actually needed by the customer. Extra
steps or entire processes within the development process fall into this
category, including many of the administrative activities performed in support
of the development process. While it may not be possible to eliminate them
all, at the very least, the amount of time and effort to perform them can be
reduced.
5) Waiting. Information or services can wait for numerous reasons, thereby
impeding flow. To reduce the likelihood of this type of waste, organizations
must focus on the necessary information itself or on the customer, not on the
people performing the work. People can generally keep busy at all times.
However, if a customer has to wait beyond an acceptable time frame,
customer satisfaction will decline. If, for whatever reason, information must
wait, other problems will arise, such as declines in customer service or a rise
in quality-related issues.
6) Excess Motion. Although organizations rarely consider this category when
looking for ways to trim waste, excess motion by employees in the course of
their work can, in fact, be a significant waste category. For example, if
employees need to consistently travel to different parts of thp. huilding_in.
order to reach necessary supplies, they are likely to be less efficient and
less productive than they would be if the supplies were within easy reach.
7) Transportation. Transportation refers to the movement of information or a
service, either manually or electronically. Although it requires little physical
effort, even the electronic transportation of information can be considered
wasteful. This issue with transportation waste is not solely the time required,
but the other problems that arise with each transfer. For example, the
potentia' for information to end up in another queue waiting to be processed
increases with each transfer, as does the potential to lose information.
Quality tends to decline with each transfer of information.
8) Underutilized People. In this instance, staff members are not using their full
skills and abilities. People are often given very limited roles and
responsibilities when, in reality, they can assume much more if the process
has been designed effectively. ,
Although most people are now familiar with these waste terms, they may still
have difficulty in recognizing them in the development process, and some have
contended that the terms do not apply to the development process at all.
Regardless of whether an organization develops a product, a process, or a
service, these terms are, in fact, all applicable. Going Lean requires that people
expand their exiting, sometimes narrow, definitions for these now-common
To assist the Lean practitioner in developing "eye for waste," Table 2-1 provides
selected examples for each waste category. It is important to note that the eight
wastes are fundamentally interrelated and may overlap; in other words, the
examples below may fit into more than one category (AlukaLand Manos,
2006)^-Table 2-1 Development Waste Examples
Waste Types Explanations
Overproduction Completing design elements that are not needed for some
time; Including features that the customer does not see as a
value (could also be included in nonvalue-added or over
processing waste); "Over-engineering".
Waiting Approvals from superiors; A lack of available capacity; Input
from customers; System response time; Completion of
other design elements.
Transportation E-mailing information.
Multiple hand-offs; Report distribution; Circulating
paperwork for signatures.
Nonvalue-Added
Processing
(or Over
processing)
Re-entering data; Extra copies; Unnecessary or excessive
reports or paperwork; Redesigning something that already
has been designed (i.e., reinventing the wheel); Most
engineering support services.
Excess Inventory Filled in-boxes (electronic or paper); Batch processing
transactions; "Large" design releases; Retaining documents
beyond what is required.
Defects
(or Correction)
Design errors; Service failures; Engineering change orders
due to errors; Not clearly understanding customer needs;
Waste Types Explanations
Missing or incomplete information.
Excess Motion Going to / from printer, fax machine, central filing, and
m p p f i n n c - Travel
---Underutilized
People
Limited authority and responsibility for basic tasks;
Management "command and control"; Not sufficiently
sharing knowledge; Not involving suppliers early in the
development process; Not involving manufacturing early in
the development process.
2.1.4 LEAN IMPLEMENTATION ROADMAP
Knill (1999) states that five initiatives are necessary for a successful
implementation of Lean Manufacturing:
1. Supplier programs;
2. Continuous improvement;
3. Flexibility;
4. Eliminate waste;
5. Zero defects.
LM (Lean Manufacturing) is the umbrella over these concepts, and while many
companies often grasp a couple of these concepts, the full potential of a
^ Start ^
Figure 2-1 Structure of Lean Manufacturing Implementation
Achanga (2007) proposed a framework for assessing the impacts of
implementing lean manufacturing within small-to-medium sized manufacturing
firms (SMEs). By assessing the impact of lean implementation, SMEs can make
informed decisions on the viability of lean adoption at the conceptual
implementation stage. Companies are also able to determine their status in
terms of lean manufacturing affordability. Figure 2-1 shows the structure of lean
implementation developed by Achanga (2007):
Firstly, qualify need for lean, which means to decide whether or not to use lean
methods for the projects. A company can carry out investigations of its current
manufacturing issues to identify the issues or problems that its business faces.
If results of this phase are not conclusive, the project may be reassessed or
abandoned completely.
Secondly, the leadership commitment is essential for the success of the
projects. If the company is intending to apply lean for the first time, its
requirements for lean consultancy and training may be huge. It needs full
support from the leadership to start the project.
Then the project team and time scale need to be decided. If the company
cannot find someone who knows the work in the company and understands
lean concept at the same time, it may abandon the project completely, or revise
it again.
Phase four is the financial impact assessment, which aims to calculate the
possible outcomes of the lean project. The assessment result will be referenced
by managers to make decisions. If managers are not satisfied with the possible
financial gains, the company may abandon the project completely or revise it.
Next step is pre-implementation, where project team members measure the
problems in current state as well as design the future state.
At implementation stage, changes should be made according to the plans made
in pre-implementation step. Changes to the system are made according to the
detailed design of future state.
After implementation process, the project team need to summarize their work,
and write up reports and documentations at post-implementation stage.
2.2 LEAN MANUFACTURING TOOLS
The tools and techniques used to introduce, sustain, and improve the lean
system are sometimes referred to as the lean building blocks. Many of these
example, 5S (workplace organization and standardization), visual controls,
point-of-use storage (POUS), standard work, streamlined layout, working in
teams, and autonomous maintenance (part of total productive maintenance)
can all be constituents of lean tools. The building blocks are introduced as
follows: (Alukal and Manos, 2006):
2.2.1 5S
A system for workplace organization and standardization. The five steps that go
into this technique all start with the letter S in Japanese (seiri, seiton, seison,
seiketsu, and shitsuke). These five terms are loosely translated as sort, set in
order, shine, standardize,' and sustain. Achanga (2007) stated, that the 5S
approach is not simply a system for house keeping; but a method for organising,
standardising and improving the whole of a manufacturing process. The sole
objective of the technique is to ensure total eradication of unwanted items within
the working environment of an organisation.
2.2.2 VISUAL CONTROLS
The placement in plain view of all needed information, tools, parts, production
activities, and indicators so that everyone involved can understand the status of
the system at a glance.
The intent of a visual factory is that the whole workplace is set-up with signs,
labels, colour-coded markings, etc. so that anyone unfamiliar with the process
can, in a couple of minutes, know what is going on, understand the process,
and know what is being done correctly and what is out of place.
A visual factory is made up of visual displays and visual controls. Visual
displays and controls help keep things running as efficiently as they were
designed to run. Sharing information through visual tools helps keep production
running smoothly and safely. Shop floor teams are often involved in devising
and implementing these tools through 5S and other improvement activities.
Visual controls describe workplace safety, production throughput, material flow,
quality metrics, or other information. Visual controls supply the feedback to an
area, much the same way that SPC (statistical process control) can give
process feedback to the operator running a particular operation.
A visual display relates information and data to employees in the area. For
example, charts show the monthly revenues of the company or a graphic
depicting a certain type of quality issue that group members should be aware of.
The efficient design of the production process that results from lean
manufacturing application carries with it a set of assumptions. The process will
operate as it was designed as long as the assumptions hold true. A factory with
expansive visual controls and displays will allow employees to immediately
. know when one of the assumptions has not held true.
Audio signals in the factory are also very important because they signal
malfunctioning equipment, sound warnings before the start of machine
operation, or other useful information.
A visual factory allows the people operating the process to stay on target.
2.2.3 STREAMLINED LAYOUT
A layout designed according to optimum operational sequence.
2.2.4 STANDARD WORK
Consistent performance of a task, according to prescribed methods, without
waste and focused on human movement (ergonomics).
2.2.5 BATCH-SIZE REDUCTION
The best batch size is one-piece flow, or “makes one and move one”. If one-
piece flow, is not appropriate, reduce the batch to the smallest size possible.
2.2.6 TEAMS
In the lean environment, the emphasis is on working in teams, whether it is
process improvement teams or daily work teams.
2.2.7 QUALITY AT THE SOURCE
This is inspection and process controlled by employees so they are certain that
the product or information that is passed on to the next process is of acceptable
quality.
2.2.8 POINT-OF-USE STORAGE
Raw materials, parts, information, tooling, work standards, supplies, procedures,
and so on, are stored where needed.
2.2.9 QUICK CHANGEOVER
The ability to change tooling and fixtures rapidly (usually in minutes) to enable
multiple products in smaller batches can be run on the same equipment.
2.2.10 PULL/KANBAN
A system of cascading production and delivery instructions from downstream to
upstream activities in which the upstream supplier does not produce until the
downstream customer signals a need (using a kanban system).
2.2.11 CELLULAR/FLOW
Physically linking and arranging manual and machine process steps into the
most efficient combination to maximize value-added content while minimizing
waste. The aim is single-piece flow.
2.2.12 TOTAL PRODUCTIVE MAINTENANCE (TPM)
A lean equipment maintenance strategy for maximizing overall equipment
effectiveness. Achanga (2007) states that Total Productive Maintenance (TPM)
is a brainchild of Preventive Maintenance (PM), and works identically to Total
Quality Management (TQM). The idea behind TPM is that of having zero
tolerance at breakdowns as well as defects. This production technique is very
central to the lean manufacturing ethos since it has the attributes of making
problems visible so that they are not buried but dealt .with right away. TPM also
calls for simplicity in the tasks people carry out as well, allowing the workforce
enjoyment while carrying out work they are assigned to do. The essence of
implementing the lean manufacturing technique of TPM is the provision of a
2.2.13 OTHER TOOLS
Besides these building blocks, there are other concepts or techniques that are
equally important in lean: value stream mapping (VSM), just-in-time (JIT)
methods, error-proofing (poka-yoke), autonomation (jidoka), change
management, root cause analysis and problem solving, Kaizen (continuous
improvement) and policy deployment (hoshin planning). Since lean is a never-
ending journey, there is always room for continuous improvement.
2.3 VSM (VALUE STREAM MAPPING)
In "Lean Thinking (1996)", James Womack and Daniel Jones identified the
three critical management tasks of any business:
1) Problem solving (e.g., product or service design)
2) Information management (e.g., order processing and other transactional
activities)
3) Physical transformation (e.g., converting raw materials to finished product)
The authors define a value stream as the set of all specific actions required to
bring a specific product or service throughout the critical management tasks.
Clearly, there is a strong relationship among the three. For example, a product
design that is difficult to build will negatively impact the "physical transformation"
value stream. Also, poor information management from the market will
negatively impact the "problem solving" value stream. Therefore, in
manufacturing, all three tasks ultimately must be addressed.
The original Lean concept of "flow" dates back to around 1910 and is attributed
primarily to Henry Ford. Toyota, however, is credited with taking Ford's original
flow concepts to the next level, with diversified small lot production. While not
specifically using the term “Lean”, Toyota has applied Lean concepts for more
than fifty years to its production and product development systems and is widely
recognized as the leader in the application of Lean thinking. In 1990, James
Womack and Daniel Jones documented the success of the Toyota Production
System (TPS) in "The Machine that Changed the World". Womack and Jones
went on to demonstrate that it represented a fundamentally different way of
thinking about processes, systems, and organizations as a whole when they
published "Lean Thinking" in 1996 (Locher, 2008).
But, what is still missing from the literature is a "how-to" book. How can
organizations get their arms around an often poorly defined existing
development process and redesign it based on the concepts of Lean thinking?
To start, they need a reference to guide them through a step-by-step
methodology that they can apply, in a real-time, practical way, to their own
development processes (Locher, 2008).
Why do we use value stream mapping as the methodology? Value stream
mapping is a method of visualizing the flow of a service, a product, or
information. It provides a system's view of the flow of work, involving multiple
processes, that goes well beyond traditional process mapping techniques.
Through the use of symbols or icons, it conveys a great deal of information in a
succinct manner. Also it incorporates process and system-related data to further
mapping is the assessment and planning tool of Lean practitioners, and an
enabling tool to apply Lean thinking (Locher, 2008).
2.3.1 ADVANTAGES OF VSM
The true power of value stream mapping lies not in visually depicting the current
state of a process, but rather in the actions that are taken and the results
achieved by doing so. In other words, the power of the process lies in
developing achieved "future states" that provide breakthrough results to an
organization (Locher, 2008). Rother and Shook (1999) states that value stream
mapping (VSM) is an easy technique to visualise a whole and complex
manufacturing system, identify wastes and their sources and guide
improvement efforts. The core of VSM consists of the definition of an actual
state map (ASP) being a graphical representation of both materials and
information flow within a facility (Tapping et al. 2002). The capability to track an
order throughout the facility and to measure how long it remains in one place is
extremely useful, because it allows to uncover the roadblocks in product flow
and to understand the 'root causes' of waste. Therefore, VSM helps, to
streamline work process using lean concepts and to evaluate the improvements
that are obtainable through lean manufacturing. These objectives are usually
formalised in a future state map (FSM), which represents the ideal pull
production system to be obtained (Braglia, et al. 2009).
With respect to other mapping techniques, VSM offers several advantages
(Braglia, et al. 2009):
1). It shows the linkage between product flow and information flow;
2). It includes information related to production time as well as to inventory
levels;
3). It helps to visualise the production process at the plant level, not just at
the single process level;
4). It relates the manufacturing process internal to the facility to the whole
supply chain;
5). It links products planning and demand forecast both to production
scheduling and to flow shop control, using operating parameters such as Takt
Time, which determines the production rate at which each processing stage in
the manufacturing system should operate;
6). It makes decisions about the flow evident, enabling people to discuss
them;
7). It gives managers and employees the same tool and a common
language to communicate;
8). It constitutes the basis of a well-structured implementation plan.
2.3.2 PROCESS MAP FOR VSM (Locher, 2008)
As with all tools, there is a recommended process for using value stream
mapping (Figure 2-2). The first step in the process -- the "preparation" step - is
critical to conducting an effective value stream mapping event, and to the
successful implementation of the envisioned "future state"; the preparation step
occurs before the mapping event itself. During the preparation step, the team
Next, this team develops the "current state" - a visual, agreed upon depiction of
how things work today. The team then develops the future state - their shared
vision of a new, lean development process. Finally, there is the "planning and
implementation" step.
- Identifying the mapping team, the product or project to study, and how the project or product will be mapped.
- Agreeing on a well understood map of the current situation.
- Agreeing on a shared vision of a lean development process.
- Developing a plan to achieve the future state.
Figure 2 -2 Process Map for VSM
The ultimate goal to value stream mapping is to achieve the future state and to
realize the expected benefits. The typical duration of the mapping event is three
days, including the development of the current state, the future state, and a
detailed implementation plan. Obviously, implementation will occur after the
event, over a one - to twelve-month period of time (Locher, 2008).
2.4 SHORTCOMINGS OF LEAN MANUFACTURING TOOLS
Value Stream Mapping (VSM) has become an integrated and essential
technique in lean projects; it combines material processing steps with
information flow as well as other important related data (Tony Manos, 2006).
However, being a static method, VSM has many limitations such as its inability
to assess the effects of variation, to validate effects of proposed changes before
interactions between system components (Standridge and Marvel, 2006).
Braglia, et al. (2009) summarizes the main drawbacks of VSM as follows:
1. It is a paper- and pencil-based technique, thus the accuracy level is
limited and the number of versions that can be handled is low;
2. It lacks the spatial structure of the facility layout and how that impacts
interoperation material handling delays;
3. It fails to show the impact of inefficient material flows on work in process
(WIP), order throughput and operating expenses;
4. It cannot address the complexity of high-variety low-volume type
companies, whose value streams are composed of hundreds of industrial parts
and products;
5. It can be effectively applied only to linear product systems, as it fails to
map value streams characterised by multiple flows merging together;
6. It lacks the capability for a rapid development and evaluation of multiple
what-if analyses that are required to prioritise different alternatives;
7. It cannot be applied to engineering processes due to fundamental
differences between manufacturing and engineering methods;
8. It is unable to give a real vision of the variability problems concerning the
production process analysed.
From literature review we find out that by embedding simulation in VSM, it may
be possible to overcome some of these limitations. However, so far there has
reference framework about embedding simulation in lean projects (especially in
VSM tool) is proposed in this thesis.
2.5 SIMULATION APPLICATION IN LEAN PROJECTS
2.5.1 SIMULATION CLACIFICATIONS
Computer simulation models can be classified in several ways (Rubinstein,
1998), (Law and Kelton, 1991), (Banks, et al. 2001) and (Zeigler, et al. 2000):
1. Static versus Dynamic Models: Static models are those that do not evolve
overtime. In contrast, dynamic models represent the behaviour of systems over
time.
2. Deterministic versus Stochastic Models: Models that incorporate at least a
single random variable in the representation of the model are termed stochastic
models, while models that incorporate non random (deterministic) variables
exclusively in their representation are termed deterministic models.
3. Continuous versus Discrete Models: Models can also be classified in the way
the notion of time is handled. In continuous models the state of the model
changes continuously with respect to time. Continuous models generally
employ a system of differential or difference equations to express a model of a
particular system. Examples of continuous models include models of air flow on
aircraft wings, models of chemical reactions and system dynamics models, etc.
Simulations of these models are performed by solving the differential equations
either on an analogue computer or digital computer. On the other hand, discrete
models update their state instantaneously at a finite number of discrete points in
time. The manner in which the state is transformed is expressed using a logical
state transition function as opposed to mathematical equations. Simulation is
performed by employing discrete event simulation software on a digital
computer. Discrete event models are usually used in the modelling of queuing
network systems such as manufacturing systems, etc.
This thesis deals only with discrete, dynamic and stochastic simulation models.
Such models have collectively been termed as discrete event dynamic models
(DEDM) or discrete event simulation (DES) in the literature.
2.5.2 DES (DISCRETE EVENT SIMULATION) MODELLING
Banks (1998) stated that process simulation, often used to model production
and business processes in both the manufacturing and service sectors, is
referred to as discrete event simulation (DES). Discrete event systems are
dynamic systems that evolve in time by the occurrence of events at possibly
irregular time intervals, since this resembles the nature of the majority of real-
world applications. Examples include traffic systems, manufacturing systems,
computer communication systems, call centres, bank operations, hospitals,
restaurants, production lines, and flow networks. Most of these systems can be
modelled in terms of discrete events whose occurrence causes the system to
change from one state to another in a stochastic manner.
Law and Kelton (1991) stated that by utilizing computer capabilities in logical
programming, random generation, fast computations, and animation, DES
modelling is capable of capturing the characteristics of a real-world process and
estimating system performance measures at different settings of its design
parameters. System modelling with DES includes mimicking the structure,
in a DES model. Figure 2-3 shows the elements of system modelling with DES.
Abstracting the real-world system in a DES model can be approached by
precise understanding and specification of the details of the five system
modelling elements shown in Figure 2-3.
Data
Structure
Real-World
System Logic
Layout
Statistics
DES System Model '
Figure 2- 3 Elements of System Modelling with DES
1). System Data: Real-world systems often involve a tremendous amount of
data while functioning. Data collection system (manual or automatic) are often
used to collect critical data for various purposes, such as monitoring of
operations, process control, and generating management reports. DES models
are data-driven; hence, pertinent system data should be collected and used in
the model. Model performance and results are highly dependent on the quality
and accuracy of such data, based on the commonly used term garbage-in
garbage-out. Table 2-2 presents the data that need to be collected for modelling
various simulation elements.
Table 2- 2 Data Collected for Various DES Elements
Element Modelled Pertinent Simulation Data
Machine (Load, cycle, unload) time, MTBF, MTTR
Conveyor Speed, capacity, type, accumulation
Operator Walk speed, work sequence, walk path
Element Modelled Pertinent Simulation Data
Buffer Capacity, discipline, input / output rules
Automated guided vehicle Speed, acceleration / deceleration, route
Power-and-free system Speed, dog spacing, chain length
Part / load Attributes of size, colour, flow, mix
2). System Structure: A system DES model is expected to include the
structure of the actual system being simulated. This structure is basically the set
of system elements in terms of physical components, pieces of equipment,
resources, materials, flow lines, and infrastructure. Elements of a manufacturing
system are different from the elements of a business system. Whereas
manufacturing systems are modelled using machines, labour, work pieces,
conveyors, and so on, business systems are modelled using human staff,
customers, information flow, service operations, and transactions. Modelling
such elements thoroughly is what makes a model realistic and representative.
However, the level of details and specifications of model structural elements
depends primarily on the objective and purpose for building the model. Table 2-
3 shows examples of structural elements for a plant or a manufacturing system.
Table 2- 3 Examples of Structural Elements in DES
Structural Element Modelled Model Performance Factor Affected
Conveyor length Conveyor Capacity
Unit load dimensions Number of units stacked
Buffer size Buffer capacity
Length of aisles and walkways Walking distance and time
Size of automated guided vehicle AGV Number of AGV carriers
Length of monorail Carrier travelling time
Dog spacing of power and free system Power and free throughput
3). System Logic: System logic comprises the rules and procedures that
govern the behaviour and interaction of various elements in a simulation model.
It defined the relationships among model elements and how entities flow within
a system. The programming capability of simulation languages is often utilized
to implement the system logic designed into the DES model developed.
Similarly, real-world systems often involve a set of simple or complex logical
designs that control system performance and direct its behaviour. Abstracting
relevant logic into , a DES model is a critical modelling task. In a typical
simulation model, it is often the case that several decision points exist within the
model operations, such as splitting and merging points. At these decision points,
certain scheduling rules, routing schemes, and operational sequences may
need to be built into the DES model to reflect the actual performance of the
underlying system. Table 2-4 provides examples of such logical designs.
Table 2- 4 Examples of Model Logical Designs
Model Activity Logical Design
Parts arriving at loading dock Sorting and inspection scheme
Requesting components Model mix rules
Producing an order Machine scheduling rules
Material handling Carrier routing rules
Statistical process control Decision rules
Machining a part Sequence of operation
Forklift floor operation Drivers' dispatching rules
Storage and retrieval system (AS / RS) AS / RS vehicle movement rules
4). System Layout: A system layout is simply the configuration plan for a
system's structural elements. The layout specifies where to locate pieces of
equipments, aisles, repair units, material-handling systems, storage units,
loading and unloading docks, and so on. Similar to system structure, placing
and sizing model elements according to the layout specified results in a more
representative DES model. Sticking to layout specifications helps capture the
flow path of material or entities within the system. When designing new systems
or expanding existing ones, the layout often plays an important role in
assessing design alternatives. Facility planning is the topic under which the
layout of a plant or a facility is designed. Department areas and activity-
relationship charts are often used to provide a design for a facility layout.
Locations of departments, distances between them, and interdepartmental flow
need to be captured in the DES model to provide accurate system
representation.
5). System Statistics: System statistics are means of collecting run-time
information and data from a system during run time and aggregating them at the
end of simulation run time. During run time, such statistics are necessary to
control the operation and flow of system activities and elements. At simulation
end, these statistics are collected to summarize system performance at various
system design and parameter settings. In a system DES model, therefore,
statistics are collected and accumulated to provide a summary of results at the
end of run time. Such statistics are used to model real-time monitoring gauges
and clocks in a real-world system. Because of model flexibility, however, some
statistics that are used in the model may not actually be in the real-world system.
This is because statistics do not affect model performance. Therefore, we can
define statistics that are necessary to system operation and other statistics that
may provide useful information during run time and summarize the results at the
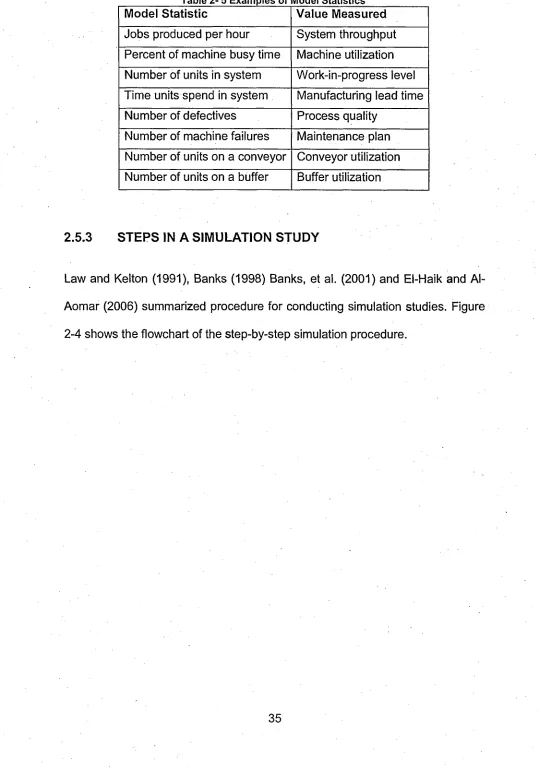
Table 2- 5 Examples of Model Statistics
Model Statistic Value Measured
Jobs produced per hour System throughput
Percent of machine busy time Machine utilization
Number of units in system Work-in-progress level
Time units spend in system Manufacturing lead time
Number of defectives Process quality
Number of machine failures Maintenance plan
Number of units on a conveyor Conveyor utilization
Number of units on a buffer Buffer utilization
2.5.3 STEPS IN A SIMULATION STUDY
Law and Kelton (1991), Banks (1998) Banks, et al. (2001) and El-Haik and Al-
Aomar (2006) summarized procedure for conducting simulation studies. Figure
2-4 shows the flowchart of the step-by-step simulation procedure.
Figure 2- 4 The Simulation Procedure
1). Problem Formulation: The simulation study should start with a concise
definition and statement of the underlying problem. The problem statement
includes a description of the situation or the system of the study and the
problem that needs to be solved. Formulating a design problem includes stating
the overall design objective and the constraints on the design process. Similarly,