Validation of the aerodynamic loading on basic flying disc
geometries derived from CFD simulations
POTTS, Jonathan R. <http://orcid.org/0000-0001-8192-0295> and MASTERS,
Dominic
Available from Sheffield Hallam University Research Archive (SHURA) at:
http://shura.shu.ac.uk/11092/
This document is the author deposited version. You are advised to consult the
publisher's version if you wish to cite from it.
Published version
POTTS, Jonathan R. and MASTERS, Dominic (2015). Validation of the aerodynamic
loading on basic flying disc geometries derived from CFD simulations. Procedia
Engineering, 112, 400-405.
Copyright and re-use policy
See http://shura.shu.ac.uk/information.html
Procedia Engineering 112 ( 2015 ) 400 – 405
1877-7058 © 2015 The Authors. Published by Elsevier Ltd. This is an open access article under the CC BY-NC-ND license (http://creativecommons.org/licenses/by-nc-nd/4.0/).
Peer-review under responsibility of the the School of Aerospace, Mechanical and Manufacturing Engineering, RMIT University
doi: 10.1016/j.proeng.2015.07.215
ScienceDirect
7th Asia-Pacific Congress on Sports Technology, APCST 2015
Validation of the Aerodynamic Loading on Basic Flying Disc
Geometries derived from CFD Simulations
Jonathan R. Potts
a*, Dominic Masters
baDepartment of Engineering & Maths, Faculty of ACES, Sheffield Hallam University, Sheffield, S1 1WB. U.K. bDepartment of Aerospace Engineering, University of Bristol, Queen’s Building, University Walk, Clifton. BS8 1TR. U.K.
Abstract
The present study in spin stabilised disc aerodynamics builds on previous experimental wind tunnel work to broaden the knowledge base through CFD simulation without the necessity for high facility or time cost. The current experimental database from previous studies is extensive enough for sufficient validation to be conducted on known geometries. From there, the limitations of CFD studies for this application on such complex highly separated bluff body flows can be understood. All of the results are for non-spinning discs to reduce computational time, this step is justifiable as the spinning case has previously been shown to have minimal effect on the aerodynamic loads at typical throw release spin rates. The work builds CFD simulation cases carefully and systematically starting with cylindrical discs with thickness to chord (diameter) ratio of 0.01 and 0.1, then to introduce a cavity to one flat side analogous to the Frisbee disc, before moving to look at a generic discus geometry from field athletics. The aerodynamic loading results compare very well to experimental data for the low angle of attack range, however, at higher angles of attack the CFD curves are divergent. It is possible that the generated mesh, for each geometry, does not capture the wake with enough resolution at high angles of attack, note that for sports disc applications the high angle of attack range is very important towards the end of the flight from a human throw. Therefore, further investigations are required to extend this initial study to a modified meshing regime with further refinement, prior to moving forward with any parametric design studies. © 2015 The Authors. Published by Elsevier Ltd.
Peer-review under responsibility of the School of Aerospace, Mechanical and Manufacturing Engineering, RMIT University.
Keywords: Spin-stabilised, sports disc, discwing, gyroscopic, aerodynamics, cfd.
* Corresponding author. Tel.: +44-114-225-6450; fax: +44-114-225-4249. E-mail address: [email protected]
© 2015 The Authors. Published by Elsevier Ltd. This is an open access article under the CC BY-NC-ND license (http://creativecommons.org/licenses/by-nc-nd/4.0/).
401
Jonathan R. Potts and Dominic Masters / Procedia Engineering 112 ( 2015 ) 400 – 405
1.Introduction
A number of research groups have utilised CFD simulations to investigate these complex external bluff body flows, dominated by boundary layer separation and high strength vortices in close-proximity, with some success. Seo et al [1,2] utilised CFD simulations powerfully coupled to a flight trajectory simulation to optimise the flight of a discus from field athletics. Lukes et al [3] applied various turbulence models to two disc geometries, over the low angle of attack range 0 to 15o, concluding k-ε most appropriate for these low aspect ratio bluff body external flows.
The present study investigates the most basic flying disc geometries from a thin flat plate of minimal thickness through added complication, firstly by increasing the thickness of the geometry such that the ratio to the chord (diameter) is an order of magnitude higher, then an underside cavity introduced to form a Frisbee-like shape. Lastly, a discus sports implement geometry satisfying the technical standards for use in the men’s competition [4].
All these four cases can be compared to relevant experimental data in the literature on which validation case assessments can be made. Kamaruddin [5] tested a number of parametric sets of simple geometries in the wind tunnel up to 15o angle of attack and Seo et al [2] tested a women’s discus geometry across the entire range of angles.
Hubbard & Cheng [6] also conducted a dynamic oscillation test to output the slope of the pitching moment curve. The focus of this paper therefore is to assess the validity of the CFD simulations for these basic disc shapes through comparison of the aerodynamic loading data with experimental data to assess the confidence in application of CFD output data to progress further flying disc related studies.
The axi-symmetric geometry of a flying disc dictates that, irrespective of the disc’s orientation to the free stream, the flow over the disc is independent of roll and yaw angle, meaning the flow speed, angle of attack and spin rate are the only parameters warranting investigation. Previous work by Potts & Crowther [7] established that the lift and drag characteristics were independent of Reynolds number Re and Advance (tip speed) ratio AdvR for typical flight speeds and spin rates, when launched from a human thrower. The implication of this is that non-spinning test cases yield sufficient accuracy for aerodynamic analysis. Furthermore, the tests conducted in the present study are entirely focused on static cases, both simulation and experiment, thus reducing computational time and setup complexity.
2.Methodology
2.1.Geometries
The set of axi-symmetric geometries were set up using ANSYS Design Modeler software, with diameters between 0.2 and 0.274m. Two flat plate models had thickness to chord (diameter) ratio t/c of 0.01 and 0.1. The frisbee-like geometry also had a t/c of 0.1, the cavity height hcav was 0.8 of thickness and cavity diameter ccav 0.9 of
Fig. 1. Cross-sectional profiles of disc geometry set, dimensions in mm.
chord. The discus geometry, symmetric about a central horizontal plane, was on the more streamlined edge of the competition rules [4] for the men’s throw with slightly larger diameter 0.219m. With a t/c of just over 0.2, the edge radius was 6mm blended tangentially to the inclined lifting surface, meeting the central circular plate of diameter ccc
50mm at an obtuse angled corner. The wind tunnel discus model was manufactured from aluminium at half scale with diameter just less than 0.11m. A diagram of the geometry set is included in Figure 1.
3 274
20
200
20 16
180 200 R6
50
207
2.2.Mesh Generation
Due to the symmetry of the problems considered, only half the domain was simulated for each case, a symmetry plane placed vertically along the centerline chord. The fluid domain was defined by the union of a quarter sphere of radius 7.5 (diameters) chord lengths, ahead of the disc geometry centre, and a half cylinder of 10 chord lengths, aft.
Unstructured, tetrahedral-dominant meshes were used for all simulations produced using ANSYS Meshing software, where the local density of nodes was increased in proximity to the geometry surface. A 5 layer thick inflation zone of triangular prisms was included for all cases except the flat plate (t/c = 0.01).
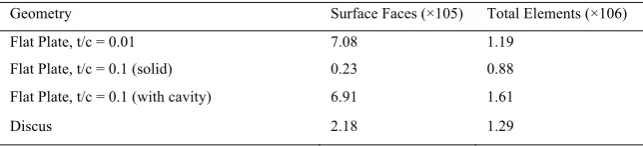
For each geometry, a series of meshes were created with resolutions up to approximately 2 million elements. Each mesh was then tested at an angle of attack of 20 degrees. The final mesh was then chosen based on, grid independence, agreement with experimental data and run-time efficiency. The chosen mesh was then used for all further flow variants. Central plane mesh cross-sections for the thicker flat plate t/c 0.1, cavity disc and discus are shown in Figure 2, mesh resolution statistics are shown in Table 1.
[image:4.544.48.490.223.369.2]
Fig. 2. Central plane mesh cross-section for flat plate t/c 0.1, cavity disc and discus.
Table 1. Mesh statistics.
2.3.Simulation
All simulations were completed with ANSYS Fluent v14.0 using the k-ω SST turbulence model. This model was used in order to help accurately predict areas of separation [8]. The inlet velocity was defined as 20m/s, with the turbulent inlet conditions derived from a turbulence intensity of 4% and the chord length c. The angle of attack was controlled using the inlet flow direction and the kinematic viscosity was defined as 1.4607×10⁻⁵. The simulations were run using the SIMPLE solver with first order spatial discretization for 800 iterations followed by a further 800 iterations with second order discretization. The drag, lift and pitching moment were then checked for convergence; further iterations were then performed if necessary.
2.4.Experiment
The discus wind tunnel model was a half scale men’s competition discus as defined above in section 2.1. The model was mounted on a 5mm rod fixed at the discus spin axis, the rod was fastened through a 12mm bar folded to a crank
Geometry Surface Faces (×105) Total Elements (×106)
Flat Plate, t/c = 0.01 7.08 1.19
Flat Plate, t/c = 0.1 (solid) 0.23 0.88
Flat Plate, t/c = 0.1 (with cavity) 6.91 1.61
[image:4.544.108.430.409.482.2]403
Jonathan R. Potts and Dominic Masters / Procedia Engineering 112 ( 2015 ) 400 – 405
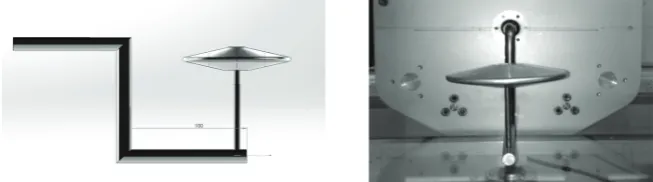
handle shape. This steel frame constituted a wind tunnel rig, shown in Fig. 3, to mount the discus model at the centre of the tunnel working section, dimensions 0.3m square and 0.6m in length. The discus model was tested in the TecQuipment (TQ) AF100 open loop subsonic wind tunnel. The aerodynamic loading acting on the discus, set horizontal at zero angle of attack, was measured via a TQ-AFA3 three component force balance, recording lift, drag and pitching moment via the designated TQ-VDAS data acquisition system at a rate of 2Hz. Around 60 data points were averaged for each set of stable conditions, namely wind speed and angle of attack. The discus model was tested over a range of Reynolds numbers Re from 0.38×10⁵ to 2.27×10⁵, corresponding to a speed range of 5m/s to 30m/s,
through an angle of attack range from -55° to 55°. Tare measurements, with the discus removed from the mounting, were taken across the angle of attack range; interference effects were not captured. The blockage ratio of the rig and model combined was 0.06 at zero degrees angle of attack, the data was not corrected for blockage.
[image:5.544.108.435.188.279.2]
Fig. 3. Set up of the discus and mounting in the wind tunnel (left) CAD model (right) installed in the working section.
3.Results and Discussion
3.1.Flat Plate
The lift, drag and pitching moment curves from CFD for the flat plate discs t/c 0.01 and 0.1 are shown in Fig. 4 for a Reynolds number Re of 3.78×10⁵ and 2.75×10⁵ respectively, equivalent to a flow speed of 20m/s and an AoA
(angle of attack) range of 0° to 40°. The linear lift curve (Fig. 4a) and parabolic drag (Fig. 4b) are typical of a low aspect ratio AR finite wing, generically AR is 4/π for a circular planform wing. The lift curves for both flat plates have slope 0.04 per degree through the zero AoA and the drag curve shows a minimum profile drag coefficient, CDo,
of 0.019 and 0.088 at the zero lift AoA, for plates with t/c 0.01 and 0.1, respectively. The pitching moment curves (Fig. 4c) are the torque about the half chord position, rather than the more conventional quarter chord position, as this is the location of the centre of gravity. Both pitching moment curves are non-linear across the range of angles tested; they both display positive coefficient values and positive linear gradients (nose up or leading edge up) at low positive angles of attack. The lift curves for t/c 0.01 and 0.1 diverge at 10o, the thicker of the two plates generating less lift for the higher angle of attack range. The drag curves increase proportionally for the low angle of attack range below 20o converging at 35o over the higher angle of attack range. The pitching moment curves diverge at 5o, the thicker of the two plates generating considerably less nose up pitching moment, around half that of the thinner plate at 15o AoA. These differences are all likely primarily driven by the pressure loading on the circumference of
each of the two cylinders with different heights i.e. flat plates with minimal thickness.
Experimental validation cases from wind tunnel test for both plates t/c 0.01 and 0.1 were derived from Kamaruddin [5] at a Reynolds number Re of 3.78×10⁵, plotted against the CFD data, for disc models with 0.2m
diameters, with remarkably good agreement for the low angle of attack range. The lift curve gradients and divergence at 10o match very well, both drag curves overlay well, the pitching moment curve gradients and divergence at 5o also match well. The range of angles of attack tested [5] however were only up to 15o. Wind tunnel
cases plotted [9]. It is also difficult to assess the apparent divergence of the two sets of experiments plotted [5,9], which were conducted with identical test equipment, due to the lack of data [5] at high angles of attack.
Fig. 4. Aerodynamic load characteristics from CFD compared to experimental data in coefficient form, for flat plate geometries t/c 0.01 & 0.1,
Re of 3.78×10⁵ and 2.75×10⁵ respectively, AoA = 0o to 40o, V = 20m/s, (a) lift (b) drag and (c) pitching moment.
3.2. Frisbee-like
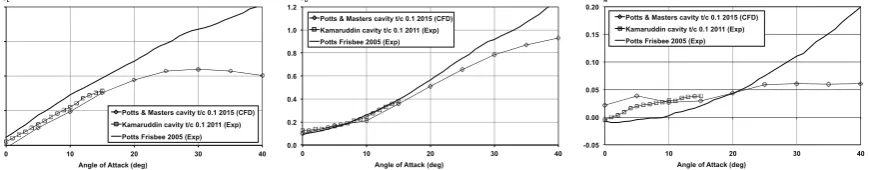
The lift, drag and pitching moment curves from CFD for the flat plate with underside cavity hcav /t 0.8 are shown
in Fig. 5, Re of 2.75×10⁵. The lift curve has slope 0.05 per degree over the low AoA range and the drag curve shows
a minimum profile drag coefficient, CDo, of 0.099 at the zero lift AoA 1o. The pitching moment curve is non-linear
across the range of angles plotted; displaying positive coefficient values throughout and a positive linear gradient (nose up) through zero angle of attack, CM then reduces at 10o before rising again 15o flattening off at 25o.
Experimental validation from wind tunnel test for a flat plate with underside cavity were from Kamaruddin [5] at Re of 3.78×10⁵, for an analogous disc model with identical geometry ratios t/c, h
cav /t and ccav/c, showing some
similarities to the CFD curves. The lift curve gradients are similar but the zero lift angle of attack was a couple of degrees lower -1o, the drag curves overlay fairly well but the zero lift profile drag is around 25% higher C
Do 0.0125,
Fig. 5. Aerodynamic load characteristics from CFD compared to experimental data in coefficient form, for flat plate with underside cavity t/c 0.1, AoA = 0o to 40o, V = 20m/s, Re 2.75×10⁵ (a) lift (b) drag and (c) pitching moment.
the pitching moment curves are divergent at low angles of attack but converge at 10o. Again, the range of angles of
attack tested [5] was only up to 15o. Wind tunnel validation cases for the (throw and catch) Frisbee geometry t/c
0.15 for higher angles were from Potts [9]. Similarly to the flat plate, the pre-stall simulated and experimental [9] curves for the cavity geometry diverge considerably over the higher angle of attack range. It is unclear if there is a distinct stall in the CFD data as the curves transition smoothly, comparatively from wind tunnel test [9] the very high stall angle of attack 45o for a Frisbee is some 9o higher than the thin flat plate.
3.3.Discus
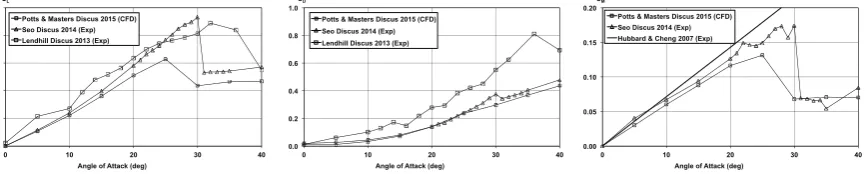
The lift, drag and pitching moment curves from CFD for the men’s discus geometry t/c 0.2 ccc/c 0.23 are shown
in Fig. 6, Re of 3.01×10⁵. The lift curve has slope 0.025 per degree over the low AoA range and the drag curve shows a minimum profile drag coefficient, CDo, of 0.020 at the zero lift AoA. The pitching moment curve is
non-linear; displaying positive coefficient values across the range of angles plotted and positive linear gradient (nose up) through zero angle of attack, CM gradient reduces after 20o before a significant decrease in CM flattening off at 30o.
0.0 0.5 1.0 1.5
0 10 20 30 40 CL
Angle of Attack (deg)
Potts & Masters flat plate t/c 0.01 2015 (CFD) Potts & Masters flat plate t/c 0.1 2015 (CFD) Kamaruddin flat plate t/c 0.01 2011 (Exp) Kamaruddin flat plate t/c 0.1 2011 (Exp) Potts flat plate t/c 0.01 2005 (Exp)
0.0 0.2 0.4 0.6 0.8 1.0 1.2
0 10 20 30 40 CD
Angle of Attack (deg) Potts & Masters flat plate t/c 0.01 2015 (CFD) Potts & Masters flat plate t/c 0.1 2015 (CFD) Kamaruddin flat plate t/c 0.01 2011 (Exp) Kamaruddin flat plate t/c 0.1 2011 (Exp) Potts flat plate t/c 0.01 2005 (Exp)
-0.05 0.00 0.05 0.10 0.15 0.20
0 10 20 30 40 CM
Angle of Attack (deg)
Potts & Masters flat plate t/c 0.01 2015 (CFD) Potts & Masters flat plate t/c 0.1 2015 (CFD) Kamaruddin flat plate t/c 0.01 2011 (Exp) Kamaruddin flat plate t/c 0.1 2011 (Exp) Potts flat plate t/c 0.01 2005 (Exp)
0.0 0.5 1.0 1.5 2.0
0 10 20 30 40 CL
Angle of Attack (deg)
Potts & Masters cavity t/c 0.1 2015 (CFD) Kamaruddin cavity t/c 0.1 2011 (Exp) Potts Frisbee 2005 (Exp)
0.0 0.2 0.4 0.6 0.8 1.0 1.2
0 10 20 30 40 CD
Angle of Attack (deg) Potts & Masters cavity t/c 0.1 2015 (CFD) Kamaruddin cavity t/c 0.1 2011 (Exp) Potts Frisbee 2005 (Exp)
-0.05 0.00 0.05 0.10 0.15 0.20
0 10 20 30 40 CM
[image:6.544.53.488.359.444.2]405
Jonathan R. Potts and Dominic Masters / Procedia Engineering 112 ( 2015 ) 400 – 405
Experimental validation from wind tunnel test for a women’s discus shape is from Seo et al [2] at Re of 3.75×10⁵,
for an analogous discus with geometry ratios t/c 0.2 ccc/c 0.28, showing some similarities to the CFD curves. The lift
curve gradients are slightly divergent, the women’s discus tested by Seo et al [2] slightly higher at 0.03 per degree, the stall slightly lower for the present men’s discus test somewhere between 25o and 30o AoA, compared with the
women’s geometry [2] at around 30o. The drag curves overlay fairly well throughout the AoA range, although the zero lift profile drag of the women’s discus CDo 0.011 [2] is almost half that of the men’s. The slightly earlier stall,
not well defined due to the coarse data points, on the CFD men’s discus appears as a divergence at 25o. The pitching moment curves compare remarkably well, the earlier stall appearing in the data is the only difference worthy of note.
Wind tunnel data from Lendhill [10] for an exact half scale men’s discus shape to the present CFD simulations, Re 2.27×10⁵, track higher for lift and particularly drag. The experimental error is likely much higher for these tests,
indeed the pitching moment curves are omitted for comparison. As another more recent independent comparison to the pitching moment curves, Hubbard and Cheng [6] derived the CM slope of a men’s discus experimentally, it has
[image:7.544.56.489.229.316.2]slightly higher CM gradient (CMα 0.007 per degree) than both the present simulation (0.006) and Seo et al [2] tests.
Fig. 6. Aerodynamic load characteristics from CFD compared to experimental data in coefficient form, for men’s discus geometry t/c 0.2, AoA = 0o to 40o, V = 20m/s, Re 3.01×10⁵ (a) lift (b) drag and (c) pitching moment.
4.Concluding Remarks
In general, the plots in Figures 4,5&6 suggest that the low angle of attack CFD cases compare very well to experiments but the simulations require further work for sufficient model validation at higher angles. It is possible that the generated mesh for each geometry does not capture the wake with enough resolution at high angles of attack, in particular see the CM curves comparison for the thin flat plate and cavity disc in Figures 4&5, which would
equate to prediction errors of upstream effects on the body surface aerodynamic loading. This would not be so important for higher aspect ratio lifting surfaces which fly at relatively low angles of attack, such as aircraft wings, but for sports disc applications the high angle of attack range is very important towards the end of a free flight.
Further investigations are required to extend this initial study to a modified meshing regime with further refinement to capture the wake flow more effectively, prior to moving forward with any parametric design studies.
References
[1] Seo K., Shimoyama K., Ohta K., Ohgi Y., Kimura Y., Aerodynamic behavior of a discus, Procedia Engineering 34, pp. 92-97, 2012.
[2] Seo K., Shimoyama K., Ohta K., Ohgi Y., Kimura Y., Optimization of the size and launch conditions of a discus, Procedia Engineering 72,
pp. 756-761, 2014.
[3] Lukes R.A., Hart J.H., Potts J.R., Haake S.J., A CFD analysis of flow around a disc, Procedia Engineering 72, pp. 685-690, 2014.
[4] IAAF Competition Rules 2014-2015: Rule 189 Discus Throw, IAAF, Monaco, pp 211-212, 2013.
[5] Kamaruddin, N., Dynamics and Performance of Flying Discs. PhD Thesis. The University of Manchester, U.K., 2011.
[6] Hubbard M., Cheng K., Optimal discus trajectories, J. Biomechanics, 40, pp. 3650-3659, 2007.
[7] Potts J.R., Crowther W.J., The Flow Over a Rotating Disc-wing, RAeS Aerodynamics Research Conference Proc., London, UK, Apr. 2000. [8] Menter F.R., Kuntz, M., Langtry, R., Ten years of industrial experience with the SST turbulence model, Begell, 2003.
[9] Potts, J.R., Disc-wing Aerodynamics. PhD Thesis. The University of Manchester, U.K., 2005.
[10] Lendhill, T., The Aerodynamic effects on the Flight of a Discus, BSc (Hons) Sport Technology, Dept. Eng & Maths., Sheffield Hallam University, 2013.
0.0 0.2 0.4 0.6 0.8 1.0
0 10 20 30 40 CL
Angle of Attack (deg) Potts & Masters Discus 2015 (CFD) Seo Discus 2014 (Exp) Lendhill Discus 2013 (Exp)
0.0 0.2 0.4 0.6 0.8 1.0
0 10 20 30 40 CD
Angle of Attack (deg) Potts & Masters Discus 2015 (CFD) Seo Discus 2014 (Exp) Lendhill Discus 2013 (Exp)
0.00 0.05 0.10 0.15 0.20
0 10 20 30 40 CM