Moulting of the feathers must be a very energetically stressful period in the annual cycle of birds. The costs associated with moulting are manifold given that flight performance, behavioural repertoire, plumage insulation and water repellency may all be impaired (Jenni and Winkler, 1994). Furthermore, the efficiency of feather production is very low, and moulting is energetically expensive and involves processes other than just the synthesis of keratin (Lindström et al. 1993). On average, energy expenditures required for moulting during the moulting period are 20–40 % of the basal metabolic rate (reviewed in Walsberg, 1983).
Moulting may be particularly challenging to hummingbirds because flight is essentially the only means of locomotion in this taxon, and missing flight feathers will obviously impair the mechanism of lift force generation by flapping wings. How do hovering hummingbirds compensate biomechanically? How are the aerodynamic, mechanical and physiological parameters of flight performance altered throughout a moult? This study evaluates hovering performance of ruby-throated hummingbirds during the moulting of primary flight feathers
and is the first such study investigating moulting effects on the flight energetics of birds.
Air density is a major determinant of aerodynamic power requirements (Norberg, 1990), and flight mechanics of birds can be conveniently varied by manipulation of the density of normoxic gas mixtures (Dudley and Chai, 1996). Chai and Dudley (1995) determined the limits of flight performance in hummingbirds hovering in normoxic but hypodense mixtures of air and heliox. Ruby-throated hummingbirds demonstrated considerable power reserves, and the maximum aerobic capacity at low air densities was unequivocally indicated when aerodynamic failure caused the birds to descend to the chamber floor after briefly hover-feeding. In this study, density manipulation is used to elicit variable flight energetics of moulting ruby-throated hummingbirds and to identify the limits to hovering performance.
Materials and methods
Ruby-throated hummingbirds (Archilochus colubris L.) JEB0864
How does a hovering hummingbird compensate for the loss of flight feathers during moult when the mechanism of lift force generation by flapping wings is impaired? The flight performance of five individual ruby-throated hummingbirds with moulting primary flight feathers and reduced wing area was compared with that before their moult. Hummingbirds were flown in reduced air densities using normoxic heliox so that a range of flight energetics was displayed. The rate of moulting and the extent of wing area loss varied among individuals. One female could tolerate a 30 % loss of wing area in moulting and flew with only three outer primaries per wing. Further exploratory study using the artificial reduction of wing area, either by cutting the tips of the outer primaries of a male or by plucking the secondaries of two females, suggested that secondaries play a minor role in lift force generation during hovering whereas the tip area of primaries is crucial. For the five birds, ranges of whole-bird oxygen consumption
rates, wingbeat kinematics (stroke amplitude) and lift coefficients did not vary during the moult. This constancy was mainly achieved through weight loss that alleviated aerodynamic force requirements for weight support during hovering. Since the metabolic power expenditure during moult was similar to that of normal birds but the mechanical power requirement was reduced, the flight efficiency also showed a sharp reduction during moult. This increased cost of flight may result from disruption of the integrity of the flight machinery. Overall, the control of body mass in hummingbirds can provide similar aerodynamic, muscle mechanical and physiological capacities under conditions of variable flight demand.
Key words: air density, body mass, flight feathers, heliox, hovering flight, hummingbird, Archilochus colubris, lift coefficient, moult, muscle power and efficiency, oxygen consumption, wing area loss. Summary
Introduction
HUMMINGBIRD HOVERING ENERGETICS DURING MOULT OF PRIMARY FLIGHT
FEATHERS
PENG CHAI*
Department of Zoology, University of Texas, Austin, TX 78712, USA
Accepted 10 March 1997
were mist-netted in the vicinity of Austin, Texas, during the autumn migratory season of 1995 and were housed in screen cages of dimensions equal to those of the experimental cube. Hummingbird care was in accordance with federal and state guidelines. Two or three birds were housed together within one cage. The experimental procedures and equipment have been described previously (Chai and Dudley, 1995, 1996), and only a brief account will be given here. Birds were trained to feed through a cylindrical mask attached to a hanging syringe. Five individual hummingbirds with initially undamaged flight feathers (one adult male bird 1M, one juvenile male bird 2M and three females birds 3F, 4F and 5F) were used in experiments. Each bird was subjected to three trials. The first served as the control and was conducted in the winter (representing wintering, maintenance condition) prior to their moult in the spring. Two trials were conducted during the moulting of primaries (Fig. 1). Since the most stressful point during moult was probably when the bird lost most of its primaries to yield the smallest wing area and presumably smallest lift-generating capacity, one trial was timed at the point when the bird was judged to possess the smallest area of
primaries. This point occurred when the birds only had three or four old, outer primaries (the birds generally shed the first six or seven primaries over a short period). The other trial was arbitrarily chosen and was implemented either before or after the trial with smallest wing area. In this case, the old outer primaries varied in number from two to four.
Flight experiments were implemented within an airtight acrylic cube (90 cm×90 cm×90 cm). For each trial, data were collected initially from birds hover-feeding in unmanipulated air at pressures close to sea-level pressure. Air within the cube was then gradually replaced by filling with normoxic heliox (79 % He and 21 % O2, density 0.40 kg m−3; the normobaric atmosphere exhibiting a density of 1.20 kg m−3) while allowing the cube contents to escape from an additional port. Hover-feeding flight was then recorded approximately every 15–20 min when the bird was hungry and came to feed. The duration of hover-feeding flight t was timed from video recordings. Heliox filling was terminated after the bird demonstrated aerodynamic failure in hovering; reverse pumping of ambient air was then initiated. The trial was generally stopped when the bird could then hover for increased durations and feed normally.
Density reduction associated with replacement of normal air by heliox was monitored acoustically (Dudley, 1995). Metabolic power input during hovering was obtained from measurements of rates of oxygen consumption (V.O∑) using an open-flow feeder-mask respirometry system. Oxygen consumption was expressed at STP. Horizontal projections of wingbeat kinematics of each hover-feeding sequence were video-recorded from a mirror oriented above the bird at 45 ° to the horizontal (filming and subsequent analysis were at 60 fields s−1with a high-speed shutter of 1/4000 s). Wingbeat kinematics recorded at each hover-feeding sequence, together with morphological parameters for individual birds, were used to estimate the mechanical power requirements of flight using a detailed aerodynamic model of insect hovering flight (Ellington, 1984a–f). Wingbeat kinematics measured for each hovering sequence included wingbeat frequency n and stroke amplitude Φ. Wingbeat frequency was derived from the interaction frequency between wing motion and filming rate, and stroke amplitude was derived from video images in which the wings were located at the extreme position of the wingbeat. Morphological parameters used in aerodynamic calculations included body mass m, relative wing mass mwfor both wing pairs and expressed as a fraction of body mass, wing length R, total wing area S (the area of both wing pairs, body area not included), wing loading pw (mg/S, where g is gravitational acceleration) and aspect ratio AR(4R2/S). For humane reasons, none of the experimental birds was killed for post mortem analysis. Wing mass and its spanwise distribution were estimated from one bird of each sex in previous studies with the same species (Chai and Dudley, 1995, 1996). Wing mass and its distribution for moulting hummingbirds differ in an unknown way from those of unimpaired wings. Possible biomechanical implications of this difference for inertial power expenditure are treated in the Discussion.
Fig. 1. Configuration of the flight feathers of moulting ruby-throated hummingbirds. (A) Unimpaired wing (bird 4F) showing primary and secondary flight feathers; moulting of primaries (outward) precedes that of secondaries (inward). (B) Only three old, outer primaries 8–10 left, new primaries 4–6 growing, and all old secondaries plucked (bird 4F). (C) More advanced moulting stage with two old, outer primaries 9–10 left, primaries 1–8 and secondaries 1–2 growing; the dashed line indicates where the tips were cut (bird 2M).
10 9
8 7
6 5
4 3
2 1
6 5 4 3 2 1
10 9 8
6 5
4
C
A B
10 9
[image:2.609.46.286.343.646.2]For each hovering flight sequence, the mechanical power requirements of flight were estimated by evaluating individual components of profile (P*pro), induced (P*ind) and inertial power
during the first half of a half-stroke (P*acc). Total power
expenditure for a flight sequence was calculated for the two cases of zero (P*zero) and perfect (P*per) elastic storage of wing
inertial energy, which represent the maximum and minimum estimates of required mechanical power, respectively (Ellington, 1984f). Thus, P*zero=(P*pro+P*ind+P*acc)/2, assuming
zero elastic energy storage, and P*per=P*pro+P*ind, assuming
perfect elastic energy storage. P*zero and P*perare expressed in
muscle mass-specific form, assuming that flight muscle equals 25 % of the body mass (Chai and Dudley, 1995). However, during moult, flight muscle mass may not remain a constant fraction of body mass, and absolute muscle mass may not change. To evaluate this alternative assumption, a new value,
P*per(fixed), was calculated assuming that muscle mass was
fixed and did not change during moult, and that muscle mass was 25 % of body mass before moult (see Table 1). Muscle mechanical efficiency ηm was estimated as P*per/(0.9P*IN),
assuming a 90 % direct energy expenditure by flight muscle
(Lasiewski, 1963; Wells, 1993). P*IN was derived from
measured rates of oxygen consumption and was expressed in mass-specific form. P*per was used for comparative purposes
because hummingbirds can probably store kinetic energy elastically during the deceleration phase of the wing stroke (Wells, 1993). In addition, because of body mass variation across the study period, whole-bird metabolic power input PIN
(body mass × V.O∑, unit changed to W) and whole-bird
mechanical power output POUT(body mass ×P*perin W) were
also calculated for comparison. Thus, ηm was also equal to
POUT/(0.9PIN).
The effects of normoxic density reduction and wing area loss due to moult were evaluated for each of the ten kinematic, aerodynamic, mechanical and metabolic parameters (see Tables 1, 2) using repeated-measures analysis of variance (ANOVA) (SAS Institute, 1989). Both treatments (moult and density reduction) had three levels (see below), and these and their potential interactions were modelled as within-subject sources of variation. Because 30 tests (3×10) were conducted, sequential Bonferroni adjustment for multiple statistical tests was conducted to achieve a table-wide type I error rate of 0.05 (Holm, 1979).
Hover-feeding events were first grouped by rounding to the nearest 0.1 kg m−3 the air densities at which feeding events
occurred. Flight performance recorded in normal air (the highest density level at 1.2 kg m−3) and at aerodynamic failure
(the lowest) were treated as separate density levels. Because the birds showed aerodynamic failure at different density levels ranging from 0.5 to 0.9 kg m−3, a mean value across density
levels between normal air and aerodynamic failure was calculated to achieve a balanced statistical design. Thus, three density levels were used for each trial. Because oxygen consumption rates at failure could not be reliably obtained given the short duration of hover-feeding, measurements at the density level closest to aerodynamic failure were used to
represent the values of the metabolic variables V.O∑and PINnear
failure.
In addition to studying the consequences of the normal moult, an exploratory study was conducted by artificially reducing the wing area and altering the wing shape. In order to evaluate the role of primaries and secondaries in lift generation, the tips of the outer primaries (9–10) of the juvenile male (bird 2M) were cut, and all the secondaries of two females (birds 4F and 5F) were plucked (see Fig. 1, at this time, moult of secondaries had not started). These manipulations were performed after data for normal moulting had been collected.
Results
The moult pattern of captive ruby-throated hummingbirds follows the patterns described for wild individuals of this species when they moult at their wintering ground (Baltosser, 1995). The present study only concerns the moult of primaries that precedes moulting of secondaries (Fig. 1). Beginning with primary 1, moult proceeds outwards, with primaries being replaced sequentially up to primary 8, after which primary 10 is shed before primary 9. Our captive birds tended to shed primaries 1–6 or 1–7 over a relatively short period, and mainly relied on primaries 7–10 or 8–10 for flight while new primaries grew. The nonsequential moult of the outer primaries in hummingbirds is unique among birds and suggests their particular importance in flight (Epting, 1980). Individual variation with respect to the timing and rate of moult and the extent of wing area loss was also evident. Moulting was most impressive in bird 4F in that she quickly shed primaries 1–7 (loss of 30 % of wing area) and flew using mainly the three outer primaries (Fig. 1B).
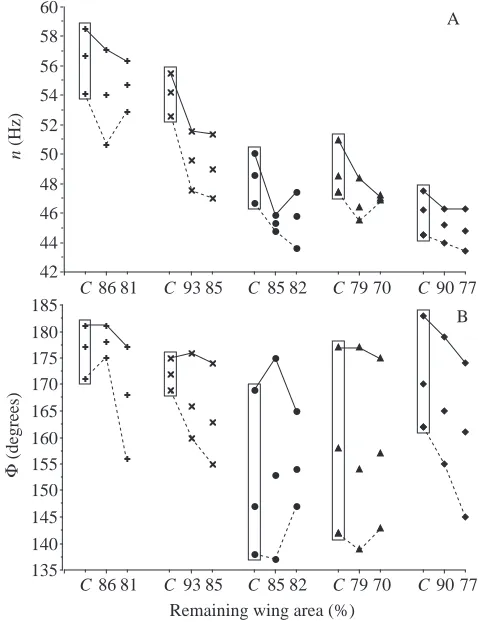
Density reduction always led to aerodynamic failure (Fig. 2A). The reduced wing area in moulting birds should cause failure at higher air densities than those of control birds with unimpaired wings. However, the two males actually failed at lower air densities during moult, whereas the three females, as expected, exhibited failure at higher densities. This discrepancy reflects sexual dimorphism and the differences in patterns of wing loading between sexes; male ruby-throated hummingbirds possess shorter wings and higher wing loading (Fig. 2C). When moulting flight feathers, all individuals lost body mass despite the availability of food ad libitum (Fig. 2B), but the extent of this loss in males was such that their wing loading was actually lower than that prior to moult, whereas wing loading remained similar before and after moulting for females. This result may explain the unexpected pattern of aerodynamic failure in the two males with respect to density reduction. In the moulting stages considered in the present study, the outer primaries (9–10, Fig. 1) were still intact, and thus the wing length was unaffected. Aspect ratio then increased with decreasing wing area (Fig. 2D).
Thus, overall wing kinematics in terms of muscle contractile
velocity (proportional to wingbeat frequency × stroke
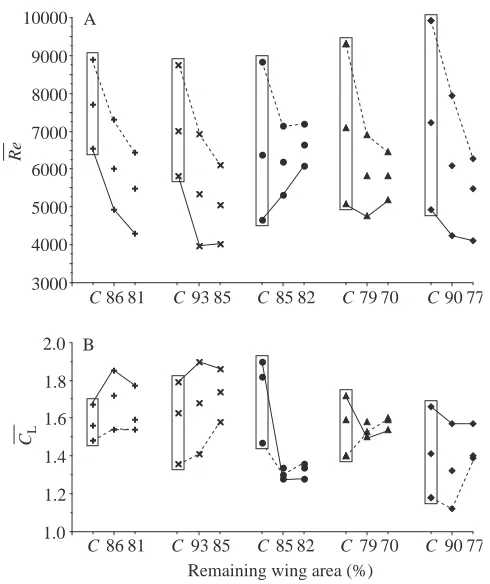
amplitude) remained similar across moulting stages. During moult, the two aerodynamic variables (mean Reynolds number
Re— and mean lift coefficient C—L) did not show statistically
significant changes (Fig. 4; Tables 1, 2). Wing area and mean wing chord were reduced during moult, and this resulted in
smaller values of Re—. However, because females showed
higher failure densities at aerodynamic failure, this increase was a consequence of the decrease in wing area and resulted in an inconsistent distributional pattern of Re—between sexes.
The individual P value of moult effect on Re— is 0.006
(Table 2). However, after sequential Bonferroni adjustment,
this P value became marginally insignificant. The
distributional pattern of C—Ldid not indicate any effect of moult.
Depending on the extent of elastic energy storage, the effect of moult on muscle mass-specific power output could be significant (Fig. 5; Tables 1, 2). While P*zeroshowed no trend
(Fig. 5A), P*per with reduced wing area showed a generally
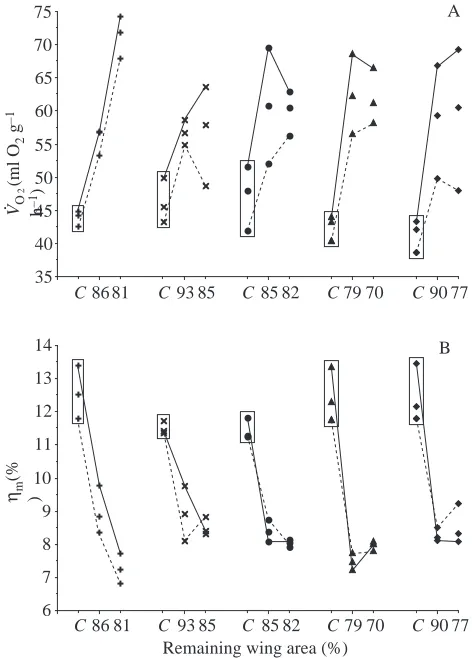
downward trend (Fig. 5B). V.O∑showed a steep and significant
increase (Fig. 6A) with an associated and significant decrease in muscle efficiency ηm(Fig. 6B; Tables 1, 2). During moult, all birds showed reduced body masses. As a result, patterns of whole-bird metabolic and mechanical performance were substantially different from their mass-specific values (Fig. 7; Tables 1, 2). PINshowed no significant upward trend, whereas
POUT showed a steep decline with reduced wing area.
Statistical results for density effects on kinematic, mechanical and metabolic variables were in close agreement with earlier studies on normoxic density reduction using heliox (Chai and Dudley, 1995, 1996). Density reduction significantly affected all variables except for muscle mechanical efficiency; ηmwas, however, significantly influenced by moult (Table 2).
Artificial wing area and shape manipulation
In the exploratory study (no statistics were performed owing to the small number of samples), cutting off the tips of primaries 9 and 10 of bird 2M resulted in a smaller loss of wing area (10 %) than plucking out all the secondaries (17 % for bird
4.5
m
(g)
Remaining wing area (%) 2.5
3.0 3.5 4.0
B
C86 81 C 93 85 C 85 82 C7970 C9077
ρ (
kg m
−
3)
pw
(N m
–2)
25 30 35 40
45 C
C86 81 C 93 85 C 85 82 C7970 C9077
6 8 10 12
D
C 86 81 C 93 85 C 85 82 C7970 C 9077 0.5
0.6 0.7 0.8 0.9
A
C86 81 C93 85 C85 82 C7970 C9077 Bird 1M
(40 mm) 2M (43 mm)
3F (49 mm)
4F (48 mm)
5F (49 mm)
[image:4.609.315.554.74.385.2]AR
Fig. 2. Air density ρ at aerodynamic failure (A) of five individual ruby-throated hummingbirds and their morphological indicators (B, body mass m; C, wing loading pw; and D, aspect ratio AR) in relation to wing area loss due to moult. Values in the boxes are from normal, unimpaired wings and serve as the control (symbol C on the x-axis). Wing length in mm is indicated for each bird.
42 44 46 48 50 52 54 56 58 60
135 140 145 150 155 160 165 170 175 180 185
n
(Hz)
A
B
C86 81 C 93 85 C 85 82 C7970 C9077
C86 81 C 93 85 C 85 82 C7970 C9077 Remaining wing area (%)
Φ
(degrees)
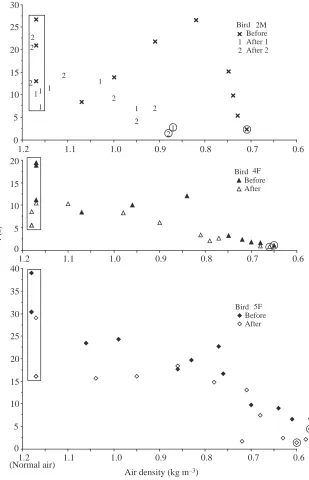
[image:4.609.50.287.74.426.2]4F and 18 % for 5F; see Fig. 1 and Table 3). However, the reduction in wing length and wing tip velocity for bird 2M caused by trimming the primaries exerted more drastic aerodynamic consequences than the loss of secondaries, as
indicated by a greatly increased air density at aerodynamic failure (Fig. 8, Table 3). The two females could tolerate total loss of secondaries with only a slight increase of air density at aerodynamic failure. Bird 4F was already operating with a much reduced wing area, only 79 % that of unimpaired wings, because of her relatively fast rate of moulting, and after plucking out all her secondaries, she was flying with 62 % of pre-moult wing area. Despite this, air density at aerodynamic failure remained similar to that occurring before feather plucking (Fig. 8), although both failure densities were higher than that measured before the moult (0.53 kg m−3, Fig. 2A).
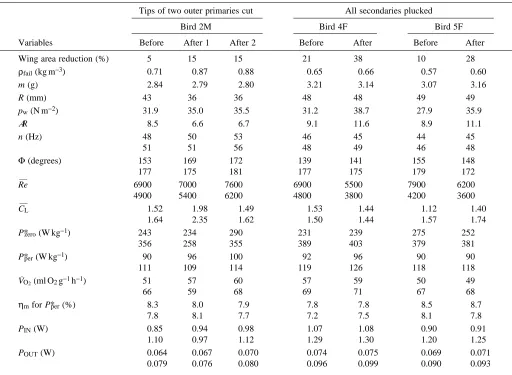
[image:5.609.49.296.110.483.2]For all three birds, artificial reduction of wing area shortened the hover-feeding duration (Fig. 8). This reduction was most evident for hovering duration in normal air, which tended to be the longest in duration. Air density reduction using heliox also shortened hover-feeding duration and eventually led to aerodynamic failure. Hover-feeding duration at aerodynamic failure was very short and probably represented transient burst performance (Chai and Dudley, 1996), whereas hover-feeding in normal air represented sustainable flight. Thus, the duration of sustained flight of all three birds was adversely affected by artificial wing area reduction, whereas only the transient performance of bird 2M was greatly curtailed. After cutting the tips of the two outer primaries of bird 2M, the steep increase in mean lift coefficient at aerodynamic failure (to a maximum value of 2.35, Table 3) indicated that its wings had difficulty generating sufficient lift force. This was probably the reason Table 1. Summary of morphological, kinematic, mechanical
and metabolic variables for five birds in relation to moulting stages
Moulting stages
Moulting, Moulting, Before moult, intermediate greatest Variables wings unimpaired wing area loss wing area loss ρfail(kg m−3) 0.64±0.13 0.65±0.06 0.73±0.08
m (g) 4.2±0.1 3.1±0.2 3.2±0.3
pw(N m−2) 38.0±5.9 32.6±4.4 36.0±2.0
AR 7.5±0.5 8.8±0.3 9.7±0.7
n (Hz) 49±4 47±3 47±4
53±4 50±5 50±4
Φ(degrees) 156±15 153±16 149±6
177±5 178±2 173±5
Re— 9100±500 7200±400 6500±400
5400±800 4600±500 4700±900
C—L 1.38±0.12 1.38±0.17 1.49±0.11 1.75±0.10 1.62±0.26 1.61±0.23
P*zero(W kg−1) 250±25 254±23 240±21
343±18 373±22 350±25
P*per(W kg−1) 101±4 93±2 95±3
131±6 119±2 117±4
P*per(fixed) 101±4 69±3 72±6
131±6 88±2 88±6
V˙O2(ml O2g−1h−1) 41±2 53±3 56±8
47±4 64±6 67±5
ηmfor P*per(%) 11.6±0.3 8.3±0.4 8.2±0.9 12.7±1.0 8.6±1.1 8.1±0.3
PIN(W) 1.02±0.05 0.98±0.07 1.04±0.16 1.16±0.11 1.18±0.16 1.25±0.11
POUT(W) 0.106±0.004 0.073±0.005 0.075±0.008 0.138±0.011 0.093±0.005 0.093±0.008
The first value of kinematic, mechanical and metabolic variables refers to the value in normal air; the second to the value at aerodynamic failure (V˙O2and PINclose to aerodynamic failure).
Values at muscle mass-specific power output, P*zeroand P*per, were calculated assuming that flight muscle equals 25 % of the body mass.
P*per(fixed), recalculated P*perassuming that muscle mass is fixed
and does not change during moult and that muscle mass was 25 % of body mass before moult.
All values are given as mean ±S.D., N=5.
ρfail, air density at aerodynamic failure; m, body mass; pw, wing
loading; AR, aspect ratio; n, wingbeat frequency; Φ, stroke amplitude;
Re—, mean Reynolds number; CL—, mean lift coefficient; P*zeroand P*per, mechanical power output per unit flight muscle mass assuming zero and perfect elastic energy storage; V˙O2, body mass-specific rate of
oxygen consumption; ηmfor P*per, muscle mechanical efficiency; PIN, whole-bird metabolic power input; POUT, whole-bird mechanical power output assuming perfect elastic energy storage.
Table 2. Results of repeated-measures ANOVA for kinematic,
mechanical and metabolic variables assessing effects of wing area reduction due to moult and air density reduction in
heliox
P value
Variables Moult Density Moult ×Density
n 0.001* (2,8) 0.001* (2,8) 0.927 (4,16) Φ 0.058 (2,8) 0.001* (2,8) 0.780 (4,16)
Re— 0.006 (2,8) 0.001* (2,8) 0.001* (4,16)
CL
—
0.746 (2,8) 0.003* (2,8) 0.021 (4,16)
P*zero 0.030 (2,8) 0.001* (2,8) 0.176 (4,16)
P*per 0.001* (2,8) 0.001* (2,8) 0.242 (4,16)
V˙O2 0.001* (2,8) 0.001* (2,8) 0.146 (4,16)
ηmfor P*per 0.001* (2,8) 0.136 (2,8) 0.130 (4,16)
PIN 0.269 (2,8) 0.001* (2,8) 0.466 (4,16)
POUT 0.001* (2,8) 0.001* (2,8) 0.002* (4,16)
P values are from univariate F-test.
d.f. (given in parentheses), degrees of freedom.
* significant on the basis of sequential Bonferroni adjustment with table-wide type-I error rate at 0.05.
n, wingbeat frequency; Φ, stroke amplitude; Re—, mean Reynolds
number; CL—, mean lift coefficient; P*zeroand P*per, mechanical power output per unit flight muscle mass assuming zero and perfect elastic energy storage; V˙O2, body mass-specific rate of oxygen consumption;
[image:5.609.316.569.117.268.2]for aerodynamic failure at a much higher air density. However, this bird compensated for its wing damage by changing its wingbeat kinematics after 8 days (both wingbeat frequency and stroke amplitude increased) to improve lift-generating capacity, giving lift coefficients comparable to those before the operation (Table 3). (During this period, bird 2M had shed primary 10 but primary 8 grew longer, so that the total wing area remained the same.) Hover-feeding duration in normal air was lengthened, but air density at aerodynamic failure remained similar to that immediately following the operation (Fig. 8, cf. After 1 and 2).
Discussion
Wing mass and its distribution in moulting hummingbirds were not measured in the present study, and values from birds with unimpaired wings were used instead. Since no noticeable change in muscle distribution along the wing was evident (P. Chai, personal observation) and hummingbird wing mass is primarily restricted to the wing base (Wells, 1990), wing mass and its distribution in moulting hummingbirds were unlikely to show significant variation. Both wing area and moment of inertia for the virtual mass of the wing pair were reduced in moulting hummingbirds, and this should be correlated with
increased wingbeat frequency (Pennycuick, 1990). However, wingbeat frequency was slightly but significantly reduced (Fig. 3). This reduction is difficult to explain, but may relate to physiological changes in the thoracic musculature or increased variability in wingbeat kinematics associated with feather loss. Various physiological systems involved in neural control, oxygen and fuel supply, muscle mechanics, wingbeat kinematics, etc., must be efficiently linked for a bird to function in flight. Each such system should be flexible enough to respond to variable ecological and physiological demands on flight, such as those occurring during migration, courtship and moult (Rayner, 1988, 1995). In the present study, it has been shown that ruby-throated hummingbirds maintained their ability to hover given a wide range of body masses, air densities, wing area and wing shape and also that muscle mass-specific rates of oxygen consumption could vary substantially. This finding suggests broad responsiveness in the flight motor. However, the ranges of whole-bird oxygen consumption rate, wingbeat kinematics and lift coefficients remained similar,
3000 4000 5000 6000 7000 8000 9000 10000 A
Re
C86 81 C93 85 C85 82 C7970 C9077
1.0 1.2 1.4 1.6 1.8 2.0 B
CL
[image:6.609.51.296.68.360.2]C86 81 C 93 85 C85 82 C7970 C 9077 Remaining wing area (%)
Fig. 4. Mean Reynolds number Re—(A) and mean lift coefficient CL— (B) in relation to moult and air density reduction (order of individuals as in Fig. 2). Solid lines link values at aerodynamic failure; dashed lines link values in normal air. Intermediate values are means across density levels. Values in the boxes are from normal, unimpaired wings and serve as the control (symbol C on the x-axis).
200 220 240 260 280 300 320 340 360 380 400 420
85 90 95 100 105 110 115 120 125 130 135 140
A
B
C86 81 C 93 85 C 85 82 C7970 C9077
C86 81 C93 85 C85 82 C7970 C9077 Remaining wing area (%)
Pper
(W kg
–1)
*
Pzero
(W kg
–1)
*
[image:6.609.316.558.74.398.2]pointing to homeostasis and a set range of values to which an individual hummingbird is adapted. Mass loss can alleviate aerodynamic force requirements for weight support, and, therefore, by controlling body mass in relation to different flight demands, hummingbirds can maintain a sufficient aerodynamic performance. At the same time, physiological parameters in relation to muscle contractile dynamics and oxygen and fuel supply can be maintained without excessive variation. However, mass loss presumably reduces fat reserves and may jeopardize energy security. Thus, such a strategy may be selected for only under extraordinary flight conditions.
More studies are obviously needed to evaluate the role of body mass control in hummingbirds during moult and other flight activities such as migration (Carpenter et al. 1993) and courtship (Calder et al. 1990). Two other studies also showed that moulting hummingbirds in captivity with reduced wing area typically lost mass (Wells, 1990; Hiebert, 1993), and this also appears to be the case for other birds (e.g. King, 1968; Klaassen, 1995).
[image:7.609.54.566.95.470.2]Dissimilar body masses prior to and during moult point to differences in body composition. In the present study, P*perand P*zerowere calculated assuming that flight muscle equals 25 %
Table 3. Artificial wing area reduction on three ruby-throated hummingbirds during moult and the effects on morphological,
kinematic, mechanical and metabolic variables
Tips of two outer primaries cut All secondaries plucked
Bird 2M Bird 4F Bird 5F
Variables Before After 1 After 2 Before After Before After
Wing area reduction (%) 5 15 15 21 38 10 28
ρfail(kg m−3) 0.71 0.87 0.88 0.65 0.66 0.57 0.60
m (g) 2.84 2.79 2.80 3.21 3.14 3.07 3.16
R (mm) 43 36 36 48 48 49 49
pw(N m−2) 31.9 35.0 35.5 31.2 38.7 27.9 35.9
AR 8.5 6.6 6.7 9.1 11.6 8.9 11.1
n (Hz) 48 50 53 46 45 44 45
51 51 56 48 49 46 48
Φ(degrees) 153 169 172 139 141 155 148
177 175 181 177 175 179 172
Re— 6900 7000 7600 6900 5500 7900 6200
4900 5400 6200 4800 3800 4200 3600
C—L 1.52 1.98 1.49 1.53 1.44 1.12 1.40
1.64 2.35 1.62 1.50 1.44 1.57 1.74
P*zero(W kg−1) 243 234 290 231 239 275 252
356 258 355 389 403 379 381
P*per(W kg−1) 90 96 100 92 96 90 90
111 109 114 119 126 118 118
V˙O2(ml O2g−1h−1) 51 57 60 57 59 50 49
66 59 68 69 71 67 68
ηmfor P*per(%) 8.3 8.0 7.9 7.8 7.8 8.5 8.7
7.8 8.1 7.7 7.2 7.5 8.1 7.8
PIN(W) 0.85 0.94 0.98 1.07 1.08 0.90 0.91
1.10 0.97 1.12 1.29 1.30 1.20 1.25
POUT(W) 0.064 0.067 0.070 0.074 0.075 0.069 0.071
0.079 0.076 0.080 0.096 0.099 0.090 0.093
Because of moult, wing area was already reduced relative to unimpaired wings (under Before) and was further reduced after the operation (under After).
Kinematic, mechanical and metabolic variables show two values taken (first) in normal air and (second) at aerodynamic failure (V˙O2and PIN
taken close to aerodynamic failure).
For each bird, all measurements were collected on the same day except for values under After 2 (bird 2M), which were collected 8 days later. Wing area reduction indicates the percentage reduction relative to unimpaired wings before moult; ρfail, air density at aerodynamic failure;
m, body mass; R, wing length; pw, wing loading; AR, aspect ratio; n, wingbeat frequency; Φ, stroke amplitude; Re—, mean Reynolds number;
C—L, mean lift coefficient; P*zeroand P*per, mechanical power output per unit flight muscle mass assuming zero and perfect elastic energy storage;
of body mass. However, it is not possible to determine accurately the proportions of flight muscle and fat storage in relation to varying body mass without immediate post mortem analysis (ruby-throated hummingbirds can undergo rapid body mass change of up to 10 % in 1 day; P. Chai, unpublished material). The values of P*perand P*per(fixed) represent the two
extremes (Table 1) in that P*perassumes that flight muscle mass
remains a constant fraction of body mass whereas P*per(fixed)
assumes that flight muscle mass is invariant before and during moult. The patterns of muscle and fat changes during moult are presently unclear.
The model developed by Ellington (1984f) uses approximations to calculate profile drag coefficent (CD,pro);
thus, the value of P*prois less accurate than the value of P*ind
(P*progenerally only accounts for one-quarter of P*per). Profile
drag and P*promay be higher for a moulting bird with imperfect
wings. The wing shape of moulting hummingbirds also deviates from Ellington’s (1984b) ‘laws of wing shape’, i.e. strong positive correlations between ‘shape parameters’ of spanwise wing area, mass and virtual mass distributions for a
diverse collection of insects, birds and bats. An explanation for these tight relationships is still elusive, but the reduced muscle mechanical efficiency (ηm) of moulting birds may indicate a ‘penalty’ for straying from the laws of shape. To understand the mechanisms and dynamics of aerodynamic force generation of flapping wings more fully, further detailed investigation, using techniques such as high-speed video and vortex visualization to measure angle of attack, wing twist, and vortex formation and shedding, is needed.
Both whole-bird and mass-specific power output (POUTand P*per) declined during moult, whereas whole-bird power input
(PIN) remained stable and mass-specific rate of oxygen
consumption (V.O∑) increased. Thus, hovering during moult
became more costly and muscle efficiency ηm was
significantly reduced. To facilitate comparison, ηm was
calculated assuming that 10 % of metabolic power was used by basal metabolism and maintenance needs, i.e. 90 % direct energy expenditure by flight muscles (Lasiewski, 1963; Wells, 1993). However, energy expenditures dedicated to moulting average 20–40 % of the basal metabolic rate (Walsberg, 1983). Even adjusting for this bias, the muscle mechanical efficiency
35 40 45 50 55 60 65 70 75
6 7 8 9 10 11 12 13 14
ηm
(%
)
C86 81 C93 85 C85 82 C7970 C9077
C86 81 C 93 85 C 85 82 C7970 C9077 B
A
Remaining wing area (%)
2
VO
(ml O
2
g
–1
h
[image:8.609.318.556.68.391.2]–1) .
Fig. 6. Body mass-specific rate of oxygen consumption V.O∑(A) and muscle mechanical efficiency ηm(B) assuming perfect elastic energy storage in relation to moult and air density reduction (order of individuals as in Fig. 2). Solid lines link values close to aerodynamic failure; dashed lines link values in normal air. Intermediate values are means across density levels. Values in the boxes are from normal, unimpaired wings and serve as the control (symbol C on the x-axis).
0.8 0.9 1.0 1.1 1.2 1.3 1.4
B
0.06 0.08 0.10 0.12 0.14 0.16
C86 81 C 93 85 C 85 82 C7970 C9077
C86 81 C 93 85 C 85 82 C7970 C9077
POUT
(W)
Remaining wing area (%) A
PIN
[image:8.609.50.286.72.401.2](W)
during moult was still greatly reduced (Fig. 6). Hummingbirds with damaged wings also augment their oxygen consumption and exhibit reduced flight efficiency (Epting, 1980; Wells, 1990).
Although ruby-throated hummingbirds demonstrate flexible physiological functions to cope with different flight demands, the greatly reduced ηmduring moult suggests that there is an ideal flight design which links the aerodynamic properties of the wings, the contractile properties of the flight muscles and the physiological features of oxygen and fuel supply. Moult disrupts the integrity of this flight machinery. For example, for a hummingbird to hover efficiently, wing morphology and wingbeat kinematics should presumably operate in such a way that the supporting flight muscles can perform at their optimal
strain and rates of strain with minimal risk of damaging bones, muscles and tendons. Concurrently, the force balance achieved by the flapping wings should be stable. Impaired wings may increase the operating cost of flight muscles and their regulation of flight stability through neural control.
Artificial manipulation of flight feathers suggests that secondaries play a minor role in lift force generation during hovering, whereas the tip area of primaries is crucial. This result is consistent with the hovering aerodynamic model of Ellington (1984f). After cutting the tips of the two outer primaries of bird 2M, mean lift coefficients rose sharply (see After 1, Table 3). Such excessive lift requirements probably contributed to early aerodynamic failure for this bird. The V.O∑
of bird 2M close to aerodynamic failure at After 1 was lower
Bird Before After 1 After 2
0 5 10 15 20
1.2 1.1 1.0 0.9 0.8 0.7 0.6
1.2 1.1 1.0 0.9 0.8 0.7 0.6
0 5 10 15 20 25 30 35 40
Air density (kg m–3)
t (s)
2 2
2 2
2 2
2 2
1
1 1 1
1
1 1
0 5 10 15 20 25 30
1.2 1.1 1.0 0.9 0.8 0.7 0.6
Bird Before After
2 1
Bird Before After
4F
5F 2M
[image:9.609.251.560.73.553.2](Normal air) Fig. 8. Hover-feeding duration t before and after
than that before the operation. This result suggests that oxygen supply was not limiting immediately after the operation. However, 8 days later, at After 2, bird 2M was able to meet force requirements by altering wingbeat kinematics. The duration of hover-feeding in normal air was restored to the level occurring before the operation, although air density at aerodynamic failure did not change (Fig. 8). Since the V.O∑of
bird 2M close to aerodynamic failure at After 2 was similar to the level before the operation, oxygen supply may have been a limiting factor. Although bird 2M showed similar failure densities at After 1 and 2, two different types of constraints might be responsible. Cutting the tips of primaries and plucking out secondaries obviously caused further disruption to flight integrity, which was already degraded through moulting. Toleration of damage and the restoration of performance present an interesting experimental context within which to evaluate flight capacity, and both natural and artificial disturbance of flight feathers can shed light on the relative roles of aerodynamic, mechanical and physiological constraints. The results of the exploratory manipulations discussed in this paper point to complex physical and biological factors influencing both sustainable and transient capacities to generate lift force by flapping wings.
I would like to thank R. Dudley, J. L. Larimer, and two anonymous reviewers for providing helpful comments on the manuscript and K. L. Schlegel for artwork. This work was supported by an NIH NRSA.
References
BALTOSSER, W. H. (1995). Annual molt in ruby-throated and black-chinned hummingbirds. Condor 97, 484–491.
CALDER, W. A., CALDER, L. L. AND FRAIZER, T. D. (1990). The hummingbird’s restraint: a natural model for weight control.
Experientia 46, 999–1002.
CARPENTER, F. L., HIXON, M. A., BEUCHAT, C. A., RUSSELL, R. W. AND PATON, D. C. (1993). Biphasic mass gain in migrant hummingbirds: body composition changes, torpor and ecological significance. Ecology 74, 1173–1182.
CHAI, P. AND DUDLEY, R. (1995). Limits to vertebrate locomotor energetics suggested by hummingbirds hovering in heliox. Nature
377, 722–725.
CHAI, P. AND DUDLEY, R. (1996). Limits to flight energetics of hummingbirds hovering in hypodense and hypoxic gas mixtures. J.
exp. Biol. 199, 2285–2295.
DUDLEY, R. (1995). Extraordinary flight performance of orchid bees (Apidae: Euglossini) hovering in heliox (80 % He/20 % O2). J. exp.
Biol. 198, 1065–1070.
DUDLEY, R. AND CHAI, P. (1996). Animal flight mechanics in physically variable gas mixtures. J. exp. Biol. 199, 1881–1885.
ELLINGTON, C. P. (1984a). The aerodynamics of hovering insect flight. I. The quasi-steady analysis. Phil. Trans. R. Soc. Lond. B 305, 1–15. ELLINGTON, C. P. (1984b). The aerodynamics of hovering insect flight. II. Morphological parameters. Phil. Trans. R. Soc. Lond. B 305, 17–40.
ELLINGTON, C. P. (1984c). The aerodynamics of hovering insect flight. III. Kinematics. Phil. Trans. R. Soc. Lond. B 305, 41–78. ELLINGTON, C. P. (1984d). The aerodynamics of hovering insect flight.
IV. Aerodynamic mechanisms. Phil. Trans. R. Soc. Lond. B 305, 79–113.
ELLINGTON, C. P. (1984e). The aerodynamics of hovering insect flight. V. A vortex theory. Phil. Trans. R. Soc. Lond. B 305, 115–144. ELLINGTON, C. P. (1984f). The aerodynamics of hovering insect flight.
VI. Lift and power requirements. Phil. Trans. R. Soc. Lond. B 305, 145–181.
EPTING, R. J. (1980). Functional dependence of the power for hovering on wing disc loading in hummingbirds. Physiol. Zool. 53, 347–352. HIEBERT, S. (1993). Seasonal changes in body mass and use of torpor
in a migratory hummingbird. Auk 110, 787–797.
HOLM, S. (1979). A simple sequential rejective multiple test procedure. Scand. J. Stat. 6, 65–70.
JENNI, L. ANDWINKLER, R. (1994). Moult and Aging of European
Passerines. London: Academic Press.
KING, J. R. (1968). Cycles of fat deposition and molt in White-crowned Sparrows in constant environmental conditions. Comp.
Biochem. Physiol. 24, 827–837.
KLAASSEN, M. (1995). Moult and basal metabolic costs in males of two subspecies of stonechats: the European Saxicola torquata
rubicula and the east African S. t. axillaris. Oecologia 104,
424–432.
LASIEWSKI, R. C. (1963). Oxygen consumption of torpid, resting, active and flying hummingbirds. Physiol. Zool. 36, 122–140. LINDSTRÖM, Å., VISSER, G. H. ANDDAAN, S. (1993). The energetic
cost of feather synthesis is proportional to basal metabolic rate.
Physiol. Zool. 66, 490–510.
NORBERG, U. M. (1990). Vertebrate Flight: Mechanics, Physiology,
Morphology, Ecology and Evolution. Berlin: Springer-Verlag.
PENNYCUICK, C. J. (1990). Predicting wingbeat frequency and wavelength of birds. J. exp. Biol. 150, 171–185.
RAYNER, J. M. V. (1988). Form and function in avian flight. In Current
Ornithology, vol. 5 (ed. R. F. Johnston), pp. 1–66. New York:
Plenum Press.
RAYNER, J. M. V. (1995). Flight mechanics and constraints on flight performance. Israel J. Zool. 41, 321–342.
SASINSTITUTE (1989). SAS/STAT User’s Guide, version 6, 4th edn. Cary, NC: SAS Institute Inc.
WALSBERG, G. E. (1983). Avian ecological energetics. In Avian
Biology, vol. 7 (ed. D. S. Farner, J. R. King and K. C. Parkes), pp.
161–220. New York: Academic Press.
WELLS, D. J. (1990). Hummingbird flight physiology: muscle performance and ecological constraints. PhD thesis, University of Wyoming, Laramie.
WELLS, D. J. (1993). Muscle performance in hovering hummingbirds.