Abstract:Pressure-assisted sintering processes to attach power devices using wet nanosilver pastes with time scales of minutes to a few hours have been widely reported. This paper presents our work on time-efficient sintering, using nanosilver dry film and an automatic die pick and place machine, resulting in process times of just a few seconds. The combined parameters of sintering temperature 250 C, sintering pressure 10 MPa and sintering time 5 s were selected as the benchmark process to attach 2 mm × 2 mm × 0.5 mm dummy Si devices. Then the effects of either the sintering temperature (240 to 300 C), time (1 to 9 s) or pressure (6 to 25 MPa) on the porosity and shear strength of the sintered joints were investigated with 3 groups and a total of 13 experimental trials. The average porosities of 24.6 to 46.2% and shear strengths of 26.1 to 46.6 MPa are comparable with and/or even better than those reported for sintered joints using wet nanosilver pastes. Their dependences on the sintering temperature, time and pressure are further fitted to equations similar to those describing the kinetics of sintering processes of powder compacts. The equations obtained can be used to not only reveal different mechanisms dominating the densification and bonding strength, but also anticipate the thermal-induced evolutions of microstructures of these rapidly sintered joints during future reliability tests and/or in service.
Key words: Sintered die attachment, efficient manufacturing, nanosilver film, porosity, shear strength, statistical analysis, data fitting
1.INTRODUCTION
With increasing demand on the development of high power density and high performance power electronics systems, conventional Sn-based solders are no longer competent for power die attachments or other interconnects where the operating temperatures reach above 175oC. This is because these solders have relatively low melting point and are prone to creep at elevated temperatures. High-lead solders such as Pb5Sn and Pb2SnAg2.5 are the standard materials for improving the reliability of soldered die attachments in high temperature applications, but lead is restricted to be employed in electronic packaging due to health and environment concerns [1, 2]. Thus, new bonding materials and technologies for high temperature and high density power die attachments have been under intensive investigation.
The eutectic or near eutectic Au-based solders and the ZnAl solders may be used for high temperature power die attachments. However, they either are very expensive, require high processing temperatures (above 300oC) or exhibit poor solderability [3, 4]. Transient liquid phase soldering is another potential technology for high temperature and highly reliable power die attachments, but needs thick base metal layers on both the power dies and the supporting substrates. By contrast, silver or nanosilver sintering appears to be a more convenient and promising lead-free alternative [5, 6]. It can be applied on the common Au and Ag finishes of
commercially available power dies and substrates. The sintering process can be carried out at temperatures similar to those used in the Sn-based soldering processes, while the sintered Ag joints have higher re-melt temperature (and hence higher creep resistance) and higher electrical and thermal conductivities than all solder joints.
The Ag sintering process, which has widely been investigated for power die attachments, in general start with printing (with stencil) or dispensing wet pastes of Ag particles or nanoparticles onto a substrate. A variety of pastes have been formulated with organic binder, thinner and dispersant etc. to achieve desirable rheological properties while also preventing the agglomeration of silver nanoparticles. During sintering, a multi-step temperature profile or a drying step is employed to burn out those organics as much as possible prior to the actual sintering stage, which occurs at a relatively high temperature. The entire processing time covering the drying step is at least half an hour although the duration of the final sintering stage can be reduced to a few seconds with the assistance of high pressure of 30 to 40 MPa.
Over the recent years, dry film preparations of Ag nanoparticles have been developed for much more efficient sintering process. Unlike the wet nanosilver paste, the amount of organics in the nanosilver film is significantly reduced, and thus there is no need of a drying step. During the sintering process, the dry film is rapidly transferred onto the back side of a power device and then placed on the bonding position on the substrate. However, the sintering process of dry nanosilver film has seldom been investigated, and there is a lack of data demonstrating whether the significantly lower amount of organics in the dry film could have impacts on the microstructures and properties of the sintered joints.
This paper is concerned with the sintering process of a commercially available dry nanosilver film. The combined parameters of sintering temperature 250 C, pressure 10 MPa and time 5 s were selected as the benchmark process to attach 2 mm × 2 mm × 0.5 mm dummy Si devices. The effects of either the sintering temperature, time or pressure on the porosity and shear strength of the sintered joints were investigated with 13 experimental trials considering single variable factor only. In particular, the results of statistical analysis for both the porosity and shear strength under each of the 13 experimental trials were presented. The average porosities and shear strengths of the 13 experimental trials were compared with those reported for the sintered joints using wet nanosilver pastes. The dependences of average porosity and shear strength on the sintering parameters were further fitted to equations similar to those describing the kinetics of sintering processes of powder compacts.
Time-efficient sintering processes to attach
power devices using nanosilver dry film
2.EXPERIMENTAL PROCESS
2.1 Materials
The nanosilver dry film, Argomax 2020 was obtained from Alpha Assembly Solutions, suitable for sintering on substrates with Ag finish. The dummy silicon dies of 2 mm × 2 mm × 0.5 mm were obtained from Dynex Semiconductor Ltd. They have ~0.7/0.5 µm thick Ni/Ag metallization on the back side and ~5 µm thick Al metallization on the top side. AlN substrates were custom manufactured from DOWA Metaltech Co., Ltd. Each substrate consists of 58.2 mm 49.5 mm × 0.95 mm thick AlN ceramic tile with 0.26 mm and 0.23 mm thick Cu tracks actively brazed on both sides, and the substrate surface finish is 0.2 µm thick Ag. Prior to bonding, surfaces of dies and substrates were cleaned in an ultrasonic bath with deionized water and acetone respectively, and then further treated by argon-hydrogen (90/10%) plasma.
2.2 Sample preparation
The sintering process of nanosilver film is performed on a Datacon 2200 EVO high accuracy die bonder. It enables automatic manufacture for sintered silver die attachments by pressure-assisted sintering. The process consists of die pick-up, film transfer, die placement and sintering. It starts with picking up a target Si die by a 2 mm × 2 mm vacuum tool when the tool is heated to 130 oC. The vacuum sucked die is dipped onto a piece of nanosilver film, and thus film is therefore stamped onto the backside of the die by applying a force of 1200 g for 1s at 130 oC. Then the film-attached die is placed to attach a substrate which has been pre-heated to a specified temperature, i.e. the sintering temperature. Right after the touch-down of the die onto the substrate, the tool is immediately heated up to a desirable temperature and a specified force is applied simultaneously for a duration of a specified sintering time.
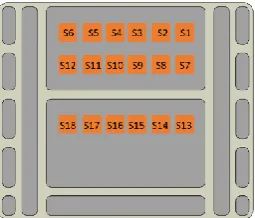
[image:2.595.314.539.482.652.2]Table 1 lists the experimental trials consisting of different combinations of sintering temperature, time and pressure. Trial Tb is the benchmark process which is recommended by the supplier of the dry nanosilver film. Trials T1 to T4, t1 to t4 and P1 to P4 are used to investigate the effects of sintering temperature, time and pressure respectively. For each trial, a total of 18 devices were attached on the same substrate, in the order of S1, S2…, S18, as shown in Fig.1. During the experiment, after each die attachment is finished, the pick-and-place tool is rapidly cooled to 130oC by compressed air within 6 to 10 s (depending on the sintering temperature) before carrying out the next die attachment.
Fig.1 Layout of 18 of 2 mm × 2 mm dummy Si devices attached on one AlN-based substrate (Note that the 18 devices are not to scale in size).
2.3 Porosity measurement and shear test
The density (𝞺) values of the as-sintered Ag joints were
determined by measuring the weights and volumes as used in [7]. In the present work, all the sintered Ag joints were assumed to have the same weight of 0.00068 g and bonding area of 2 mm × 2 mm. The weight was calculated from those of three pieces of 13 mm × 13 mm dry film which were randomly selected and transferred to 3 13 mm × 13 mm × 0.5 mm Si diodes. Both the weights of the three dies and the dies with the transferred dry film were measured using a high accuracy balance with a resolution of 0.0001g, and the difference of the net weights between the three pieces of dry films was within ±0.3 %. The volume was estimated by the area of 2 mm × 2 mm and the height of the attached device subtracted by the thickness of the device itself. The height of the attached device was measured using an optical surface profiler under a vertical resolution of less than 0.5 µm. The errors of the estimated volumes are in the range of 1.5% to 2.3%. The porosity (p) was calculated according to Equation (1) where 𝜌𝐴𝑔 is the density of bulk silver (10.49 g/𝑐𝑚3).
Porosity values of 12 die attachments on the same substrate for each trial were obtained.
𝑝 = 1 − 𝜌
𝜌𝐴𝑔 (1)
The shear strength values of the sintered joints were tested on a Nordson DAGE 4000 Plus bond tester. During all the tests, the shear height was fixed as 180 µm from the base substrate, and shear forces were recorded under displacement control mode at a constant shear rate of 0.2 mm/s. The shear strength was defined as the maximum shear force recorded (prior to die attach failure) divided by the die surface area. The shear strength values of 18 die attachments on the same substrate for each trial were tested to obtain the data series for statistical analysis.
Table 1 Experimental trials considering the individual effect of sintering temperature, pressure and time
Trial Sintering temperature, T, oC
Bonding pressure, P, MPa
Sintering time, t, s Tb 250 10 5 T1 240 10 5 T2 260 10 5 T3 280 10 5 T4 300 10 5 t1 250 10 1 t2 250 10 3 t3 250 10 7 t4 250 10 9 P1 250 6 5 P2 250 15 5 P3 250 20 5 P4 250 25 5
In addition, the microstructures of the fracture surfaces and cross-section were also observed by scanning electron microscopy on a Hitachi TM3000 desktop Scanning Electronic Microscope.
2.4 Statistical analysis
[image:2.595.105.233.618.727.2]earlier were subjected to longer pressure-less heat treatment due to the fact that the substrate had been heated, and kept at the sintering temperature until the finish of the last die attachment. The results of the statistical analysis would help to understand whether different pressure-less heat treatments could influence the distributions of porosity and shear strength of specimens on the same substrate.
In the statistical analysis, the curve of cumulative probability, f(i), for the data series of the porosity or shear strength for each experimental trial was first obtained by placing data in an ascending order of data:
𝑓(𝑖) =𝑖−0.5
𝑛 (2) where i is the ith number in the ascending order, and n is the total number of the data series [8]. Then the curve of cumulative probability was plotted on normal coordinates to evaluate the goodness of the data series obeying the Normal distribution. This was judged by the coefficient of correlation from the linear data fitting of the curve under a given confidence level [9].
2.5 kinetic equations
Equations (3) and (4), similar to those describing the sintering kinetics of the powder compacts have been developed to describe the effects of sintering parameters on the average porosity and shear strength [10].
𝑝 = 𝑝0+ 𝑏𝑃𝛾exp (−
𝐸2 𝑅𝑇) 𝑡
𝜀 (3)
𝐹 = 𝑎𝑃𝛼𝑒𝑥𝑝 (−𝐸1 𝑅𝑇) 𝑡
𝛽 (4)
where 𝑝 and F are porosity and shear strength; R and T are gas constant and Kelvin temperature; 𝑝0 is the initial porosity
of the nanosilver film prior to sintering (0.7426); γ, ε, α, β, a, b, 𝐸1 and 𝐸2are constants which are determined through data fittings of the experimental results to Eqs. (3) and (4).
Both equations are considered because the bonding strength and porosity should be associated with mass transportation causing grain growth, intergranular interactions and densification leading to a reduction in the number and size of voids/pores. The temperature- and time-dependent relations in Eqs. (3) and (4) are the same as, or similar to, those in the equations describing the sintering kinetics of the powder compacts [10]. No simple form was found to describe pressure-dependence kinetics of the sintering process. An exponential dependence on the pressure was selected in Eqs. (3) and (4) based on the following fact. The nanosilver film cannot be bonded on the substrate and its thickness is almost the same as that of the as-transferred film if the sintering temperature is on, but no pressure was applied during the sintering process.
3.RESULTS AND DISCUSSION
3.1 Overview of experimental results
A. Statistical distributions
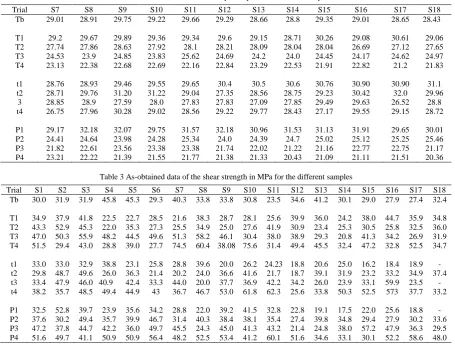
[image:3.595.71.527.437.781.2]Table 2 and 3 list as-obtained porosity and shear strength values in the processing order for each of the 13 trials. All the data series appear to fluctuate arbitrarily with respect to the processing order even though the die attachments produced earlier were subjected to longer pressure-less heat treatment on the same substrates.
Table 2 As-obtained data of the porosity for the different samples
Trial S7 S8 S9 S10 S11 S12 S13 S14 S15 S16 S17 S18 Tb 29.01 28.91 29.75 29.22 29.66 29.29 28.66 28.8 29.35 29.01 28.65 28.43 T1 29.2 29.67 29.89 29.36 29.34 29.6 29.15 28.71 30.26 29.08 30.61 29.06 T2 27.74 27.86 28.63 27.92 28.1 28.21 28.09 28.04 28.04 26.69 27.12 27.65 T3 24.53 23.9 24.85 23.83 25.62 24.69 24.2 24.0 24.45 24.17 24.62 24.97 T4 23.13 22.38 22.68 22.69 22.16 22.84 23.29 22.53 21.91 22.82 21.2 21.83 t1 28.76 28.93 29.46 29.55 29.65 30.4 30.5 30.6 30.76 30.90 30.90 31.1 t2 28.71 29.76 31.20 31.22 29.04 27.35 28.56 28.75 29.23 30.42 32.0 29.96
3 28.85 28.9 27.59 28.0 27.83 27.83 27.09 27.85 29.49 29.63 26.52 28.8 t4 26.75 27.96 30.28 29.02 28.56 29.22 29.77 28.43 27.17 29.55 29.15 28.72 P1 29.17 32.18 32.07 29.75 31.57 32.18 30.96 31.53 31.13 31.91 29.65 30.01 P2 24.41 24.64 23.98 24.28 25.34 24.0 24.39 24.7 25.02 25.12 25.25 25.46 P3 21.82 22.61 23.56 23.38 23.38 21.74 22.02 21.22 21.16 22.77 22.75 21.17 P4 23.21 22.22 21.39 21.55 21.77 21.38 21.33 20.43 21.09 21.11 21.51 20.36
Table 3 As-obtained data of the shear strength in MPa for the different samples
Figures 2 to 4 present the cumulative probability curves of porosity series for all the 13 experimental trials on normal coordinates. The high coefficients of correlation (>0.94) for the linear data fittings reveal that they all comply with the normal distribution under a confidence level higher than 0.99.
[image:4.595.344.495.192.306.2]Fig. 2 Cumulative probability curves of porosity data series for sintered joints prepared under different sintering temperatures.
[image:4.595.86.237.271.383.2]Fig. 3 Cumulative probability curves of porosity data series for sintered joints prepared under different sintering pressures.
Fig. 4 Cumulative probability curves of porosity data series for sintered joints prepared with different sintering times.
Fig. 5 Cumulative probability curves of shear strength data series for sintered joints prepared under different sintering temperatures.
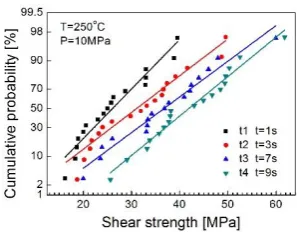
Figures 5 to 7 are the corresponding cumulative probability curves o shear strengths on normal coordinates. Similarly, all the 13 shear strengths series have high correlation coefficients (>0.94), and thereby they also obey the normal distribution under a confidence level above 0.99. Therefore, the values and variations of the porosity and shear strength from different experimental trials can be compared using their means and standard deviations (SDs).
B Comparison with existing results
[image:4.595.344.493.335.451.2]Table 4 lists the means and SDs of both the porosity and shear strength from the experimental trials. Under the investigated sintering conditions, the porosity is almost independent of or slightly decrease with increasing sintering time. On the other hand, it clearly decreases with increasing temperature or pressure. The variations of the porosity data series for all the 13 trials are quite low with the coefficients of variation (SDs divided by means) below 10%.
[image:4.595.84.238.412.522.2]Fig. 6 Cumulative probability curves of shear strength data series for sintered joints prepared under different sintering pressures.
Fig. 7 Cumulative probability curves of shear strength data series for sintered joints prepared within different sintering times.
In the previous work [11], sintered die attachments were produced using nanosilver paste as the raw material, and the final sintering of the dried paste (at 130°C for 10 to 45 min) was performed at 240 to 300 °C under 1MPa to15MPa for 1 to 8 min. The reported “apparent” porosity values (using SEM image-analysis method) were 15.3% to 23.4%. The present porosity values are apparently higher than them. This can be attributed to the following facts. First, the voids/pores in nanoscale were excluded from the previous porosity measurement method. More importantly, the present sintering time is much shorter, and thereby the densification due to the sintering is much less complete. In another work [12], the printed wet paste was first dried at 50°C for 30 min followed by drying at 125°C for another 30 min. Then the sintered die attachments were prepared at sintering temperatures 225 to 300°C, pressures 5 and 10MPa for 5s and 60s. Porosities of 15% to 32% from these sintered die attachments are similar to or lower than the present porosity values, using the same porosity measurement method. This may be due to higher temperatures and longer sintering times or the use of the wet paste which could promote the densification and thus the porosity is reduced.
[image:4.595.85.234.548.664.2]increases with increasing sintering time or temperature, but is relatively insensitive to the sintering pressure.
[image:5.595.342.493.229.339.2]In the existing literatures, the shear strengths of the different sintered silver joints were reported as average values of a few to 10 data or the maximum value. The present minimum average shear strength of 26.1 MPa obtained from Trial t1 is comparable with those of the Pb5Sn solder joints (18 to 25 MPa) and Au12Ge joints (25MPa) [7, 13-15]. The present average shear strengths in the range of 26.1MPa to 46.6MPa are also comparable with those of the sintered silver joints using wet silver pastes which took longer processing time [16, 17]. For example, the shear strengths were 15.7 to 80 MPa for those sintered joints prepared at sintering temperatures of 220 to 300°C, pressures of 1 to 20 MPa and sintering times of 60s to 1800s [11, 17-19].
Table 4 Comparison of experimental shear strength and porosity with corresponding values from equation-fitting
Trial Porosity Shear strength, MPa Mean SD Eq.(3) Mean SD Eq.(4) Tb 0.444 0.007 0.432 32.3 6.15 34.2 T1 0.447 0.010 0.458 31.6 6.60 32.3 T2 0.414 0.011 0.402 34.3 8.48 36.2 T3 0.334 0.014 0.340 41.4 10.4 40.2 T4 0.273 0.021 0.273 44.1 15.18 44.4 t1 0.463 0.015 0.460 26.1 7.240 24.0 t2 0.454 0.024 0.431 31.1 9.87 30.6 t3 0.426 0.019 0.424 38.6 10.18 36.8 t4 0.437 0.020 0.419 41.9 11.90 38.9 P1 0.479 0.018 0.505 29.9 9.79 29.5 P2 0.346 0.013 0.356 35.3 6.52 38.5 P3 0.274 0.028 0.292 39.7 9.56 41.8 P4 0.245 0.026 0.236 46.6 9.70 44.6
From the above comparisons, it can be seen that the dry nanosilver film with lower amount of organics could indeed have impacts on the microstructures and properties of the sintered joints. It caused a slight reduction in the densification but the shear strength of the sintered die attachments are comparable with or even higher than those formed using wet pastes. This may be due to the fact that the wet pastes could lead to better particle re-arrangement than the dry film during the sintering process but it has no significant influence on the bonding of the nanoparticles on the silver metallization of the substrate. In addition, the bonding strength may also depend on the type, surface profile and thickness of the substrate metallization.
C. Kinetic equations
Equations (5) and (6) are results of the average porosity and shear strength fitted to Eqs. (3) and (4). The corresponding values calculated with both equations for the 13 experimental trials are also listed in Table 2 for comparison with the experimental results. The relative errors between the calculations and the experimental data are all below 10.5%.
𝑝 = 0.742 − 9.13𝑃0.53exp (−20.42×10³
𝑅𝑇 )𝑡
0.06 (5)
𝐹 = 242.6𝑃0.29exp (−12.96×10³
𝑅𝑇 )𝑡
0.22 (6)
It should be pointed out that the effect of different durations of the pressure-less heat treatment for die attachments on the same substrate has been ignored in Eqs. (5) and (6). This is because on one hand both the porosity and shear strength data series follow a normal distribution with
high confidence level (Figs. 1 to 6). On the other hand, the effect of sintering time (1 to 9s) under the application of the sintering pressure was much more significant than that of the pressure-less heat-treatment even for a longer time (less than 4min).
3.2 Effect of sintering temperature
[image:5.595.48.290.268.413.2]According to the experimental trials listed in Table 1, the effect of sintering temperature (240°C-300°C) on the porosity and shear strength expressed in Eqs. (5) and (6) are only valid for the fixed sintering pressure of 10 MPa and fixed sintering time of 5 s. Figs. 8 and 9 show the effects of sintering temperature on the average porosity and shear strength respectively.
[image:5.595.344.495.367.479.2]Fig. 8 Plot of average porosity versus sintering temperature.
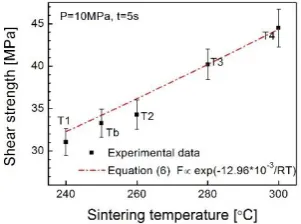
Fig. 9 Plot of average shear strength versus sintering temperature.
Fig. 10 SEM images of fracture surfaces after shear test from samples of: (a) Trial T1 at 240 °C and (b) Trial T4 at 300 °C.
[image:5.595.307.547.494.590.2]but the relevant activation energy values were significantly lower than those in relatively large particle compacts [25]. In particular, grain boundary diffusion must play a role in the densification, for the grain size in a denser sintered die attachment produced at higher temperature is clearly larger than that in a less dense one produced at lower temperature, see Fig. 10. It should be noted that the two SEM images in Fig. 10 cannot be used to compare the “true porosities” because many pores/voids smaller than 0.1 µm are not visible from them.
[image:6.595.341.493.172.280.2]The shear strength dependence on the sintering temperature follows the same trend as the porosity, but with a lower activation energy (12.96 kJ/mol). This might be due to the following facts. The relevant mechanisms of mass transportation such as surface-melting, grain boundary diffusion and plastic flow for promoting densification and bonding strength are similar. However, for densification these mechanisms occurred between different silver nanoparticles, while the bonding strength was mainly related to the mechanisms associated with those between the nanoparticles and the surface silver metallization (with large grain size) of the substrate. This is why nearly all samples failed at the sintered layer/substrate interface during the shear test, while a sample with higher shear strength was due to stronger bonding between the sintered layer and the substrate as evident with more Ag residual on the substrate side, see Fig. 11.
Fig.11 SEM images of fracture surfaces on the substrate sides with low magnification from of samples: (a) Trial T1 at 240 °C and (b) Trial T4 at 300 °C.
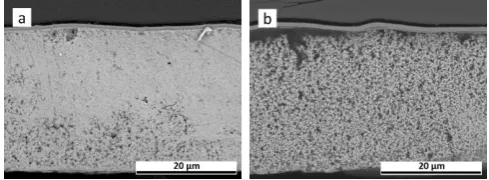
In addition, it should be mentioned that the size and size distribution of pores/voids and grains observed from the cross-sectional SEM images were similar to those observed from the SEM images of the fracture surfaces. Fig. 12 gives one example of the cross-sectional SEM images took from sample T1.
[image:6.595.51.289.380.467.2]
Fig. 12 SEM images from sample T1: (a) as-polished cross section and (b) the cross section etched with a solution of 50% H2O2, 34% NH4OH and 16%
H2O for 2 seconds.
3.3 Effect of sintering time
Figures 13 and 14 show respectively the effects of sintering time (1s to 9s) on the porosity and shear strength described in Eqs. (5) and (6) on the condition of fixed sintering temperature of 250 °C and fixed sintering pressure of 10 MPa. Nearly zero exponent of sintering time for the porosity
(or densification) indicates the densification is independent of the sintering time. This reveals that under specified sintering pressure and temperature, the densification was probably controlled by the surface-melting and/or plastic flow of the silver nanoparticles as mentioned above. This can be further supported by the fact that the grain size in the sintered die attachment produced within a shorter sintering time is almost the same as that in the one produced within prolonged sintering time, see Fig 15.
[image:6.595.307.547.435.527.2]Fig.13 Plot of average porosity versus sintering time.
Fig. 14 Plot of average shear strength versus sintering time.
Fig. 15 SEM images of fracture surfaces after shear test from the samples of: (a) Trial t1 with a sintering time of 1s and (b) Trial t4 with 9s.
In contrast, the exponent of sintering time (0.22 ≈ 1/4) for the bonding strength is very close to those of grain boundary/molten channel controlled growth of intermetallic compounds in the interfacial reactions between the liquid Sn-based solders and Ni substrate [24]. Therefore, the bonding strength was more related to the grain boundary diffusion of silver nanoparticles during the sintering process. This is because the true bonding between the surface silver metallization of the substrate and the silver nanoparticles was far lower than 100%. An increase in the true bonding area due to the grain boundary diffusion could cause much more increase in the bonding strength than densification alone.
3.4 Effect of sintering pressure
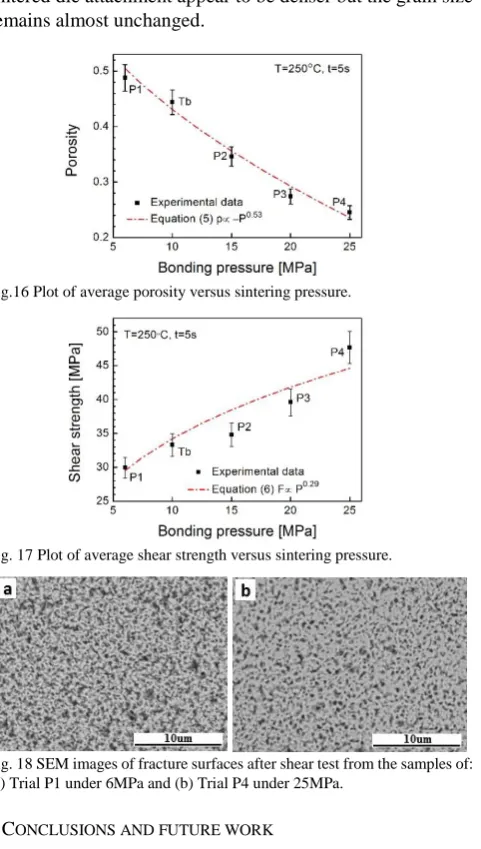
[image:6.595.45.290.582.672.2]porosity) and shear strength increase with increasing sintering pressure. There is no equation similar to Eqs. (3) and (4) describing the effect of external pressure on the kinetics of the sintering process. The present results indicate the plastic flow of silver nanoparticles could contribute to the promotion of both the densification and shear strength in a similar or slightly different way. As can be seen from Fig. 18, with increasing sintering pressure, the microstructure of the sintered die attachment appear to be denser but the grain size remains almost unchanged.
Fig.16 Plot of average porosity versus sintering pressure.
Fig. 17 Plot of average shear strength versus sintering pressure.
Fig. 18 SEM images of fracture surfaces after shear test from the samples of: (a) Trial P1 under 6MPa and (b) Trial P4 under 25MPa.
4CONCLUSIONS AND FUTURE WORK
Based on the above results and discussions, the following conclusions can be drawn.
(1) Despite of the effect of different durations of the pressure-less heat treatment for die attachments on the same substrate, both the porosity and the shear strength data series follow a normal distribution with high confidence level.
(2) Use of dry nanosilver film with a die bonder for accurate control over bonding conditions (time, temperature and pressure) can produce high-strength, reproducible sintered joints with a cycle time of just a few seconds. (3) Dry nanosilver film results in a slight reduction in the
densification and comparable shear strength when compared to wet pastes.
(4) The kinetic-like equations developed reveal that the shear strength was significantly affected by the sintering temperature, time and pressure, while the porosity was
mainly affected by the sintering temperature and pressure.
(5) The above conclusions are valid for the dry film within the scope of the sintering conditions investigated in this paper. Comparisons of sintering processes covering full combinations of sintering temperature, time and pressure are ongoing and the results will be presented in a future paper.
(6) The thermal conductivities and thermo-mechanical reliability of the presently sintered Ag die attachments with a variety of porosity and shear strength values have been being tested by using transient thermal measurement and active power cycling reliability tests.
ACKNOWLEDGEMENT
This work was supported by the Engineering and Physical Sciences Research Council [grant number EP/K035304/1] (EPSRC, UK), through the Centre for Power Electronics (grant for the hub). J. Dai wishes to thank Mentor Graphics for sponsoring her Ph.D study. The authors wish to thank Oscar Khaselev and Mike Marczi of Alpha Assembly Solutions for providing nanosilver film.
REFERENCES
[1] S. H. Mannan and M. P. Clode, "Materials and processes for implementing high-temperature liquid interconnects," Advanced Packaging, IEEE Transactions on, vol. 27, pp. 508-514, 2004. [2] P. O. Quintero and F. P. McCluskey, "Temperature Cycling
Reliability of High-Temperature Lead-Free Die-Attach Technologies," Device and Materials Reliability, IEEE Transactions on, vol. 11, pp. 531-539, 2011.
[3] S. Tabatabaei, A. Kumar, H. Ardebili, et al., "Synthesis of Au–Sn alloy nanoparticles for lead-free electronics with unique combination of low and high melting temperatures," Microelectronics Reliability,
vol. 52, pp. 2685-2689, 11// 2012.
[4] T. Shimizu, H. Ishikawa, I. Ohnuma, et al., "Zn-Al-Mg-Ga alloys as Pb-free solder for die-attaching use," Journal of electronic materials,
vol. 28, pp. 1172-1175, 1999.
[5] Z. Z. Zhang and G.-Q. Lu, "Pressure-assisted low-temperature sintering of silver paste as an alternative die-attach solution to solder reflow," Electronics Packaging Manufacturing, IEEE Transactions on, vol. 25, pp. 279-283, 2002.
[6] S. W. Yoon, M. D. Glover, and K. Shiozaki, "Nickel–tin transient liquid phase bonding toward high-temperature operational power electronics in electrified vehicles," IEEE Transactions on Power Electronics, vol. 28, pp. 2448-2456, 2013.
[7] M. Knoerr and A. Schletz, "Power semiconductor joining through sintering of silver nanoparticles: Evaluation of influence of parameters time, temperature and pressure on density, strength and reliability," in Integrated Power Electronics Systems (CIPS), 2010 6th International Conference on, 2010, pp. 1-6.
[8] H. Peterlik, "The validity of Weibull estimators," Journal of materials science, vol. 30, pp. 1972-1976, 1995.
[9] N. R. Draper, H. Smith, and E. Pownell, Applied regression analysis
vol. 3: Wiley New York, 1966.
[10] S.-J. L. Kang, Sintering: densification, grain growth and microstructure: Butterworth-Heinemann, 2004.
[11] J. Li, C. M. Johnson, C. Buttay, et al., "Bonding strength of multiple SiC die attachment prepared by sintering of Ag nanoparticles,"
Journal of Materials Processing Technology, vol. 215, pp. 299-308, 2015.
[12] C. Weber, M. Hutter, S. Schmitz, et al., "Dependency of the porosity and the layer thickness on the reliability of ag sintered joints during active power cycling," in Electronic Components and Technology Conference (ECTC), 2015 IEEE 65th, 2015, pp. 1866-1873. [13] E. Ide, A. Hirose, and K. F. Kobayashi, "Influence of bonding
condition on bonding process using Ag metallo-organic nanoparticles for high temperature lead-free packaging," Materials Transactions,
vol. 47, pp. 211-217, 2006.
[15] S. Egelkraut, L. Frey, M. Knoerr, et al., "Evolution of shear strength and microstructure of die bonding technologies for high temperature applications during thermal aging," in Electronics Packaging Technology Conference (EPTC), 2010 12th, 2010, pp. 660-667. [16] L. A. Navarro, X. Perpina, P. Godignon, et al., "Thermomechanical
assessment of die-attach materials for wide bandgap semiconductor devices and harsh environment applications," IEEE transactions on Power Electronics, vol. 29, pp. 2261-2271, 2014.
[17] J. Yan, G. Zou, A. P. Wu, et al., "Pressureless bonding process using Ag nanoparticle paste for flexible electronics packaging," Scripta Materialia, vol. 66, pp. 582-585, 2012.
[18] G. Zou, J. Yan, F. Mu, , et al., "Low temperature bonding of Cu metal through sintering of Ag nanoparticles for high temperature electronic application," Open Surface Science Journal, vol. 3, pp. 70-75, 2011. [19] T. G. Lei, J. N. Calata, G.-Q. Lu, et al., "Low-temperature sintering
of nanoscale silver paste for attaching large-area chips," IEEE Transactions on Components and Packaging Technologies, vol. 33, pp. 98-104, 2010.
[20] R. Hoffman and D. Turnbull, "Lattice and Grain Boundary Self‐
Diffusion in Silver," Journal of Applied Physics, vol. 22, pp. 634-639, 1951.
[21] A. Sobaszek, "MEASUREMENT OF THE GRAIN-BOUNDARY SELF-DIFFUSION COEFFICIENT IN SILVER," Nukleonika, vol. 13, pp. 279-288, 1968.
[22] C. J. Smithells, "Smithells Metals Reference Book, edited by EA Brandes," Butterworths, London, vol. 6, p. 15, 1983.
[23] L. A. Pérez‐Maqueda, J. M. Criado, and C. Real, "Kinetics of the initial stage of sintering from shrinkage data: simultaneous determination of activation energy and kinetic model from a single nonisothermal experiment," Journal of the American Ceramic Society,
vol. 85, pp. 763-768, 2002.
[24] G. Ghosh, "Coarsening kinetics of Ni 3 Sn 4 scallops during interfacial reaction between liquid eutectic solders and Cu/Ni/Pd metallization," Journal of Applied Physics, vol. 88, pp. 6887-6896, 2000.