For Review Only
Relative pavement performance for dual and wide-base tyre assemblies using a finite element method
Journal: Journal of Testing and Evaluation
Manuscript ID JTE-2016-0589
Manuscript Type: Technical Manuscript
Date Submitted by the Author: 15-Nov-2016
Complete List of Authors: Casey, Dermot; AECOM, Pavement Design and Asset Management Airey, Gordon; University of Nottingham, NTEC
Grenfell, James ; University of Nottingham, NTEC
ASTM Committees and Subcommittees:
D04.20 Mechanical Tests of Bituminous Mixtures < D04 ommittee on Road and Paving Materials
Keywords: finite element method, tyre contact pressure, pavement performance
For Review Only
Relative pavement performance for dual and wide-based tyre assemblies using
a finite element method
Dermot B. Casey1, Gordon D. Airey2 and James R. Grenfell2
1
AECOM, Nottingham, NG9 6RZ
2
Nottingham Transportation Engineering Centre (NTEC), University of Nottingham, University Park, Nottingham, NG7 2RD, UK
Abstract
There is a need to assess the realistic tyre contact pressure created by a tyre in contact with a pavement. The contact pressure is a function of tyre type, axle loading and tyre inflation pressure (TiP). The research carried out considered dual tyre and wide-based tyre assemblies across a range of axle loading and TiP. These contact pressures were incorporated into a finite element package (CAPA-3D) and modelled on a simple pavement structure. The strains from this modelling were sorted to produce key strains associated with the mechanisms of surface distress, near surface distress, deep asphalt distress and the subgrade. The main distress mechanisms being top down cracking, asphalt cracking/rutting, bottom-up fatigue cracking and subgrade rutting. This gave a method to fairly compare the dual and wide-based tyre assemblies with the same axle loading and TiP. The analysis gave interesting results for the different distress mechanisms of the pavement. The wide-based tyre gives consistently higher shear strains for all the areas of distress investigated. There is great variation in surface and near surface shear strains due to the different combinations of axle loading and TiP. It is clear that the wide-based tyre is a more damaging tyre for all combinations of TiP and axle loading. It is also apparent that how these factors interact has a great influence on the damaging potential of a tyre.
Introduction
There have been a great deal of developments in tyre types available, inflation pressure and axle loading increases since the AASHTO road tests. This has led to there being a great deal of variability in the actual stress being transmitted into a pavement structure for a given axle loading. There needs to be an assessment of not just the axle loading but the tyre used and the inflation pressure. It is only when these three factors are considered that a more accurate understanding of the damaging effect of vehicles can be made. In this paper the influence of different inflation pressures, axle loading and tyre types are investigated to understand how two tyre types compare and how these tyres’ performance varies for a specific range of inflation pressure and axle loading.
True tyre contact pressure is composed of vertical, transverse and longitudinal contact pressures. The largest component of stress is the vertical contact pressure, the next largest is the transverse contact pressure and the smallest is the longitudinal contact pressure [1-6]. The transverse and longitudinal contact pressures are similar in magnitude with the vertical component being much larger. It is shown that these non-uniform contact pressures are of importance to the behaviour of pavements especially at the surface and near surface [7-11]. It has been shown that there are significant differences to surface cracking potential caused by non-uniform contact pressure [12-14].
The magnitude of these 3-D contact pressures has been shown to be highly influenced by the tyre type, tyre loading and inflation pressure [1, 2, 4-6, 15-18]. An individual tyre can have a large range of vertical, transverse and longitudinal contact pressure depending on the inflation pressure and tyre loading [5, 19, 20]. This means that to characterise pavement behaviour to truck loading a 2
For Review Only
combination of tyre types, inflation pressures and tyre loading is needed to assess the behaviour of a specific truck axle [4, 21].
The influence of this variable loading has been shown to have different effects on different key locations in the pavement. The locations are at the surface for top down cracking, near surface for asphalt cracking and rutting, the bottom of the asphalt for bottom-up cracking and the top of the subgrade for subgrade rutting [6, 17, 22, 23]. The loading of the pavement due to the three key parameters of tyre type, inflation pressure and axle loading effect these areas to different degrees and the behaviour is not always predictable especially on the surface due to the 3-D contact pressure components [24].
Objectives
This paper uses 3-D tyre contact pressure representations of dual and wide-based tyre assemblies. This is to understand the effects these tyres have on the pavement if they have the same axle loading and TiP. The key objectives of the paper to assess the effects are:
• To assess the shear strains generated on the surface of the pavement to give an indication of surface damaging potential of the different combinations
• To assess the shear strains generated between 50-80 mm from the surface of the pavement to indicate the near surface damaging potential of the different combinations
• To assess the tensile strain at the bottom of the pavement for the two tyre assemblies to give an indication of the bottom-up cracking potential of the different combinations
• To assess the vertical strain on the top of the subgrade for the two tyre assemblies to give an indication of the subgrade rutting potential of each of the different combinations
These measures act as a method of comparing the two tyres for key areas for the performance of a pavement for the major forms of pavement distress. The performance in these areas and for these strains will give a good indication of the distress the respective tyre assemblies will have on the life of the pavement. This will act as a method for assessing the different loading in a fair way. Analytical design methods relate these strains to damage and number of repetitions to failure. Depending on the methods used these will give different values but the overall principle of higher strain equals higher damage is generally applicable.
Method
The model in this paper utilises static loading, a linear-elastic material model, a simple pavement structure and an intricate 3-D tyre contact pressure loading technique using a finite element method. The critical strains for surface shear strain, near surface asphalt shear strain, bottom of the asphalt tensile strain and compressive strain on top of the subgrade were recorded for each loading combination. These were the major outputs from the analysis to compare the relative performance of the pavement for the particular loading combinations. This set-up allows for the effect of the detailed tyre pavement contact pressures to be assessed against each other for 2 tyre types, 3 inflation pressures and 3 axle loadings.
The pavement is modelled as a three-layer system with an asphalt layer, a sub-base layer and a subgrade layer. The modelling is done using the CAPA-3D finite element software that has a number of functions and features [25]. The asphalt layer is 150mm in thickness, the sub-base is 300mm and 2
For Review Only
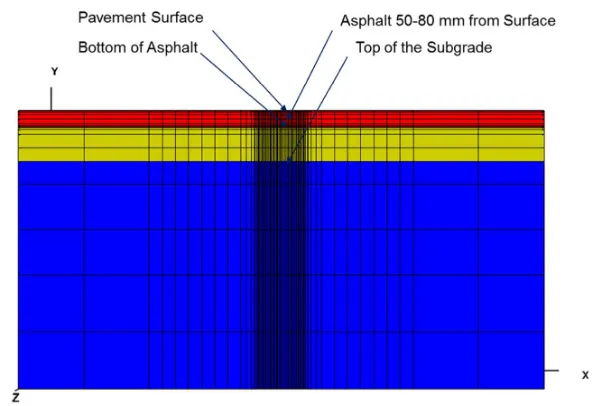
the subgrade layer is assumed to behave as a semi-infinite layer but for the purposes of the model is 2m deep (Figure 1). This is a simple pavement structure that is of reasonable composition for a regional pavement and could be classed as a thin pavement structure. The material properties for the pavement are isotropic linear elastic and represent values that would be typical for such layers and for the type of pavement. The asphalt modulus is 7500 MPa with a Poisson’s ratio of 0.35. These values represent good quality asphalt at lower temperatures. The sub-base layer has an elastic modulus value of 690 MPa and Poisson’s ratio of 0.35. This would represent a lightly bound confined material that would have values of this order from in-situ testing. The subgrade layer is modelled as a semi-infinite layer with a modulus of 100 MPa and a Poisson’s ratio of 0.35. This would represent a good subgrade material.
Figure 1 3-D image of pavement model and pavement structure
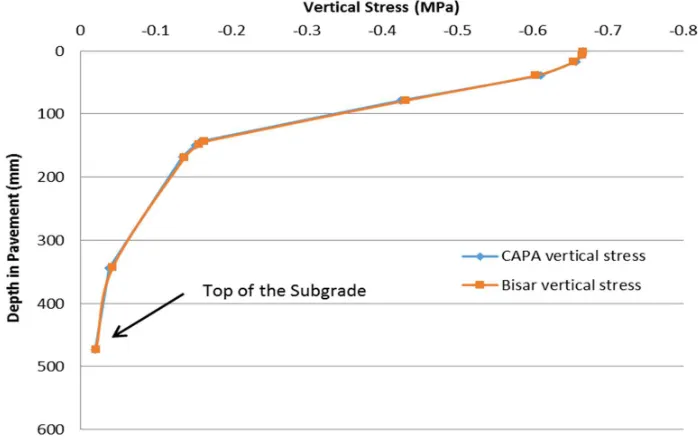
The finite element analysis utilises a 4 m x 4 m and 2.45 m deep finite element mesh consisting of 20-noded quadratic elements using full 27 integration points per element (Figure 1). The mesh is fixed in all directions at the base and restrained in the lateral direction at the sides. The dimensions of the mesh are such that there is no influence from the boundary restraints on the strains that are of interest to the study. The tyre contact area element dimensions on the plane are set to match the discretisation of the raw tyre contact pressure data, which are 15mm in the longitudinal direction and 17mm in the transverse direction. This area is a feature of the measuring device and is therefore set by it. The mesh has this discretisation for a set distance from the edge of loading and slowly becomes coarser as it moves away from the contact area. This is to stop any stress jumping across elements due to a poorly constructed mesh. The stress and strain outputs at the pavement surface, at the bottom of the asphalt and the top of the subgrade for the model for a simple circular contact pressure representation were compared against BISAR. They were found to compare well against each other [26]. This showed that the model behaves well and the mesh density and boundary conditions are stable. The maximum difference in vertical stress was a 1% underestimation by the finite element model compared to BISAR (Figure 2). A similar result was recorded for the radial stress along the depth of the pavement at the centre of the loading.
For Review Only
Figure 2 Variation of vertical stress for depths in the pavement along the centre of the loading area
There are 2 tyres used, one a wide-based tyre and the other a dual tyre assembly. Each of these tyres is loaded with 3 TiPs and 3 axle loadings for a total of 5 loading combinations for each tyre (Table 1). This gives a reasonable spread of inflation and tyre loading conditions to compare the two tyre types against each other. These tyre types are directly in competition as the wide-based tyre is being used to replace the dual tyre in the US and has practically replaced it in Europe. Another interesting aspect of the study is to understand the variation in behaviour for the combinations of inflation pressure and axle loading to see how it performs at the extremes of loading and inflation pressure and how this compares with more reasonable loading and inflation pressure.
Table 1 Matrix of tyres, inflation pressure and half axle loading
Dual Tyre Trailer Tyre Half
Axle Load kN
Inflation Pressure
kPa
Half Axle Load kN
Inflation Pressure
kPa 52 520 52 520 65 520 65 520 65 620 65 620 65 820 65 820 82 620 82 620
The dual tyre assembly consists of two 295/75R22.5 tyres and the wide-base radial tyre consists of a 425/65R22.5 tyre. The tyres are loaded for each run for 3 of the inflation pressures with the median half axle loading and for 3 of the half axle loading and the median inflation pressure. This allows for the spread of tyre behaviour to be observed for different operating conditions. These parameters 2
[image:5.612.130.479.78.302.2]For Review Only
give a basis to conduct a comparison of the relative aggression of each axle loading and inflation pressure to a specific mode of distress. The loads used are from a software package called Tireview from the Texas Transportation Institute. This is a library of tyre contact pressures from the VRSPTA (Vehicle-Road Surface Pressure Transducer Array) stress in motion sensor for different tyres, axle loads and TiPs (De Beer et al., 1997). The device measures the vertical, transverse and longitudinal contact pressure using strain measuring pins that simulate a road surface. The width between the pins in the transverse are fixed (17 mm) and it measures at low speed about one sample point for every 1 mm in the longitudinal direction. The longitudinal measured stresses were averaged over 15 mm as this is the supporting length of each pin and 17 mm is the supporting width for each pin. This gives a good detail of contact pressure for modelling the contact pressure of the different loading combinations (Figure 3). The loading combinations used are limited by the inflation pressures and axle loading available in the software common to both tyre types, but this is probably the most complete and flexible tyre contact pressure database of its type.
[image:6.612.94.500.247.398.2]
Figure 3 Images of the contact pressure of the dual tyre and the wide-based tyre loaded at 52 kN
The 3-D contact pressure discretisation matches the mesh dimensions in the loading area. This allows for a reasonable representation of the contact pressure and a number of elements that is not excessive for the memory capacity of the computer resource used to run the finite element code. This used CAPA-3D’s uniform contact pressure loading function with a spreadsheet designed to discretise the raw contact pressure data and assign it to the correct location on the mesh and to the dimensions of the contact patch. This gives a tool that can be used to transform the raw data from the Tireview software to CAPA-3D contact pressure removing the time consuming activity of individually assigning small areas of contact pressure to build up the 3-D contact pressure.
This discretisation activity reduces the density of contact pressure data to a reasonable density for use in finite element analysis, but it must also maintain the nature of the raw data. This was checked for each of the contact pressures used to assure that this reduced data remains reasonably close to the raw data. The relative error was calculated for each of these components of contact pressure to illustrate the robustness of the discretisation process at converting the raw contact pressure readings. The percentage difference of the raw average vertical contact pressure and the discretised representation was 0.4% underestimated. In the case of the transverse contact pressure the discretised representation underestimated the raw data by 1.7%. Finally the longitudinal representation underestimated the raw contact pressure by 3.4%. These values are broadly representative of all the conversions of raw contact pressure to discretised representations. The 2
For Review Only
[image:7.612.153.454.99.302.2]variation in error is due to the particular nature of each contact patch and the fuzzy definition of the dimensions of the contact patch from the VRSPTA sensor.
Figure 4 Cross-section of the pavement model with the key output levels shown
The output from each of these runs of the model were just for key locations for the life and performance of the pavement (Figure 4). There were over 45,000 stress and strain output values recorded for each run of the model. At each level in the pavement these values were recorded there is a spread of points to try and capture the critical value. The areas of interest were on the surface of the asphalt layer, at a depth of 50-80 mm in the asphalt layer, the bottom of the asphalt layer and the top of the subgrade layer. The tensile strain / shear strain on the surface can influence the formation and rate of top-down cracking. The shear strain in the asphalt can influence the formation and rate of asphalt rutting and cracking. The tensile strain at the bottom of the bound asphalt layers can influence the formation and rate of bottom-up cracking. The compressive strain on the top of the subgrade layer can influence the formation and rate of subgrade rutting. The amount of output points for each combination of factors was the same.
Results
In this section a direct comparison between a dual 295 tyre and a wide-based tyre (425) is presented. This was undertaken to show under the same conditions which would result in higher maximum strains for the identified key locations for pavement life. The values of inflation pressure and axle loading allow for a comparison for equal inflation pressure and axle loading to be undertaken. The comparison is most relevant for jurisdictions where the wide-based tyre has not been adopted yet like the US. The pavement conditions were as per the previous sections. There were 5 loading combinations for each tyre.
For Review Only
Figure 5 Comparison of the maximum surface shear for a dual and wide-base tyre
Figure 6 Comparison of the maximum asphalt shear for a dual and wide-base tyre 0
20 40 60 80 100 120
620 520 620 820 620
52 65 65 65 82
m
ic
ro
st
ra
in
Loading Combinations (Inflation kPa, half axle load kN)
Dual Tyre
WBT
0 20 40 60 80 100 120 140 160 180
620 520 620 820 620
52 65 65 65 82
m
ic
ro
st
ra
in
Loading Combinations (Inflation kPa, half axle load kN)
Dual Tyre
WBT 2
[image:8.612.121.501.333.534.2]For Review Only
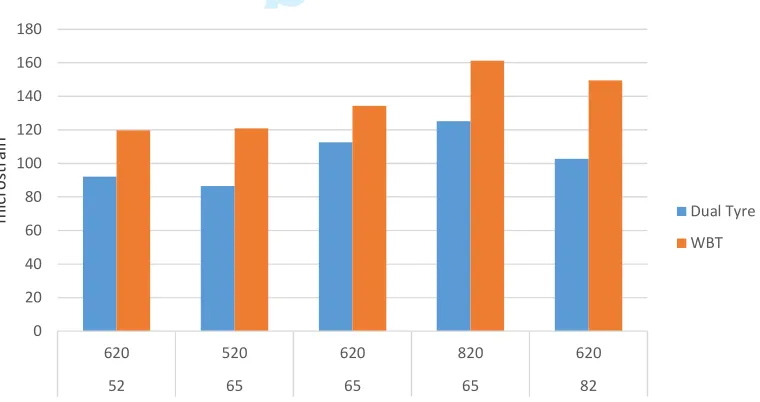
Figure 7 Comparison of the maximum longitudinal tensile strain at the bottom of the asphalt for a dual and wide-base tyre
Figure 8 Comparison of the maximum transverse tensile strain at the bottom of the asphalt for a dual and wide-base tyre
0 20 40 60 80 100 120 140
620 520 620 820 620
52 65 65 65 82
m
ic
ro
st
ra
in
Loading Combinations (Inflation kPa, half axle load kN)
Dual Tyre
WBT
0 20 40 60 80 100 120
620 520 620 820 620
52 65 65 65 82
m
ic
ro
st
ra
in
Loading Combinations (Inflation kPa, half axle load kN)
Dual Tyre
WBT 2
[image:9.612.116.505.308.554.2]For Review Only
Figure 9 Comparison of the maximum compressive strain on the subgrade for a dual and wide-base tyre
The distribution of the differences between the two tyres is interesting. The half axle load of 65 kN results in the two values being rather close for the maximum shear on the pavement surface and the three inflation pressures (Figure 5). However, at the two extremes of axle load there is a large variation between the two tyres. The 52 kN half axle load had a difference of 31 microstrain and the 82 kN had a difference of 46 microstrain (Figure 5). This gave percentage differences of 51% and 53% respectively. The percentage difference was calculated as the average of the two values being compared divided by the difference between the values and then multiplied by 100 to give a percentage value. Therefore, in these two cases the wide-base tyre would cause much greater shear strain on the surface. This would contribute to increased deterioration of the pavement probably through top-down cracking.
The shear strain in the asphalt between 50-80 mm from the surface shows considerable differences between the two tyres. The wide-base tyre has created higher values for all the loading combinations. The greatest difference was for the 82 kN half axle load which was 47 microstrain, a percentage difference of 37% (Figure 6). Overall the average difference between the two tyres for this strain was 33 microstrain, a percentage difference of 28%. This was a considerable difference and demonstrates that the wide-base tyre with the same loads and inflation pressure would be more damaging to this pavement. These strains would lead to asphalt rutting and could cause cracking that could coalesce with top-down cracking to cause deep cracks in the pavement.
The longitudinal tensile strain at the bottom of the asphalt pavement was less than the asphalt shear. There was a good degree of variability of the difference between the two tyres across the different combinations of half axle loading and inflation pressure (Figure 7). The greatest variability, as for the surface shear, can be seen for the highest and lowest half axle loads. The 52 kN half axle load gave a difference of 27 microstrain, the 82 kN half axle load’s difference was 20 microstrain. This gave percentage differences of 31% and 21% respectively and an overall percentage difference
0 50 100 150 200 250 300 350
620 520 620 820 620
52 65 65 65 82
m
ic
ro
st
ra
in
Loading Combinations (Inflation kPa, half axle load kN)
Dual Tyre
WBT 2
For Review Only
of 17%. Therefore, the wide-base tyre carrying the same loads and having the same inflation pressure would have more of a propensity to cause bottom-up cracking.
The transverse tensile loading at the bottom of the asphalt layer exhibited a large difference between the two tyres across all the loading combinations (Figure 8). The wide-base tyre exhibits much higher strain values compared to the dual tyre. As with the longitudinal strain the difference was greatest for the highest and lowest half axle load. The lowest giving a difference of 41 microstrain and the highest giving a difference of 43 microstrain. This gave percentage differences of 61% and 59% respectively. The overall difference for all the values was 34 microstrain giving a percentage difference of 48%. This means the wide-base tyre has a negative impact on the life of the pavement for the same axle loading and inflation pressure.
The final measure of the two tyres’ performance was the vertical strain on the top of the subgrade. The three values for the 65 kN half axle load were in reasonable agreement (Figure 9). The 52 kN and 82 kN half axle load values showed a big difference between the two tyre types. The wide-base tyres show much greater values for these loading combinations. The difference for two of them was 51 microstrain and 50 microstrain respectively. This gave a percentage difference for each of them of 23% and 17% respectively. This is a large increase to experience for a tyre that has the same loading combinations as the alternative. This highlights that even at the top of the subgrade, which is 450mm from the loading area, the effects of the tyre type can be felt.
Discussion
The two tyres with the same loads and same inflation pressures were tested against each other to see if one could replace the other without undue change to the strain in the pavement. This was most definitely not the case as the wide-based tyre created higher strains for every location and strain measured. The shear strain on the surface was similar over the 65 kN axle load but for the lower 52 kN and higher 82 kN there was a large increase for the wide-base tyre. The situation for the shear strain in the asphalt gave consistently higher strains for the wide-base tyre across all the loading scenarios. This would no doubt increase the propensity of the pavement to crack or rut. The longitudinal and transverse tensile strain at the bottom of the pavement also gave higher readings for the wide-based tyre. The strain on the top of the subgrade was much closer for the two tyres in comparison to the other strains. The wide-base tyre was still the highest though.
These results point to a clear outcome that the wide-base tyre causes varying degrees of increased strain on this pavement compared with a dual tyre for the same axle load and inflation pressure. Therefore, the adoption of the wide-base tyre compared to the dual tyre increases the strain in pavement at key locations for pavement distress. This means by consequence the pavement becomes damaged quicker than if dual tyres were used. The use of wide-base tyres reduces rolling resistance and fuel cost making truck transport cheaper for the haulier. These savings may not be passed on to consumers but the cost of more road maintenance must be financed by the road owner which is usually from the public purse.
For Review Only
Conclusions
The results and discussion presented in the preceding sections allow a number of conclusions to be drawn from the research conducted. These conclusions are in the context of the model used, the ranges of inflation pressure and axle loading available for each tyre type.
• A wide-base tyre for the same axle loadings and inflation pressures creates higher strain across all presented strain measurements than a dual tyre with the same loading combinations. This would suggest that the wide-base tyre would be the most damaging tyre for the presented axle loading and inflation pressure.
• The greatest strain recorded was for the asphalt shear strain and this was the strain that had the greatest and most consistent difference between the two tyre types. This would suggest that the wide-base tyre would have increased rutting.
• The difference between the wide-base tyre and the dual tyre were greatest at the extremes of axle loading for the presented strain measurements for the direct comparison. This would suggest that the wide-based tyre performs worse the further it is operating from its
recommended inflation pressure and axle loading.
This means by consequence the pavement becomes damaged quicker with wide-based tyres than if dual tyres were used. This could lead to more maintenance interventions in the future and a higher cost of operating the pavement.
Acknowledgements
The authors would like to acknowledge the support of the European Commission under the Marie Curie Intra-European Fellowship Programme. The authors would like to thank the CAPA-3D group at TU Delft under the leadership of Prof. Tom Scarpas for their help.
References
[1] Pottinger, M, “The three-dimensional contact patch stress field of solid and pneumatic tires,” Tire Science and Technology, 20(1), 1992, pp. 3-32.
[2] De Beer, M., Fisher, C., and Jooste, F. J., “Determination of pneumatic tyre/pavement interface contact stresses under moving loads and some effects on pavements with thin asphalt surfacing layers,” In Proceedings of the 8th International Conference on Asphalt Pavements, Seattle, Washington, USA, 1997, Vol. 1, pp. 10-14.
[3] Myers, L. A., Roque, R., Ruth, B. E., and Drakos, C., “Measurement of Contact Stresses for the Different Truck Tire Types to Evaluate their Influence on Near-Surface Cracking and Rutting,”
Transportation Research Record (1655), 1999, pp. 175-184.
[4] Blab, R., “Introducing Improved Loading Assumptions into Analytical Pavement Models Based on Measured Contact Stresses of Tires,” Paper presented at the International Conference on Accelerated Pavement Testing, Reno, NV, USA, 1999.
[5] Fernando, E. G., Musani, D., Park, D. W., and Liu, W., Evaluation of effects of tire size and inflation
pressure on tire contact stresses and pavement response (No. FHWA/TX-06/0-4361-1), 2006.
For Review Only
[6] Wang, G., and Roque, R., “Three-Dimensional Finite Element Modeling of Static Tire-Pavement Interaction,” Transportation Research Record: Journal of the Transportation Research Board, 2155 (-1), 2010, pp. 158-169.
[7] Siddharthan, R. V., Yao, J., and Sebaaly, P. E., “Pavement strain from moving dynamic 3D load distribution,” Journal of Transportation Engineering-Asce, 124(6), 1998, pp. 557-566.
[8] Perret, J., “The effect of loading conditions on pavement responses calculated using a linear-elastic model,” Paper presented at the Proceeding of the 3rd International Symposium on 3D Finite
Element for Pavement Analysis, Design and Research, 2002, pp. 283-303.
[9] Novak, M., Birgisson, B., and Roque, R., “Tire Contact Stresses and Their Effects on Instability Rutting of Asphalt Mixture Pavements: Three-Dimensional Finite Element Analysis,” Transportation Research Record: Journal of the Transportation Research Board, 1853(-1), 2003, pp. 150-156.
[10] Park, D.-W., Fernando, E., and Leidy, J., “Evaluation of Predicted Pavement Response with Measured Tire Contact Stresses,” Transportation Research Record: Journal of the Transportation Research Board, 1919(-1), 2005, pp. 160-170.
[11] Luo, R., and Prozzi, J. A. “Pavement responses at asphalt surface under measured 3-d tire-pavement contact stresses,” University of Texas, Texas, USA, 2006.
[12] Collop, A. C., and Cebon, D., “A theoretical analysis of fatigue cracking in flexible pavements,” Proceedings of the Institution of Mechanical Engineers, Part C, Mechanical engineering science., 209(5), 1995, pp. 345.
[13] Casey, D. B., Collop, A. C., Grenfell, J. R., and Airey, G. D., “Stress Intensity Factors at the Tip of a Surface Initiated Crack Caused by Different Contact Pressure Distributions,” Procedia-Social and Behavioral Sciences, 48, 2012, pp. 733-742.
[14] Casey, D. B., Grenfell, J. R., and Airey, G. D., “3-D longitudinal and transverse cracking and the influence of non-uniform contact pressure on the stress intensity factors of these Cracks,”
In Transport Research Arena (TRA) 5th Conference: Transport Solutions from Research to
Deployment, 2014.
[15] Marshek, K. M., Hudson, W. R., Connell, R. B., Chen, H., and Saraf, C., Experimental investigation of truck tire inflation pressure on pavement-tire contact area and pressure distribution: Center for Transportation Research, the University of Texas at Austin, Texas, USA, 1985.
[16] De Beer, M., Kannemeyer, L., and Fisher, C., “Towards improved mechanistic design of thin asphalt layer surfacings based on actual tyre/pavement contact stress - in - motion (sim) data in South Africa,” 7th conference on asphalt pavements for Southern Africa, South Africa, 1999.
[17] Novak, M., Birgisson, B., and Roque, R., “Near-surface stress states in flexible pavements using measured radial tire contact stresses and ADINA,” Computers & Structures, 81(8-11), 2003, pp. 859-870.
[18] Douglas, R., Alabaster, D., and Charters, N., “Measured Tire-Road Contact Stresses
Characterized by Tire Type, Wheel Load, and Inflation Pressure,” Paper presented at the 2008 Annual
Conference of the Transportation Association of Canada, Toronto, Ontario, Canada, 2008.
[19] Prozzi, J. A., and Luo, R., “Quantification of the joint effect of wheel load and tire inflation pressure on pavement response,” Transportation Research Record, (1919), 2005, pp. 134-141. 2
For Review Only
[20] Al-Qadi, I., and Wang, H., “Impact of Wide-Base Tires on Pavements,” Transportation Research Record: Journal of the Transportation Research Board, 2304(-1), 2012, pp. 169-176.
[21] De Beer, M., “Reconsideration of tyre-pavement input parameters for the structural design of flexible pavements,” Paper presented at the 10th International Conference on Asphalt Pavements, Canada, Quebec City, 2006.
[22] Al-Qadi, I. L., and Wang, H., Evaluation of pavement damage due to new tire designs, Illinois Center for Transportation, 2009.
[23] Greene, J., Toros, U., Kim, S., Byron, T., and Choubane, B., “Impact of Wide-Base Single Tires on Pavement Damage,” Transportation Research Record: Journal of the Transportation Research Board, 2155(-1), 2010, pp. 82-90.
[24] Casey, D. B., Grenfell, J.R., and Airey, G.D., 3-D Truck Tire Contact Pressures and Key Pavement Strains for a Thin Pavement, Transport Research Board (TRB) 95th Annual Meeting, Washington DC, 2016.
[25] Scarpas, A. A mechanics based computational platform for pavement engineering. (Ph.D.), 2004, TU Delft.
[26] De Jong, P. D., and Peutz, M. (1973). Korswagen. A R. Computer program BISAR layered systems
under normal and tangential surface loads, Koninklijke/Shell Laboratorium, Amsterdam, External
Report AMSR, 6, 1973. 2
For Review Only
2For Review Only
2For Review Only
For Review Only
2For Review Only
0 20 40 60 80 100 120
620 520 620 820 620
52 65 65 65 82
m
ic
ro
st
ra
in
Loading Combinations (Inflation kPa, half axle load kN)
Dual Tyre
WBT
For Review Only
0 20 40 60 80 100 120 140 160 180
620 520 620 820 620
52 65 65 65 82
m
ic
ro
st
ra
in
Loading Combinations (Inflation kPa, half axle load kN)
Dual Tyre
WBT
For Review Only
0 20 40 60 80 100 120 140
620 520 620 820 620
52 65 65 65 82
m
ic
ro
st
ra
in
Loading Combinations (Inflation kPa, half axle load kN)
Dual Tyre
WBT
For Review Only
0 20 40 60 80 100 120
620 520 620 820 620
52 65 65 65 82
m
ic
ro
st
ra
in
Loading Combinations (Inflation kPa, half axle load kN)
Dual Tyre
WBT
For Review Only
0 50 100 150 200 250 300 350
620 520 620 820 620
52 65 65 65 82
m
ic
ro
st
ra
in
Loading Combinations (Inflation kPa, half axle load kN)
Dual Tyre
WBT