423
ELM BASED DETECTION OF ABNORMALITY IN RETINAL
IMAGE OF EYE DUE TO DIABETIC RETINOPATHY
T.VANDARKUZHALI*, DR.C.S RAVICHANDRAN#,
*Assistant Professor, Hindusthan College of Engineering and Technology, Coimbatore-641032.
#Dean of EEE, Sri Ramakrishna Engineering College, Coimbatore-641032.
E-mail: *[email protected] , #[email protected]
ABSTRACT
Efficient detection of blood vessels for retinal vasculature disorder analysis paves way for important roles in diagnosing diabetic retinopathy. It can be done by the comparison of the states of retinal blood vessels. This paper proposes a method for the Retinal image analysis by efficiently detecting the retinal blood vessels and recognizes the retina to be normal or abnormal. The proposed work uses an Extreme Learning Machine (ELM) approach and Probabilistic Neural Network for blood vessel detection in digital retinal images. Feature extraction is done on retinal image by the application of Discrete Wavelet Transform. The green channel is selected for image analysis to extract vessels accurately. This approach is based on pixel classification using a 7-D feature vector obtained from pre-processed retinal images and given as input to an ELM. ELMs parameters can be analytically determined rather than being tuned. Simulated results will be shows that the blood vessels can be effectively detected from retina images with parametric evaluation to measure the algorithm efficiency.
Keywords: Retinal Images, Diabetic Retinopathy, Discrete Wavelet Transform, Extreme Learning Machine (ELM)
1.
INTRODUCTIONDiabetic retinopathy (DR) is one of the most grievous and eye disease in the world; it is the most common cause of blindness in adults between 20 and 60 years of age. DR is a silent disease in its first stages, i.e. many patients are not aware of its presence, it often remains undiagnosed until serious vision impairment occurs. To build an expert system that is able to perform the diagnoses task needed to use digital retinal images. Retinal images provide considerable information on pathological changes caused by local ocular disease which reveals diabetes. By imaging the retina of a person with a special camera, then using image processing and pattern recognition technique to analyze that retina make a specific diagnoses decision [1].
One of the important procedures performed on the digital retina is the edge detection of blood vessels of the retina [7]. A specialized edge detection algorithm may be needed since traditional edge detection technique might not be able to exactly segment the vessels from the background of the retinal image. Accurate vasculature segmentation is a difficult task for several reasons such as the presence of noise, the low contrast between vessels and background and
the variability of vessels width, brightness, and shape. Several methods have been proposed for this purpose, matched filer, morphology edge detection, and ridge based vessel segmentation which is called pixel classification, tracking methods, supervised classification and wavelet transform.
Also, due to the reflection on the tiny odd surface of the soft tissue of retina, the low contrast between the vessels and background and the pathological variations, detecting blood vessels automatically from a retinal image is a challenging problem [10]. Many methods have been used for retinal vessel segmentation. These can be divided into two groups: rule-based methods and supervised method.
424 objective of vessel segmentation algorithm is automated detection of eye diseases.
2.
MATERIALS AND METHODSThis paper proposes a supervised approach for retinal blood vessel detection based on an Extreme Learning Machine (ELM) for pixel classification. Retinal images used to create database were collected from a reputed eye hospital, Lotus Eye Care Hospital, Coimbatore. Probabilistic Neural Network (PNN) is used to train database images because this network requires very short time for training.
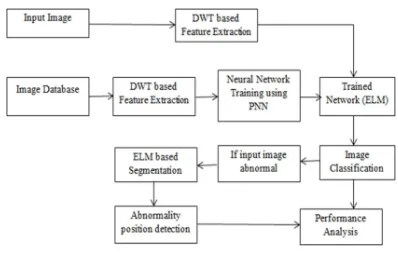
The following processes take place to classify retinal image as normal or abnormal
1. Green plane extraction from original image.
2. Feature extraction based on Discrete Wavelet Transform for numerical representation of pixels.
3. Training the database images using Probabilistic Neural Network (PNN). 4. Classification of Image as normal or
abnormal
[image:2.595.93.292.574.702.2]5. If image is classified as abnormal, segmentation is done to find the approximate position of abnormality. The process flow of the proposed method is shown in the Figure 1.
Figure 1 Proposed System
A. Green Channel Separation
Each and every colour images will be having its own characteristics based on the primary colour representation specifically termed to be RGB analysis. Each plane can be separated alone such that this type of function is called as planar separation. All the colour images will be decomposed initially into gray scale image, such that then only the desired feature can be extracted drastically. From original RGB retinal image, the green band is extracted so that the input image is monochrome. The green channel provides the best vessel-background contrast of the RGB representation, while the red channel is the brightest colour channel and has low contrast, and the blue one offers poor dynamic range. Thus, blood containing elements in the retinal layer (such as vessels) are best represented and reach higher contrast in the green channel. As this system has to be applied on retinal images of different sizes, input image has to be resized.
B. Discrete Wavelet Transform (DWT) based Feature Extraction
The goal of the feature extraction stage is pixel characterization by means of identification of a feature vector which may be easily used in the classification stage to resolve whether pixels belong to a real blood vessel or not. In this method discrete wavelet transform is applied on the green channel image for feature extraction. The advantage of wavelet is its multiscale analysing capability in tuning to specific frequencies, allowing noise filtering and blood vessel enhancement in a single step. Wavelets are especially suitable for detecting singularities (e.g. edges) in signals, extracting instantaneous frequencies. In order to reduce dimensionality of image, DWT is used for image compression and feature extraction process[4].Because of their inherent multi-resolution nature, wavelet-coding schemes are especially suitable for applications where scalability and tolerable degradation are important.
425
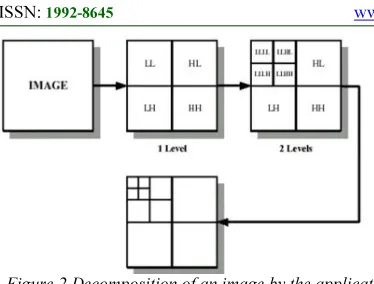
Figure 2.Decomposition of an image by the application of 2D Discrete Wavelet Transform
It decomposes the image into four sub-images such as LL, HL, LH and HH. LL is the approximate image of input image, it is low frequency sub-band so it is used for further decomposition process. LH sub-band extracts the horizontal features of original image HL sub-band gives vertical features and HH sub-band gives diagonal features. DWT is implemented in Matlab by using low-pass and high-pass filters. High pass filtering produces detail information (such as edges) and low pass filtering with scaling produces coarse approximations. The edge features are present in the high frequency bands .DWT not only gives the frequency content of the image but also provides edge localization [4]. Implementation of DWT produces Wavelet energy features that contain the important texture features of the image. The features can be obtained by using families if wavelet filters such as daubechies, symlets, and bi-orthogonal wavelets.
Average coefficients and energy of the extracted features are obtained using the following formulae
C. Training using Probabilistic Neural Network (PNN)
A Probabilistic Neural Network (PNN) is a classifier which maps any input pattern into a number of classifications. PNN is used for training database image due to its advantages like fast training quality, converges to an optimal classifier
as the size of the representative training set increases and Training samples can be added or removed without extensive retraining [6] .
The operations in PNN are organized into a multilayered feed forward network with four layers as one input layer two hidden layers and an output layer. The two hidden layers are pattern layer and a summation layer. The input layer compute the distance from the input vector to the training input vectors when there is an input.Pattern layer consists of pattern units that represents information on one training sample. It calculates the probability of how close is the input vector to it. Summation unit decides upon the individual results of each pattern unit in which pattern the input vector finally belongs.Output layer performs again a calculation to give the output a physical meaning.
D. Classification
A classification procedure assigns one of the classes: vessel or non vessel to each candidate pixel when its representation is known. For vasculature segmentation in retinal images, use of a nonlinear classifier is necessary for better accuracy. The kNN method, support vector machines, Bayesian classifier or neural networks comes under non-linear classifier [7]. Extreme Learning Machine classifier is proposed in this paper.
Extreme Learning Machine
Extreme learning machine (ELM) is a simple learning algorithm for Single Hidden Layer Feed forward Neural networks [4]. ELM will randomly select the input weights and analytically determines the output weights of SLFNs. The learning speed of ELM is thousands of times faster than traditional feed forward network learning algorithms like back-propagation (BP) algorithm while obtaining better generalization performance [8]. All the parameters can be analytically determined rather than being tuned. The hidden node parameters are completely independent from the training data. ELM can approximate any target continuous function and classify any disjoint regions.
The main features of ELM are minimum training errors, smallest norm of weights, best generalization performance and the minimum norm least-square solution is unique [4]. The structure of ELM network contains an input layer, hidden layer and an output layer.
426 Given a training set N, activation function g(x) and hidden neuron Ñ. Assign random value to the input weight wi and the bias, bi=1 ,…., Ñ.
1. Find the hidden layer output matrix H. 2. Then find the output weight β^ = H+T Where β, H and T are defined in the same way they were defined in the SLFN.
E. Segmentation of abnormal image
Once the image is classified to be abnormal, segmentation is done to find the approximate position of abnormality in the blood vessels. The segmentation is performed by using clustering algorithm. Unsupervised clustering algorithm (k means) is used here to classify the input data that points into multiple classes based on their inherent distance from each other. This method will extract the position of abnormality in the blood vessels from the retinal fundus image.
3. RESULTS
The proposed method was tested on images of healthy retinas and images of retinas with disease . All these images were acquired using a Fundus Camera system, Zeiss VISUCAM 500 with field angle 45° and 30° with capture modes Color, red-frfundus ee, blue and red pictures, and pictures of the anterior segment, as well as fluorescein angiography (FA).All the retinal images were collected from Lotus Eye Care Hospital, Coimbatore.
The proposed method is used to find the approximate position of abnormality present in the blood vessels of the retina. Extreme Learning Machine (ELM) is used for the classification if the image as normal or abnormal. If the image is found to be abnormal segmentation is done using clustering algorithm to find the approximate position of abnormality in the retinal blood vessels.
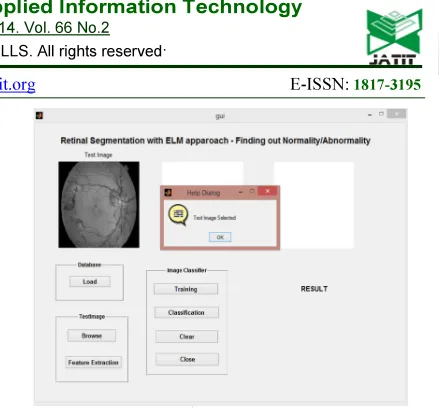
[image:4.595.297.517.73.278.2]The proposed method is simulated using MatlabR2013a.The gui screen with test image loaded is shown in Figure 4.The gui screen has push buttons for loading the data base, browse the test image, extracting feature, training and classification. After loading the database, the test image can be loaded. Feature extraction is done on the test image.
Figure 4.The GUI screen with test image loaded
Figure 4 shows the gui screen of the input image classification.After loading the database and test image, feature extraction is done using wavelet filter families.Training is given to the database image using Probablisitic Neural Network (PNN) and classification of the test image is done using Extreme Learning Machine(ELM) and Figure 5 shows the result of classified normal image. Performance of the system is determined by calculating MSE and PSNR values in Fig 7.
Figure 5.The GUI screen with normal classified image.
[image:4.595.305.511.449.611.2]427
Figure 6. The GUI screen with image classified as abnormal
G Performance Analysis
It is done by calculating Mean square error and Peak signal to noise ratio for each input given to the system.
Mean square error quantifies the difference between values implied by the system and the true values of the quantity being estimated.
Peak signal to noise ratio is the ratio between the maximum possible power of a signal and the power of corrupting noise that affects the fidelity of its representation. The signal is the original data, and the noise is the error.
TABLE1
PSNR and MSE values of images
Figure 7. PSNR and MSE values of images
The quality of the image can be know from the graph of PSNR vs MSE.As shown in the Figure 7,for normal images the valve of Mean Square Error (MSE) is very Small which there by gives high values of Peak Signal to Noise Ratio (PSNR). The value of MSE increases there by causing decrease in the value of PSNR. For the normal images of eye the value of PSNR comes above 70db.As the stage of diabetc retinopathy progresses the value of PSNR goes on decreasing.In the severe stage of Diabetic Retinopathy the blood vessels are more effected.In the images of eye suffering from severe Diabetic Retinopathy the value of Mean Square Error increases which leads to low value of PSNR.
4. CONCLUSION
The proposed method is used to find the approximate position of abnormality present in the retinal blood vessels. The image classification is done using Extreme Learning Machine (ELM) is used for classification and clustering algorithm is used to find the approximate position of abnormality in the blood vessels. The proposed method does pixel classification, in conjunction with wavelet transform, probabilistic neural network (PNN) and Extreme Learning Machine (ELM).It provides noise-robust vessel segmentation. Wavelets are especially suitable for detecting singularities (e.g. edges) in signals, extracting instantaneous frequencies, and performing fractal and multifractal analysis-Applying the wavelet transform allows noise filtering and blood vessel enhancement in a single step. This makes the proposed method simple.
PSNR MSE
28.0501 10.1875
28.2466 9.7369
28.5625 9.0537
28.6932 8.7854
28.7866 8.5984
28.8607 8.4529
28.8805 8.4145
28.8959 8.38
29.115 7.9722
29.458 7.3668
29.7603 6.8715
30.002 6.4995
[image:5.595.88.283.560.742.2]428 Our results demonstrate that the system is well suited to complement the screening of DR and may be used to help the ophthalmologists in their daily practice. .
Images were collected from Lotus Eye Care Hospital and both normal and abnormal retinal images were tested.
. REFRENCES:
[1] Behdad Dashtbozorg, Ana Maria Mendonça and Aurélio Campilho, “An Automatic Graph-Based Approach for Artery/Vein Classification in Retinal Images”, IEEE transactions on Image Processing, Vol. 23, No. 3, March 2014
[2]Hasan Demirel and Gholamreza Anbarjafari,” Discrete Wavelet Transform-Based Satellite Image Resolution Enhancement”, IEEE transactions on Geoscience and Remote sensing, Vol. 49, No. 6, June 2011
[3] Narayanan Sreekumar, Lt. Dr. S. Santhosh Baboo, ”Image Compression using Wavelet and Modified Extreme Learning Machine”, Computer Engineering and Intelligent Systems, Vol 2 ,No 2,2011
[4]Qin-Yu Zhu,Chee-KheongSiew,”Extreme LearningMachine: A New Learning Scheme of FeedforwardNeuralNetworks”,Neurocomputing. Vol.70,pp.489-501, 2006.
[5] K Manikantan, Milan S Shet, Minal Patel, S Ramachandran,” DWT-based Illumination Normalization and Feature Extraction for Enhanced Face Recognition”, International Journal of Engineering and Technology, Vol 1 ,No.4Pages 483-504,2012
[6] Deepa M,” Wavelet and Curvelet based Thresholding Techniques for Image Denoising”, International Journal of Advanced Research in Computer Science and Electronics Engineering (IJARCSEE),Vol 1, Issue 10, December 2012 [7] Wawan Setiawan and Wiweka,” Combining of
Image Classification With Probabilistic Neural Network (PNN) Approaches Based on Expectation Maximum (EM)”, IJCSI International Journal of Computer Science Issues, Vol. 9, Issue 4, No 3, July 2012.
[8] Diego Marín, Arturo Aquino, Manuel Emilio Gegúndez-Arias, and José Manuel Bravo, "A
New Supervised Method for Blood Vessel Segmentation in Retinal Images by Using Gray-Level and Moment Invariants-Based Features", IEEE Transa. Med. imaging, Jan 2011.
[9] Yuedong Song, Pietro Liò,” A new approach for epileptic seizure detection: sample entropy based feature extraction and extreme learning
machine”, J. Biomedical Science and Engineering, 2010, 3, 556-567.
[10] Tao Song, Mo M. Jamshidi Roland R. Lee, and Mingxiong Huang, “A Modified Probabilistic Neural Network for Partial Volume Segmentation in Brain MR Image”, IEEE transactions on Neural Networks, Vol. 18, No. 5, September 2007