Geometry Optimization and Characterization of
Three-phase Medium Frequency Trasnformer for
10kVA Isolated DC-DC Converter
Youngsil Lee, Gaurang Vakil, Alan. J. Watson, Patrick W. Wheeler
Power Electronics, Machines and Control Research GroupThe University of Nottingham Nottingham, UK [email protected]
Abstract— Three-phase Dual Active Bridge converter is advisable for the High-power DC-DC conversion system. In the ac link, galvanically isolated transformer operated at a medium frequency range provides stepping up or down of the secondary bridge voltage. This paper provides a magnetic design optimization of the medium frequency transformer for maximizing its efficiency when excited by a non-sinusoidal waveform. In this paper, a mathematical design of a 10kVA non-sinusoidal transformer had been developed and validated using two-dimensional (2D) transient finite element analysis (FEA). The set of selected design variables is defined in order to enhance the power density and efficiency of the targeted transformer and an optimization is carried out. Finally, a 10kVA transformer is prototyped and the results of core losses for non-sinusoidal excitation is confirmed experimentally.
Keywords—Transformer, Non-sinusoidal excitation, Optimization, Dual Active Bridge Converter, Transient finite element analysis
NOMENCLATURE
ϕ
Phase shift angleσ
L Stray inductance
p w
A_ Primary conductor area
s w
A_ Secondary conductor area
Jp[A/mm²] Current density of primary winding
Js[A/mm²] Current density of secondary winding
I. INTRODUCTION
Today, Three-Phase Dual Active Bridge (3DAB) converter is highly being attractive topologies for Medium-Voltage DC (MVDC) and High-Voltage DC (HVDC) applications. A 3DAB converter suitable for high-power applications has been studied first in [1] and then detailed investigation results of the converter using simulation and experimental works have been presented in [2]. The proposed 3DAB converters are operating in the symmetric six-step switching mode with a 50 % duty
cycle for each phase legs. The three-phase legs operate with a 120° phase shift from each other at the fundamental switching frequency. The 3DAB converter is also suitable for bi-directional power flow and buck-and-boost converter applications, in which the transformer has a different turn ratio. In [3], a new novel asymmetrical duty cycles method has been in introduced. The 3DAB converter can also be operated using soft switching with a wide range of operation while the switches are turned on at the zero voltage across point of the switch. A current-fed topology for the 3DAB converter has been proposed in [4] to improve efficiency for the wide operating range. However, the drawback of the topology is that a large DC inductor is required to lower the primary side current ripple comparted to voltage-fed topology.
Various modulation schemes for the 3DAB converter to improve the problem of poor efficiency at partial load conditions have been proposed and comparted in [5]. The proposed new combined modulation of the 3DAB with triangular and trapezoidal can be optimized to overcome the poor performance at low load conditions.
Recently, design considerations of multi-megawatts scale converters haven been studied in [6-11]. Especially, [9] introduced a constructed 2.2MVA prototype. One of key parts components of the 3DAB converter is a high-power galvanic transformer which enables isolation from the MV line for safety reasons and also allows for soft-switching control, which can dramatically reduce the switching losses. [12] presents a detailed design optimization of a three-phase transformer for 4 MW large scale step-up 3DAB converter. In
in
V
N1:N2
p
L
LV Bridge
out
V s
L
MV Bridge 1
p C
2
p C
1
s C
2
s C
in
I
p C I
3DAB_pri
i
1
S
2
S S4 S6 3
S S5
a
i
b
i
c
i
r
i
s
i
t
i
7
S S9 S11
8
S S10 S12 out
I
s C I
3DAB_sec
[image:1.595.307.554.260.358.2]i
order to validate the core losses under non-sinusoidal excitation, the improved generalized Steinmetz equation (iGSE) [13] has been generally used.
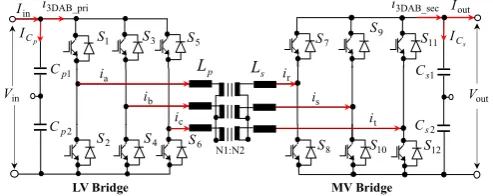
The topology of the 3DAB converter is shown in Fig. 1. The 3DAB converter has the advantages of higher power capability and smaller passive filters than the single-phase dual-active bridge (1DAB) type [14]. The 3DAB converter has two active voltage sourced bridges which are magnetically connected using a medium-frequency (MF) transformer. The primary side bridge converts the DC input voltage into a medium-frequency AC voltage that is applied to the MF transformer; the voltage at the secondary terminals of the transformer is then rectified by the secondary side bridge. The phase shift angle
ϕ
also introduces a load angle between the primary and secondary windings of the transformer. It leads to a voltage drop across the stray inductances, which results in a current being introduced by a six-step voltage generated at the transformer. The power can be transferred by the phase shift angleϕ
.For high power energy conversion application, design methods of single-phase transformers operating at medium or high frequencies are introduced [15-17]. More recently, in [18], estimations of core losses with non-sinusoidal excitation in medium/high frequency transformer are introduced.
This paper explores design & optimisation and performance evaluations, for high efficiency, of a three-phase transformer for 10kVA rated 3DAB converter. The 3DAB converter converts the input voltage to the MVDC collection voltage up to 1kV. Also, an optimized 10kVA prototype is built up to validate the proposed design procedure and optimisation. In experimental validation, non-sinusoidal excitation was injected and measurements on silicon steel core and copper windings were conducted. The 3DAB Converter contains two active voltage sourced bridges that are linked through a medium-frequency (MF) Y-Y connected transformer whereby the benefits of using Y-Y configuration
are able to reduce circuiting current and improve unbalancing current problem.
II. DESIGN CONSIDERATIONS
A. Design procedure
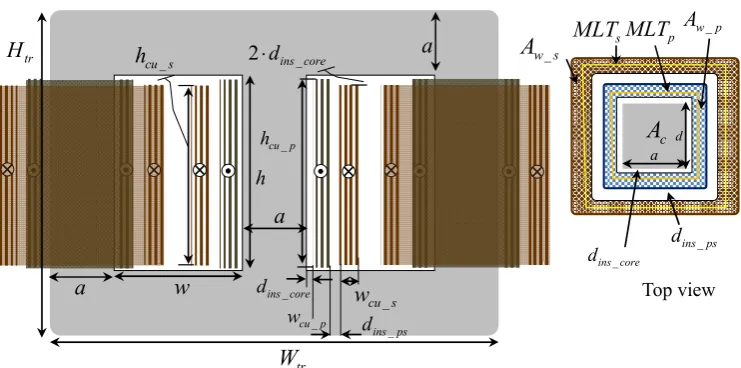
The proposed design procedure is described in [12]. In the first step, the geometry parameters are assigned with the free parameters, i.e. turns number on primary winding, current density for each windings, window area ratio, and core sectional area ratio, varied during the process in order to obtain an optimum result. The sinusoidal core loss and I2R loss in coppers are calculated with the geometry parameters. The calculated efficiency must be compared with the expected value to perform a high performance design. If both geometry and performance parameters are not satisfied the design requirements, the results are discarded and then the free parameters are modified to reanalysis. If the results are satisfied, stray inductance is calculated because the stray inductance value is one of important parameter for the 3DAB Converter operation. Once all design steps have been analyzed, the results are stored for validation of silicon steel core and copper losses in the course of the magnetic flux is piecewise linear using 2D FEA and a given object functions (i.e. efficiency, efficiency versus volume) can be established. In order to explain the design procedure, a three-phase core-type transformer shown in Fig. 2 is used.
In power electronics applications, increasing in operating frequency provides significant reduction of the core size but power loss density can be increasing. Consequently, it makes the cooling more difficult. Furthermore, skin and proximity effects increase the winding losses. From the current density for the given cooling system, the calculated conductor diameter must be kept smaller than twice the skin depth of the operating frequency in order to keep the skin effect to the minimum. If the calculated diameter is larger than twice the
w
h
core ins
d _
p cu
w _
ps ins
d _
s cu
w
_ scu
h
_p cu
h _
tr
W
trH
2⋅dins_corea
c
A
a d
core ins
d _
ps ins
d _
p
MLT
s
MLT
s wA
_p w
A
_ Side viewTop view
a
[image:2.595.110.481.68.252.2]a
skin depth, parallel strands are added to satisfy the condition. The skin depth can be calculated as in (1)
0 μ μ π ρ δ ⋅ ⋅ ⋅ = r sw f (1)
Where,
ρ
is resistivity of the conductor and in copper case, this value is 1.68×10−8.r
μ
is relative magnetic permeability of the conductor andμ
0 is the permeability of free space which has the exact value of 4π×10−10H/mm.In terms of copper, μr =μ μ0 =0.999994. Where permeability of copper 1.256627 109[H/mm].× =
μ
B. Isolation layers
The designed isolation level’s influence the power density and must be included in the design process. Furthermore, the isolation level must meet with international standards. Partial discharge (PD) has to be considered at medium voltage level
above 3kV. The PD can destroy the isolation layers over the time. In this design, the continuous dielectric stress level of isolation material is not exceed 1.6kV/mm to avoid the risk of the PD. The required isolation level can be expressed with a minimum clearance distance as shown in Fig. 3. The required isolation distance between core and primary conductor area can be calculated as
(
pn s ins)
s core
ins k V E
d _ = ⋅ / _ (2)
Where
E
s_insis dielectric strength of the isolation materialgiven by the manufacturer and
k
sis safe factor typically 1.2 – 1.5 in this case.V
pn is a voltage applied in the isolation layers. Equation (2) can be used as a similarity calculation for between the conductors to be isolated follow(
pn sn s ins)
s ps
ins
k
V
V
E
d
_=
⋅
(
+
)
/
_ (3)Where the voltage applied in the isolation layers is equal to the sum of primary side and secondary side voltages. An isolation layer is also required on each winding turns of both conductors. For primary side turns, the isolation distance can be derived as (4)
(
pn s ins)
s p
ins k V N E
d _ = ⋅ ( / 1)/ _ (4)
The isolation distance for secondary side turns is
(
sn s ins)
s s
ins k V N E
d _ = ⋅ ( / 2)/ _ (5)
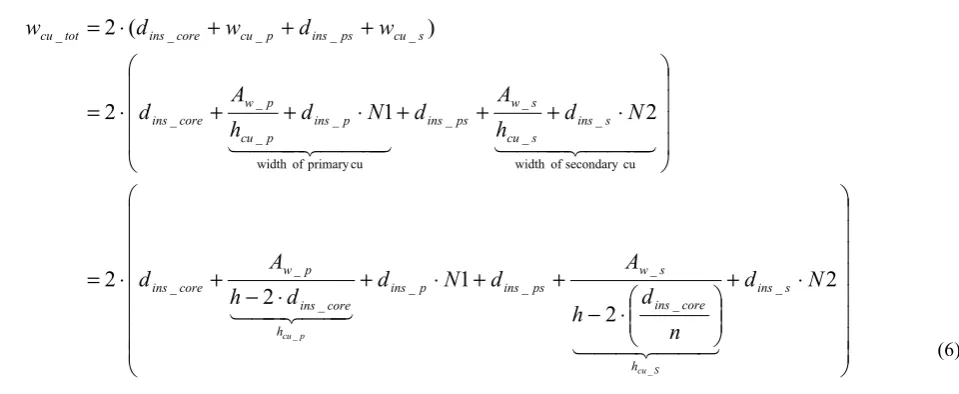
[image:3.595.71.551.516.713.2]The calculated window utilization factor, kc, with 10% increased for safety and should be greater than the estimated value, ku =0.4 in this case. If the estimated value is greater, the calculated value is taken as the initial value and design is repeated. The resulting isolation distances needs to be
Fig. 3. Winding width dimensions
calculated total width of conductor area which must be smaller than the width of window area. If this width is not fulfilled, the design is discarded and then set up new free parameters to be executing a new process. The total width of conductor area can be expressed as (6).
In order to ensure soft switching of the 3DAB Converter, a certain series inductance is required. Therefore, the selection of the stray inductance Lσhas great impact on the performance of the 3DAB Converter. Equation (7) represents a calculation of
L
σ using geometry depicted in Fig. 2. + + ⋅ ⋅ ⋅ = 3 3 1 _ _ _ 2 0 s cu ps ins p cu
p w d w
h MLT N
Lσ
μ
(7)
C. Magnetizing current
The magnetizing current is required to saturate the core to the peak operating flux density. In the analytical simulation model of 3DAB converter, only the stray inductance of the high power MF transformer was used and the effect of the magnetizing inductance was neglected. However, in practice, the magnetizing inductance has an impact on the transformer. In fact, the ratio of the magnetizing inductance is not large due to the design optimization and manufacturing of the transformer. In the 3DAB converter, the magnetizing current leads to additional reactive current in order to achieve the ZVS operation in low power transfer conditions. An example of the effect of magnetizing current on switching states in the 3DAB converter is shown in Fig. 4. As seen in Fig. 4, magnetizing current lags the phase voltage in the primary bridge and the secondary current leads to the phase voltage in the secondary bridge. As a consequence, the power electronics switches in the primary bridge turn on with the lagging current. Thereby, the anti-parallel diode is conducting the current prior to turn-on of the active semicturn-onductor switch (IGBT), resulting in ZVS turn-on. For the secondary bridge, the switch is turning on with ZVS, and turn-off with quasi-ZVS due to the leading current. Consequently, determining the magnetizing current is required in the design aspects such as enabling ZVS operation and an additional loss in the transformer.
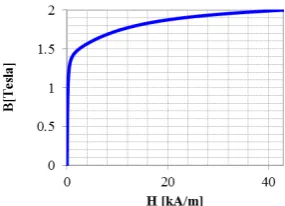
Material selected for the core is M-19 29 Gauge. Using the B-H curve of the material as shown in Fig. 5, the magnetizing force H (atcore, at/m) corresponding to flux density Bm in the core and H(atyoke,at/m)corresponding to flux density by in the
yoke can be calculated. The required magnetomotive forces (MMF) for the core and yoke can be calculated as
yoke W yoke s W s
w
MMF
h
MMF
at
4
at
3
⋅
⋅
=
⋅
⋅
=
(7)The MMF drop at the edges is 5 % to 10 % higher than theoretical value, the total MMF can be calculated as
(
core yoke)
tot MMF MMF
MMF =1.1⋅ + (8)
Peak value of the magnetizing current is
1 3 _ N MMF I tot peak m ⋅
= (9)
Finally, RMS value of the magnetizing current is
(
)
2 1 3 1 . 1 2 _ _ ⋅ ⋅ + ⋅ = = N MMF MMF IIm rms m peak core yoke (10)
In this case, 10% increase in the value of MMF is considered due to flux concentration at the corners of the window.
D. Power losses
With the defined geometric dimensions, it is required to calculate power losses in the transformer. In order to calculate copper loss, winding resistance must be calculated using mean length of turns (MLT) and number of turns as follow
s cu s cu s p cu p cu p A MLT N R A MLT N R _ _ 2 ,
1 ⋅ ⋅
= ⋅
⋅
=ρ ρ
(11)
Where
ρ
cuis resistivity of the copper and MLT for each windings can be calculated as shown in Fig. 2. The analytical calculation of primary and secondary side copper losses can be calculated as(
2 2)
_ _
_tot cu p cu s
3
p prms s srmscu
P
P
R
I
R
I
P
=
+
=
⋅
⋅
+
⋅
(12)dc_LV
V Lp
Primary Bridge dc_MV V s L Secondary Bridge p
R Rs
m
L Lm
n m p
i is
m i m i 1 S 2 S 2 D 1
D S7
[image:4.595.355.498.56.159.2]8 S 8 D 7 D
[image:4.595.38.276.189.365.2]Fig. 4. The effect of magnetizing current on switching state
Sinusoidal core loss can be expressed as Steinmetz equation. The core loss [W/kg] consists of hysteresis and eddy current loss and the loss can be expressed as Steinmetz equation
(
)
current eddy
2
hysteresis
0 h sw m e sw m
s k f B k f B
P = ⋅ α⋅ β + ⋅ ⋅
(13)
Finally, to determine the transformer core loss, the weight of the core is considerable effort as follow
core s s core s
s
P
weight
P
vol
P
=
0⋅
=
0⋅
ρ
⋅
(14)Where
ρ
sis mass density of core material given from manufacturer. Now, it is possible to calculate efficiency of the transformer using the power losses.III. OPTIMIZATION
A. Optimization
Once all analytical designed parameters have been defined, they must be sorted for a defined object functions and also validated. Fig. 5.8 shows an optimization process for the analytical design. In this design optimization, a set of five degrees of freedom are selected and required to be optimized. The optimization loop consists of 3 steps. In the first step shown in Fig. 6, all calculated parameters must be compared with the required criterion to be met by the developed design.
At the next step, accepted geometric designs with calculated stray inductance Lσ are validated using 2D FEA simulation for sinusoidal excitation. Once the FEA validations are satisfied with all the requirements, 3DAB converter simulation using PLECS is carried out using the calculated
σ
L and control phase
shift angle. In this step, the PLECS simulation generates actual non-sinusoidal waveforms. Using this actual waveform, a 2D FEA is performed to compute the losses of the non-sinusoidal transformer. At the final step, the resulting performance must also be compared with the requirements and if the design does not meet the expectation than it is discarded. Again all the designs that delivers the expected performance are sorted for a defined objective function to determine the optimum design.
For the transformer design optimization approach under consideration, efficiency, total weight, and stray inductance are required to be maximized with the minimization of the overall cost. For the performance optimization, the maximal efficiency is obtained according to
e
max
min(
,
,
)
and
η
η
=
P
coreP
cuI
mag≥
(15)σ η
L W I P P obj
tot mag cu
core⋅ ⋅ ⋅ ⋅
= e
fun (16)
The presented optimization employs the minimal Lσ in order to determine the minimal
ϕ
for low switching loss. In general, for a cost-optimized design, the minimal total weight [kg] is required to obtain the lowest material cost. For the design process, cost of material is taken as the total cost of the transformer.IV. OPTIMIZATION RESULTS
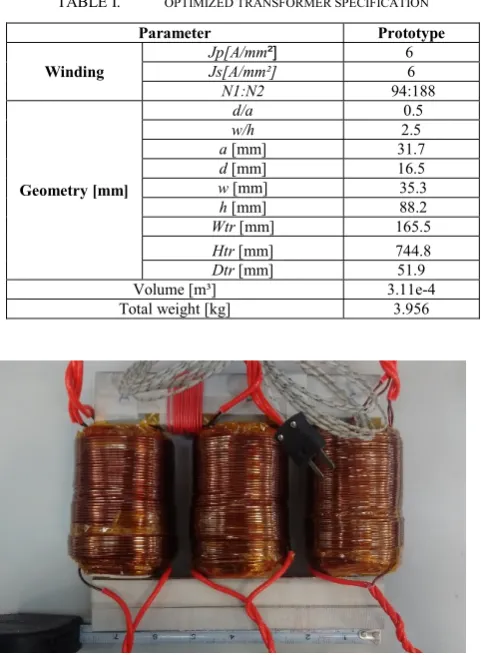
The proposed design and optimization presented above has been used to do dimensioning of a medium frequency transformer. The design inputs were specified for 10kVA 3DAB Converter with Vin=500VDC, Vout=1000VDC, Turn ratio = 0.5, and frequency = 1kHz. Silicon steel laminated core was chosen as core material in the transformer. Fig. 7 shows performance prediction of the 10kVA transformer which were optimized using the above procedure. As can be seen from Fig. 7(a), winding losses are increased with increasing the number of turns of the primary winding whilst core loss can be decreased. The efficiency graphs in Fig. 7(b) are very helpful, since they allow an optimum selection of the transformer for the given transformer VA rating and frequency, and in terms of stray inductances which they could be used for 3DAB Converter optimization as well. Using these results, optimum parameters were chosen in order to be assembled and tested. Design details of the optimized transformer are listed in Table 1. All the results were calculated and validated from the above procedure. Using these results, an optimized transformer prototype was manufactured for experimental characterization and validation. Fig. 8 shows a picture of the three-phase prototype transformer. This transformer consists of silicon steel laminated cores made from thin gauge steel (0.1mm thickness) and is fully instrumented for monitoring temperature in the
windings. The primary and secondary windings are star connected. The transformer prototyped in this work is able to operate at the given frequency with natural convention cooling.
TABLE I. OPTIMIZED TRANSFORMER SPECIFICATION
Parameter Prototype
Winding
Jp[A/mm²] 6
Js[A/mm²] 6
N1:N2 94:188
Geometry [mm]
d/a 0.5
w/h 2.5
a [mm] 31.7
d [mm] 16.5
w [mm] 35.3
h [mm] 88.2
Wtr [mm] 165.5
Htr [mm] 744.8
Dtr [mm] 51.9
Volume [m³] 3.11e-4
Total weight [kg] 3.956
V. CHARACTERIZATION OF THE DEVELOPED TRANSFORMER
A. Injection of actual excitation waveforms
To validate the influence of the non-sinusoidal excitation in the transformer, piecewise linear excitation of winding
current shown in Fig. 9 obtained from the 3DAB converter, is applied to the manufactured prototype. The shapes of the current can be introduced by six-step time intervals. For each interval, the terminal voltages are constants. The shapes of the current can be also changed depending on the phase shift angle between the two bridges of the 3DAB Converter. Using these excitation waveforms, the specific losses for the transformer used in 3DAB converter is determined.
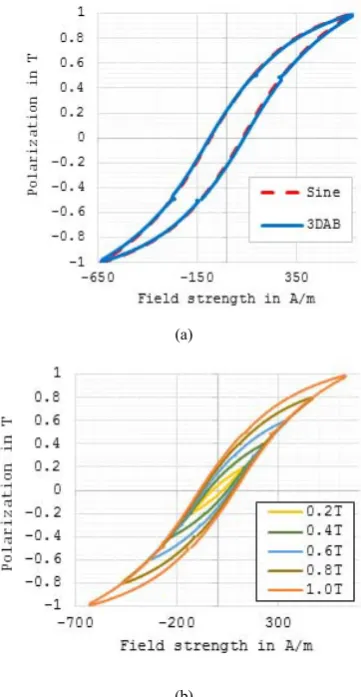
B. Measured hystersis loops
To determine the performance of the manufactured transformer for the actual non-sinusoidal excitation of the 3DAB converter, the core losses for the actual waveforms of the converter need to be determined. The measured hysteresis loops at two different excitations and by different polarizations are shown in Fig. 10. In Fig. 10(a), the blue solid graph represents the non-sinusoidal 3DAB excitation whereas the red dashed graph represents the sinusoidal excitation. It can be seen that the area spanned by the hysteresis loop of the 3DAB excitation is slightly larger, as a result the specific core losses for the 3DAB excitation tend to be higher than the pulse sinusoidal excitation.
C. Core loss characterization
Fig. 11 shows the measured transformer core losses in an actual piecewise waveform of 3DAB for different peak flux densities and the phase shift angle. It can be seen that the
(a) (b)
Fig. 7. Performance prediction of the 10kVA transformer: (a) power losses versus N1, (b) efficiency versus total kg of the transformer
[image:6.595.311.549.255.365.2]Fig. 8. A 10kW/1kHz prototype of 3DAB transformer
[image:6.595.41.282.300.628.2]losses decrease as well as the peak flux density decreases with increasing phase shift angle. Table II shows the experimental comparison of the analytical and the measured losses of the designed transformer. The obtained values are a close match.
TABLE II. COMPARISON OF ANALYTICAL AND MEASURED LOSSES
Parameter Analytical Experimental % Variation
Loss
Core [W] 237.4 215.6 -10.12%
Winding [W] 147.6 138.7 -6.42%
Imag[A] 2.4 2.26 -6.19%
Efficiency [%] 96.3 96.6 -0.32%
[ ]μH
σ
L 30.6 33.9 -9.74%
VI.CONCLUSION
This paper deals with a design optimization of a medium-frequency three-phase transformer for a 10kVA 3DAB DC-DC Converter, having 500VDC-DC and 1000VDC-DC rated input & output voltages. The procedure for optimum design was applied on a core-type transformer designed with non-oriented silicon steel core. The investigation on the optimization loop
shows efficiency versus volume and the sensibility of degrees of freedom such as the number of turns on the primary winding. Finally, the optimization was validated by 2D FEA simulation. Measurements show that the measured peak flux density is lower than the expected value. Also, the 2D FEA results of core loss and copper losses in both winding confirm that the core loss is higher than the winding losses since the transformer operates below full-load condition.
In the presented work, the transformer design optimization is discussed for actual non-sinusoidal excitation application and validated against the developed prototype. The analytical values over-estimates and hence, the design is on the conservative side. The analytical values are closely matching the measured values with measured efficiency just 0.32% higher and measured stray inductance 9.74% higher than the analytically predicted one.
REFERENCES
[1] R. De doncker, D. M. Divan, and M. H. Kheraluwala, "A three-phase soft-switched high-power-density DC/DC converter for high-power applications," in IEEE Transactions on Industry Applications, vol. 27, pp. 63-73, Jan-Feb 1991.
[2] J. Walter and R. W. De Doncker, "High-power galvanically isolated DC/DC converter topology for future automobiles", in Proc. PESC'03. 2003 IEEE 34th Annual 2003, pp. 27-32 vol.1.
[3] G.J. Su and L. Tang "A Three-Phase Bidirectional DC-DC Converter for Automotive Applications," in Proc. Industry Applications Society Annual Meeting 2008, IAS'08, pp. 1-7,2008.
[4] Z. Wang and H. Li "A Soft Switching Three-phase Current-fede Bidirectional DC-DC Converter With High Efficiency Over a Wide Input Voltage Range," in IEEE Transactions on Power Electronics, vol. 27, no. 2, pp.669-684,Feb 2012.
[5] H. van Hoek, M. Neubert and R.W. De Doncker,"Enhanced Modulation Strategy for a Three-Phase Dual Active Bridg- Boosting Efficiency of an Electric Vechicle Converter," in IEEE Transactions on Power Electronics, vol. 28, no. 12, pp. 5499-5507, Dec 2013.
[6] N. Soltau, R. U. Lenke and R.W. De Doncker,"High-Power DC-DC Converter," E.ON Energy Research Center Series, vol.5, issue.5, RWTH Aachen University,2013.
[7] R. U. Lenke, "A Contribution to the Design of Isolated DC-DC Converters for Utility Applications," PhD thesis, RWTH Aachen University,2012.
(a)
[image:7.595.68.249.122.471.2](b)
[image:7.595.39.288.514.625.2]Fig.10 Hysteresis loops: (a) comparison between sinusoidal and 3DAB excitation at 1.0 T, (b) at between different polarizations
[8] S. P. Engel, M. Stieneker, N. Soltau, S. Rabiee, H. Stagge and R. W. De Doncker, "Comparison of the Modular Multilevel DC Converter and the Dual-Active Bridge Converter for Power Conversion in HVDC and MVDC Grids," in IEEE Transactions on Power Electronics, vol. 30, no. 1, pp. 124-137, Jan. 2015.
[9] N. Soltau, H. Stagge, R. W. De Doncker and O. Apeldoorn, "Development and demonstration of a medium-voltage high-power DC-DC converter for DC-DC distribution systems," 2014 IEEE 5th International Symposium on Power Electronics for Distributed Generation Systems (PEDG), Galway, 2014, pp. 1-8.
[10] G. P. Adam, I. A. Gowaid, S. J. Finney, D. Holliday and B. W. Williams, "Review of dc–dc converters for multi-terminal HVDC transmission networks," IET Power Electronics, vol. 9, no. 2, pp. 281-296, 2 10 2016.
[11] Y. Lee, G. Vakil, R. Feldman, A. J. Watson and P. W. Wheeler, "A high-power DC-DC converter based dual active bridge for MVDC grids on offshore wind farms," 2016 18th European Conference on Power Electronics and Applications (EPE'16 ECCE Europe), Karlsruhe, 2016, pp. 1-10.
[12] Youngsil Lee, G. Vakil, R. Feldman, A. Goodman and P. Wheeler, "Design optimization of a high-power transformer for three-phase dual active bridge DC-DC converter for MVDC grids," 8th IET International Conference on Power Electronics, Machines and Drives (PEMD 2016), Glasgow, 2016, pp. 1-6.
[13] K. Venkatachalam, C. R. Sullivan, T. Abdallah and H. Tacca, "Accurate prediction of ferrite core loss with nonsinusoidal waveforms using only Steinmetz parameters," 2002 IEEE Workshop on Computers in Power Electronics, 2002. Proceedings., 2002, pp. 36-41
[14] F. Krismer,"Modeling and Optimization of Bidirectional Dual Active Bridge DC-DC Converter Topologies," PhD thesis, ETE Zurich, 2010. [15] W. Choi, M. Lee and B. H. Cho, "Effect of transformer design on
operation of fundamental duty modulation for dual-active-bridge converter," 2016 IEEE Applied Power Electronics Conference and Exposition (APEC), Long Beach, CA, 2016, pp. 1416-1423.
[16] M. A. Bahmani, T. Thiringer and M. Kharezy, "Design Methodology and Optimization of a Medium-Frequency Transformer for High-Power DC–DC Applications," IEEE Transactions on Industry Applications, vol. 52, no. 5, pp. 4225-4233, Sept.-Oct. 2016.
[17] G. Ortiz, J. Biela and J. W. Kolar, "Optimized design of medium frequency transformers with high isolation requirements," IECON 2010 - 36th Annual Conference on IEEE Industrial Electronics Society, Glendale, AZ, 2010, pp. 631-638.