Munich Personal RePEc Archive
Computerization and Development:
Formalizing Property Rights and its
Impact on Land and Labor Allocation
beg, Sabrin
Lerner College of Business and Economics, University of Delaware
19 September 2019
Computerization and Development: Formalizing Property
Rights and its Impact on Land and Labor Allocation
Sabrin Beg
1September 2019
Abstract
I test the land and labor market effects of a property rights reform that computer-ized rural land records, and provided access to digitcomputer-ized records and automated transactions to agricultural landowners and cultivators in Pakistan. Using the staggered roll-out of the program, I find that while the reforms do not shift land ownership, landowning households are more likely to rent out land and lower their agricultural participation. At the same time, cultivating households have access to more land, as rented in land and overall farm size per cultivating household increases. Improved tenure security also shifts the type of rental contracts, and the input choices of cultivators. Aggregate district level data suggests an improvement in overall crop yield. These results have implications for both the allocation of land across farmers and the selection of labor into farming.
Keywords: Property Rights, Rural Mobility, Agricultural Land Markets, ICT in Development, Institutions
1
Introduction
Weak property rights and tenure insecurity leads to high transaction costs and
market constraints that hinder the optimal allocation of productive inputs. Land
market frictions in developing countries not only impede efficient trading of
land, but also affects the occupational choices of individuals, in particular the
selection of workers into agriculture (Adamopoulos et al., 2017; Chen, 2017). Agricultural landowners facing restrictions in renting out or selling their land
select into farming when it might be optimal to practice a non-agricultural activity.
Relatedly, barriers to purchasing or tenancy prevent productive famers from
expanding the scale of operation and realizing returns to scale and mechanization.
Foster and Rosenzweig (2011) state that efficient and productive agriculture exists in places where farms are large and mechanized, while in developing
countries farming is predominantly small scale and traditional.2 Understanding
impediments to secure property rights and market activity, and the resulting
constraints for occupational choices and farm expansion and modernization is
crucial as agricultural productivity growth is imperative for development (Gollin et al., 2002).
In this paper, I examine the effect of a land records computerization
pro-gram in Punjab, Pakistan, on land market transactions and labor market
alloca-tion. Leveraging this reform, which formalized land record maintenance and
transactions, and improved access to property rights information, allows me to
build on the comprehensive research documenting improved tenure security and
investment as a result of large scale titling as well as of less intensive property
rights regularization programs. This paper contributes to a gap in the existing
literature by examining the market effects of land rights formalization, and
establishing impacts on both land and labor market outcomes. I find evidence
2Adamopoulos and Restuccia (2014) note a 34-fold difference in average farm size (land per farm)
that light-touch property rights reforms have the potential to relieve markets
constraints through their effect on both the allocation of land across farmers,
and selection of workers into farming. Resolving these frictions also impacts
agricultural contractual choices, and the scale and input usage in farming.
Theoretical literature on property rights suggests that they affect
produc-tion and efficient resource allocaproduc-tion through two broad channels — limiting
expropriation and promoting market transactions, which can facilitate optimal
in-vestment and factor allocation, and relieve credit constraints (Besley and Ghatak,
2009). Additional theoretical support is offered by Chen (2017) demonstrates that untitled land cannot be traded across farmers, creating land misallocation
and distorting individuals’ occupational choice between farming and working
outside agriculture. Empirical work constitutes identification of these channels
by examining either large scale titling programs or programs that formalize
property rights, without offering explicit land titles.
The literature establishes the positive effects of land titling and certification
programs, as well as land rights formalization reforms, by inducing higher
investment through the ‘limiting expropriation’ channel (Field,2007;Do and Iyer,
2008;Galiani and Schargrodsky,2010;Deininger et al.,2011; Ali et al., 2014).3
Hornbeck(2010) proposes and finds evidence that farmers’ ability to effectively protect their farmland using wire fences corresponded to improved property
rights and is associated with greater investment and productivity. Relatedly,
poiltical connections render higher security of tenure in Ghana, incentivizing
investment and improving productivity (Goldstein and Udry, 2008).
Less consistent evidence has been documented for the theoretical argument
that tenure security facilitates market activity. The evidence on large titling
programs’ effect on market transactions is generally inconclusive. Field and Torero (2006), Do and Iyer (2008) and Galiani and Schargrodsky (2010) do
not find that titling significantly improves credit access, while Wang (2012),
Carter and Olinto (1996) and López and Romano (2000) argue that that they do. Market effects of lighter touch formalization reforms are even less
well-known—Deininger and Goyal (2012) find that land registry computerization in India increases credit access, though the effects are modest and only in urban
areas. The existing literature is similarly lacking in comprehensive evidence of
how tenure insecurity affects land rental and sales in particular, as well as the
contract choices of landowners and tenants. Deininger et al.(2010) andLunduka et al.(2010) provide evidence suggesting tenurial insecurity prevents the efficient functioning of the land rental market in Ethiopia and Malawi. Macours et al.
(2010) find that tenurial insecurity constrains the matching of landlords and tenants in Nicaragua. Even fewer papers systematically identify the effect of
property rights and security on labor choices, particularly in rural areas. This
paper fills this gap in the literature by documenting the benefits of a property
rights computerization program in progressing tenure security, and facilitating
land and labor market activity without extensive land titling.
Property rights and land market transactions are non-existent or excessively
informal in the vast majority of developing countries. In Punjab, land records
have been maintained under the same structure since the colonial period—
records of 20 million landowners were held by 8000 local officers orpatwaris, who
manually updated and managed these records.4 The inefficient and dispersed
land records system has led to tenure insecurity, with owners relying on the
discretion of thepatwarisfor any transaction or proof of ownership and tenancy
rights. These barriers to land transactions and security of property result in
high transaction costs and low mobility of land, potentially affecting the scale of
farming and the labor market choices of rural landowners.
In 2009, the Punjab government launched the Land Record Management
4Patwariwas a historically appointed officer during the British colonial government, and has persisted
Information System to formalize and centralize land records in the province.
Through this program, which was phased out in stages across all districts of
the province, land records were obtained from thepatwaris, computerized and
made available to the public at a central location in each sub-district. While
no titles are given out as part of the program, an owner or tenant can go to a
designated center and obtain a government attested copy of his ownership or
tenancy status. All land transactions and changes to ownership or tenancy are
conducted digitally at this designated center. The program thus represents an
overhaul of an informal system that is replaced with a more centralized and
computerized system. Automation of land transactions reduces the influence
ofpatwarisand other local officers who initially acted as ‘middle-men’ in land
transactions. I use the staggered roll-out of the program between 2010 and
2015 to document effects on rental market participation and labor choices of
landowning households. I also text the program’s effects on farming operation,
particularly, tenancy, farm scale, inputs and productivity among cultivating
households.
I find evidence that the program increased rental market transactions as
shown by a higher likelihood of renting out by landowners in districts as they
receive the program. Consistent with higher likelihood of rental activity, I find
that the rate of agricultural participation by landowners goes down, supporting
the idea that market frictions affect selection of workers across sectors. Land
owning households shift into non-agricultural occupations, particularly business
ownership. This increase in renting out is driven by lower income, and potentially
less connected households, who may have faced tenure insecurity and market
constraints more acutely. I do not find any significant effects on land ownership
or land sales and purchases, suggesting these market frictions cannot be resolved
with the simple computerization reform as this one.
households that stay in cultivation increase their scale of farming as shown
by higher average farm size in program districts. There is a shift in the type
of tenancy contracts towards fixed cash rental and away from sharecropping,
supporting previous evidence that sharecropping is more likely to prevail when
tenure insecurity is high (Bellemare,2012). Heterogeneity analysis shows that land availability and farming scale increases predominantly for landless
cul-tivators through greater access to leased land. There is suggestive evidence
that input usage changes as a result of improved tenure security and increased
farm scale. Cultivating households switch crop choice, and are more likely to
utilize pesticides. Suggestive evidence points to increased adoption of farm
machinery, which is consistent with both improved tenure security and increase
farm scale. Household level data does not provide evidence of improvement in
farm output or yield, but district level data on aggregate output by crop show
greater improvements in yield in districts that receive the program sooner. Thus,
the paper is cautious in claiming large affects of the program on agricultural
productivity; however, the changes to land allocation, farming scale and inputs,
and aggregate output provide suggestive evidence for allocative efficiency and
productivity improvement due to the program.
I make a few contributions to the extensive body of empirical literature
on property rights by looking at the computerization of land records in Punjab
province of Pakistan. First, I provide direct evidence of the role of property rights
insecurity in hindering agricultural land rental. Land contracting laws in China
studied byChari et al. (2017), facilitate land rental and result in a reallocation of land across farmers, improving allocative and productive efficiency. The
findings of this paper indicate the that even with privately owned property,
transaction costs in the land market may restrict land rental activity. Formalizing
land records and transactions can enhance tenure security and facilitate rental
The second contribution of my paper is the additional effects that I
doc-ument on labor allocation of landowning households as a rental transaction
costs go down. Several studies have noticed the obstacles to occupational and
geographic mobility in developing contexts, and its impact on agricultural and
overall productivity (Chen et al.,2017;Bryan et al.,2014). In establishing the land and labor market effects of the property rights reform, I also contribute to the
recent, but rapidly growing, literature on broad misallocation in factor markets in
developing countriesHsieh and Klenow(2009);Restuccia and Santaeulalia-Llopis
(2017); Adamopoulos et al.(2017).
Third, I focus on a light touch program in a context with private ownership,
without explicit titling or direct targeting of market transactions. The existing
complexity of land rights in Pakistan, lack of information on part of the citizens
as well as authorities, and discrepancies in distribution of power in a rural
context where land rights and power are connectedBeg(2019), make it infeasible and costly to implement a universal land titling program. The program in Punjab
converts the manual paper-based land records into a computerized database and
marks a significant improvement to the land record management system that is
a key precedent for well-defined property rights. AsRoth and McCarthy(2013) note formalization does not mean formal land titling and registration; rather,
there is a continuum of land rights formalization that extends from strengthening
tenurial rights in law to better communicating those rights to land holders to
resolving conflicts associated with rights clarity to strengthening informal land
leasing arrangements and contracts to formal titling and registration within both
individual and group contexts. The Punjab land record computerization program
is a ‘soft-touch’ intervention, in contrast to the titling programs, and resulted in a
formalization of property rights through better clarity of rights and automation
of market transactions bypassing bureaucratic hurdles and corrupt officers.
where land rights, particularly in rural areas, are haphazardly maintained and
persistently informal. Agricultural participation is still pretty high in South
Asian countries - 50% of total labor force in India, 45% and 48% in Pakistan and
Bangladesh, respectively (compared to 24% for middle income countries) (World Bank,2013). On the other hand agriculture accounts for just 18% of the GDP on average for South Asia.5 Consistent with the high participation in agriculture,
the average proportion of rural population in South Asia is 67% of the total,
lower by 16 percentage points in the 50 years since 1960.6 The rural-urban
transition is relatively slower compared to Latin America for example, where
the share of rural population fell by more than half from 51 to 20% between
1960 and 2013. Indeed, many have noted that despite accelerating economic
growth, the structural transformation in India and South Asia has generally been
slow (Binswanger-Mkhize, 2013). Improving tenancy security and rights of land use, as I explore in this paper, can potentially stimulate labor market allocation,
productivity and structural transformation.
Lastly, I highlight that the role of ICT in governance and public service
delivery holds substantial promise for lower income nations (Banerjee and Jain,
2003; Ghosh and Banerjee, 2006). Banerjee et al. (2014) find that disbursing program funds through an electronic method reduces the number of
adminis-trative tiers involved and consequently lowers leakages of public funds. The
land record computerization program similarly improves access to property
rights records, and automates the land transaction process eliminating the role
of officers and administrative departments whose involvement made the process
prone to corruption and delays. Thus the paper also illustrates the use of ICT to
promote market development and repress instances corruption and bureaucratic
inefficiencies under limited state capacity.
The next section describes the background of land markets in Punjab and
the reform. Section3describes the general empirical specification and data and
section 4 describes the effect of the program for landowning and cultivating
households. Section 5 discusses the validity of findings and offers additional
robustness checks and section6concludes.
2
Background
7
Punjab, the context of the study, has a total area of 205,345 square kilometers
and is the most populated province of Pakistan with 80.5 million inhabitants
(55.6% of Pakistan’s total population), 70% of who live in rural areas. Agriculture
plays an important role in the province’s economy. The Board of Revenue bears
responsibility of the administration of agricultural land. Most land is privately
owned, although there is some communal and state owned land. The history of
the land revenue system in Pakistan dates pre-colonial Sultan Alauddin Khilji
(1255—1316), who was the first ruler to introduce a system of land administration
in the Sub-continent. Mughal emperors laid foundations for a system of land
administration in South Asia that the British colonists improved and formalized.
The British appointed formal revenue officials charged with maintenance of
land records and collection of land taxes. This land record system inherited by
Pakistan at independence underwent minimal changes in over a 60 year period.
Several levels of administration are involved in the land record
mainte-nance: the District, Subdistrict, Kanungo circle, and Patwar circle. At the lowest
administrative level of the records system – the Patwar Circle – arepatwaris. They
are the custodian of land rights records as well as responsible for many social,
political, and administrative tasks including maintenance of weather records,
crop harvest information, village crimes reports, and voter registers. Thepatwari
keeps the particulars of landowners and tenants up to date, supplies copies of
7Background about land record documents is based on United Nations Human Settlements
revenue records to the public and handles the sale and purchase or creation of
lien or charge or loan on any property. In Punjab, about 8,000Patwarismaintain
land records pertaining to 20 million land owners, holding them so informally
as in a cloth bag called a ‘Basta’. Above the patwari are other land revenue
officers with monitoring and bureaucratic roles. The patwari is thus the first
point of contact for any land owner or tenant seeking land record services. Any
land transaction is initiated at the level of the patwari, and affected at upper
administrative levels.
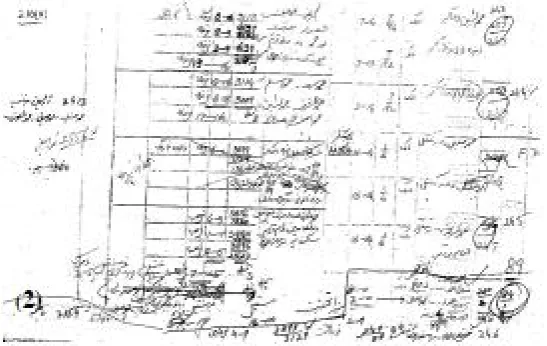
Land records are maintained through various statements, of which I
de-scribe the most commonly used and relevant to this study below. First, the
document that most citizens are primarily concerned with is theRegister
Haq-daran Zaminor Land Right Holders Register, which lists the owners of the lands,
including identifying details of the cultivator or tenant, soil and rent (figure1).
Individual ownership documents orFard Malkiyat/Fardcan be prepared using the
Register Haqdaran Zamin. The register of right holders corresponds to aMussavi
or a cadastral map of a village (see figure2). These maps were initially prepared
by the British and specified each land parcel in a village with a unique parcel
or (Khasra) number and dimensions (Hunter et al. 1908). Any changes to land
rights are recorded in a separate register of mutations,Register Inteqalaat), which
is used to update the register of right holders every four years. All of the above
documents are held and maintained by the patwari. Additionally the patwari
maintains aKhasra Girdawari which records the cultivator and crop information
bykhasraor land parcel.
Tenants’ and landowners’ rights, and updates that arise due to rental or
sale, are thus recorded and updated using a combination of the above documents
at the discretion of the patwari. Recording updates, or acquisition of the Fard
or Khasra Girdawari are the most common services offered to citizens through
a tenant, the Khasra Girdawari is updated for the relevant land parcel and the
Register Haqdaran Zaminis updated to reflect cultivating rights of the tenant. A
survey conducted by Gallup Pakistan for the Board of Revenue found that 42% of
a sample of land owners and cultivators from Punjab report higher dissatisfaction
with the system of land records than with other government departments. 64%
describe the system as lacking transparency and 82% report having to pay a bribe
at some point to obtain land record services. The vague and outdated system
was thus prone to corruption and potentially led to tenure insecurity. 76% of
respondents in the poll reported illegal occupation of land as the main form of
land dispute and 56% identified that the major source of all land disputes was
incorrect land records. These reports indicate that the old system suffered from
problems with tenure security for owners and cultivators, resulting in frictions in
market activity. Owners may be deterred from renting out and cultivators from
renting in due to the risk of illegal occupation and inability to verify and uphold
their rights under the existing system.
Under the existing land legislation, there is no formal state certificate or
title to land; transfers, sales and attestation of land rights (through theFard) are
conducted based on the local officers’ records and arbitration. The local officers’
act as middle-men in land market transactions and their responsibility over
record keeping yields considerable influence to them. In 2010, the Government
of Punjab in India with a similar land administration system made attempts to
abolish colonial posts likepatwarisand kanungos. They noted that officers at the
lower rung in state’s revenue department were often accused of corruption and
making ‘fraudulent changes’ in the revenue records of the area in which they
have jurisdiction (Sural,2013).
With urbanization the land rights continue to be maintained bypatwaris
un-til an agency or urban development authority acquires the land. The urban land
updated urban land records for all of Punjab, and there is limited coordination
in record keeping functions being carried out by the various agencies. The
ambiguity of law regarding records of land rights is particularly harmful to the
poor, who cannot afford protracted land disputes. Numerous legal disputes
result from limited enforcement of land rental contracts, e.g. illegal possession
of land, eviction of tenants, and recovery of rent.8
The overall dispersed and duplicative nature of land records makes land
rights uncertain, negatively impacts economic development, and threatens the
vulnerable and the poor whose rights remain virtually unprotected. Beginning
in years 2005-2009, the Government of the Punjab received financial support
from the World Bank to begin the computerization of land records with the
objectives of improving service delivery and enhancing the perceived level of
tenure security. The main objective of this endeavor was to facilitate increased
access to land records at low costs, specifically for the poorest and less connected
households. The provincial government department noted that:
Inequalities of land distribution, tenure insecurity and difficulties associated with the land administration and registration system are closely interrelated and continue to impose significant constraints on both rural and urban populations, particularly the poor. Land transactions are relatively high cost, and disputes about accuracy of land rights are caused, among others, by the inefficient and dispersed land records system. As a result land markets are thin and land prices are in excess of the discounted value of potential agricultural earnings from land. The low mobility of land contributes to perpet-uating the highly unequal distribution of land and, thus, livelihood opportunities. (World Bank – Project Information Document 2005)
The first objective of the program was to computerize all land records,
including theHaqdaran Zameenand Khasra Girdawari, as currently maintained
by the local levelpatwarofficers—these include all rural land records, as well as
urban records that still fall under the agrarian land record maintenance system.
8Cases of land disputes are either handled by the Revenue Courts or Civil Courts, but cannot be
The second objective was to establish a service center in each subdistrict of the
province to host these records and replaced the lower level land record officers
for maintaining and updating these records and providing citizens with land
mutation,fardissuance and other land record related services. The computerized
records establish both the identity of the owner and tenant, and can be looked
up on the world wide web or obtained from the designated service centers. The
cadastral maps were not digitized initially but their digitization is part of the
agenda under the new record maintenance system.
The right holders (owners or tenants) can visit a service center where the
staff can search and verify their record using their national ID number, providing
the client with a copy of their record within minutes. This service center can
provide owners with a government attested copy of the record, allowing him/her
to use that record in a court of law similar to using a title. Any mutation, due
to to sale, transfer or inheritance, is to be registered at the same service center.
These services were initially provided by thePatwari; following the new system,
a signature from the patwariwould not be required for the registration of any
transaction, as it was previously. One hundred and fifty centers across the
province now provide automated land records services, reducing the average
time required to complete transactions from 2 months to 45 minutes (Gonzalez,
2016). Specifically, because all statements of ownership and cultivation rights are computerized and centrally maintained, the program enhances security of
tenure for owners as well as tenants.
While the service centers increased access to digitized records and centrally
maintained records of ownership and cultivation rights, they may have a
simul-taneous limiting affect through reduced proximity to land records. Initially, a
patwariwas available for eachpatwarcircle, which comprises a few proximate
service centers are fully operational, only one center is available per subdistrict.9
Thus, individuals are expected to pay higher travel costs to access the centralized
records. In the case ofFardtransfer, due to inheritance or sale, these travel costs
still needed to paid prior to the program as transacting parties were required
to visit district revenue offices at several stages to complete their transaction.
Time and distance cost could effectively be lower after the program even with
many fewer service centers thanpatwaris. Changes to cultivation, for instance in
the case of land rental, are still initially reported to thepatwari, who then send
updated records to services centers at the beginning of each agricultural season.
Rental transaction are thus un-affected in terms of their process, but record is
transitioned from being manual and disaggregated to digital and central.
The project thus resulted in two main changes to the pre-existing system:
(1) Centralized record keeping for ownership and tenancy rights, and (2) low
cost and centralized land transactions. By making the computerized land record
centrally available at sub-district level the new system decreased the influence of
the local officers andpatwarisin both land record keeping and land transactions.
It offers considerably better access and verifiability for ownership and cultivation
rights, Thus the program has potential effects on both tenure security and,
consequently, the land market.
3
Empirical Strategy and Data
I exploit the staggered rollout of the program by using a difference in difference
strategy to compare trends in districts that received the program earlier relative to
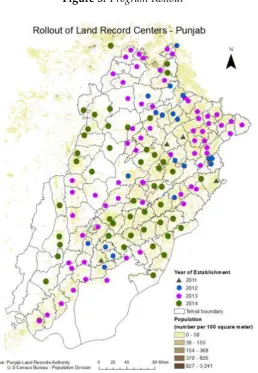
those that received it later. The program roll out began in 2009 when one service
center was set up to facilitate the field work required for obtaining, verifying
and computerizing land records. Figure3shows the rollout of the service center
9Eve though thepatwar’srole is not abolished, 150 service centers took on the tasks provided
after this initial stage. A database was created for each subdistrict with the
computerized village records and the service centers provided rights verification
and land transaction services. The program proposed one service center for each
subdistrict that would be located in the ‘tehsil’ or subdistrict capital. By 2015 all
subdistricts have a functioning service center. Since the household survey data
provides the districts each household belongs to, I use the fraction of subdistricts
in a district dthat have a functioning service center by year tto obtain program
intensity at district level. I run the following specification at the household level:
yidt =β0+β1ProgramIntensitydt+Ψ
idt+Πd+Tt+Πd×T+ǫdt,
where yidt is an outcome for household i in district d and year t. Ψidt are
household level controls,Π
d andTt are district and year fixed effects, respectively.
To control for district specific trends, I include an interaction of district fixed
effects with a linear yearly trend. Standard errors are clustered at the
district-year level. The district fixed effects account for time-unvarying differences
across districts, allowing me to estimate the change in outcomes as the program
intensity increases in any specific district. The major concern in this kind of
an identification strategy would be that districts, particularly those where the
program was implemented with higher intensity, experience differential trends
even in the absence of the program. I thus control for district specific trends to
account for differential trends in outcomes across the districts. Even if outcomes
have a different trend across districts, unless this trend is collinear with the
progress of the program in a specific district, we should be able to estimate
the effect of ProgramIntensitydt. Later I conduct additional tests to validate the
identification strategy.
I focus on the co-efficient on ProgramIntensitydt measured by the number
of service centers in any district as a percentage of the maximum the district can
have. The maximum service centers in a district is the number of subdistricts.
val-ues ofProgramIntensitydt over the sample period. Thus,ProgramIntensitydt =1
indicates that all subdistricts in districtdhave the program; the coefficientβ1then
represents the difference in the trend in district where the program is completed
relative to districts where the program has not begun.
The program progress data is obtained from the Board of Revenue of
Punjab, outlining the operational date for each service center in the province.
The household data is obtained from Household Income and Expenditure surveys
(HIES) surveys conducted bi-yearly across the country. The HIES surveys are
conducted at the provincial level — I use 5 HIES survey rounds from 2005 to
2015. These surveys, conducted in 2005-6, 2007-8, 2011-12, 2013-14 and 2015-16,
collect demographics, employment, expenditure and saving information from
a sample of approximately 18,000 households across the country.10 Aggregate
crop output data is obtained from the Agricultural Statistics of Pakistan, which
records the overall production and area cultivated for each crop at the district
level for each year. Summary statistics from the household data are shown in
Table2.
4
Results
Lack of ownership security restricts landowners from trading their land, i.e.
renting out or selling their land. Only 22 percent of landowning households
report renting out their land, while only about 1 percent report having sold or
purchased a portion of their agricultural land holding in the prior year. Among
cultivating households, 15 percent are landless and less than a third of report
renting in any land for cultivation.
10In addition to the HIES, there are living standard measurement surveys that are representative at
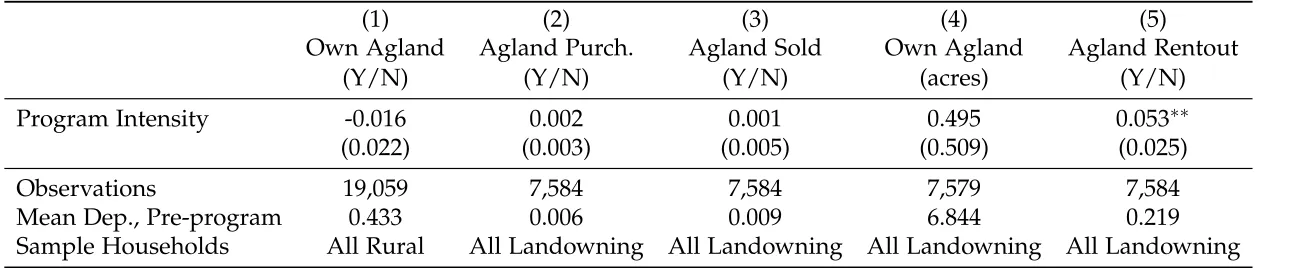
To examine the land market effects of the program, I first test if land
ownership shifts as the program is rolled out. The first outcome in Table3in an
indicator for land ownership among all rural households. There is no change
in ownership, which could be consistent with no market activity or market
transactions that caused land ownership to shift across households without
changing the overall rate of ownership. To investigate this, I consider the change
in the trend of owned holding size and recent land transactions by landowning
households as the program is rolled out. I find that the rate of land purchase
or sale, or average land holding among landowners, does not respond to the
program, suggesting that the program does not relieve the constraints on land
ownership transactions.
Improving tenure security is expected to increase the likelihood of tenancy
transactions, even if land ownership does not change. Column (5) in Table 3
shows that among landowning households the likelihood of renting out increases
by 5% when the program is completed in their district. This is a large effect,
given the 22% rate of renting out on average across the districts prior to the
program. Landowners renting out could be those who previously owned land or
households who are able to purchase more land due to the program and then
rent it out. Since there are no significant effects on agricultural land ownership
rate, ownership transactions, or the average size of land owned, we can deduce
that the change in tenancy is driven by previous landowners. Thus, the program
can resolve some land market frictions that constrain existing landowners from
renting out, but not all market constraints.
Appendix tableA3replicates the same outcomes, restricting the sample to
only farming households, or households that operate a farm. The rationale is that
even though overall land ownership does not shift, specifically farm households
might have gained greater access to land. The table demonstrates that even
ownership, or land purchases. The last column inA3additionally demonstrates
that cultivating households with owned land holdings do not rent out their land,
and the land rental effect in table3is driven by landowning households who do
not use their land for cultivation. This motivates additional tests on agricultural
participation and occupations choices among land owning households, that I
run below.
Relieving constraints on renting out for existing landowners can have
spillover effects on the labor market. Specifically, agricultural participation is
allegedly high due to insecure property rights on agricultural land that prevents
households from participating in off-farm activities for better income, as
va-cating land bears the risk of losing it (Field 2007). Increased rental activity is
by landowning households implies some landowning household members no
longer need to practice cultivation if they have opportunities for participating
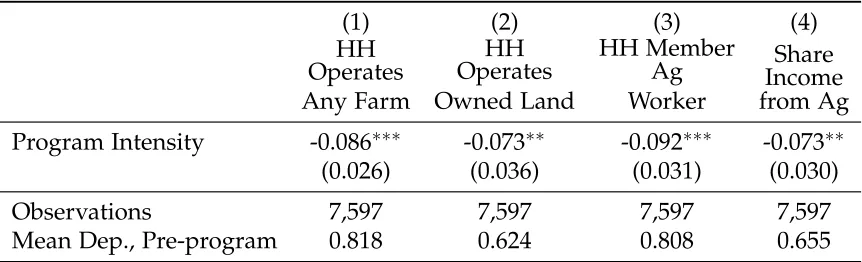
in non-farm activities. The next set of results in Table 4 examine the effect
of the program on participation in non agricultural activities by landowning
households. Consistent with high likelihood of renting out, I find that on average
these households are less likely to participate in agriculture. Three different
outcome variables indicate this. In column (1), the outcome is an indicator for
landowning household where at least one member cultivates a farm. In column
(2), participation in agricultural is defined more specifically as households with
at least one member performing "self-cultivation", or cultivating owned land.
Column (3) shows the program effect on the likelihood of any household member
working broadly in agriculture (including wage work). All three measures for
capturing agricultural participation by landowning households show a
signifi-cant negative change as the program is completed in a district; specifically, the
program lowers the likelihood that a landowning household participates in any
agricultural activity by 9.5 percentage points. Thus landowners are on average
agriculture due to the program.
Column (4) of Table4shows the intensive margin measured by the share of
household income from agricultural activities. Consistent with the changes in
the occupational choices of landowning households, the proportion of income
from agricultural activities falls by 7 percentage points more in districts where
the program is completed relative to district where the program hasn’t started
yet. This corresponds to an 11% drop in income share of landowning households
from agriculture. I also test the changes in the alternate occupational choices of
landowning households as they are able to rent out their agricultural land and
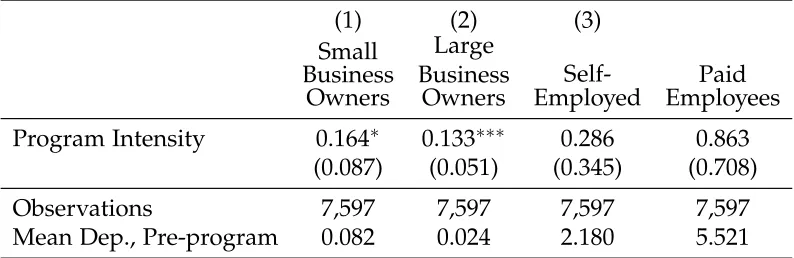
exit agriculture. Table5 shows a significant increase in the share of household
members that participate in non-agricultural activities. These are statistically
significant for participation in small and large business ownership, and large
(but statistically insignificant) for participation in self-employment or as paid
employees.11
In summary the results above demonstrate that weak property rights
con-strain landowners into agriculture, forcing them to cultivate their owned land
as renting out or selling is costly. Improved ownership security through the
computerization of ownership and tenancy rights reduced market frictions,
al-lowing landowners to rent out their land and increase participation in non
agricultural activities by quitting cultivation. I test the heterogenous affects of
the program by income quartile in the appendix TablesA1-A2. Heterogeneous
affects demonstrate that land market frictions are particularly extreme for poorer
and consequently less connected households. The program improves land rental
probability and reduces agricultural participation for households in the lowest
income quartile; the richest household experience significantly lower impact
on both land rental and labor participation, relative to the poorest households.
These effects are consistent with them motivation nehind the design of this
11A natural outcome to test would be the rate of migration. The data does not allow us to test this
computerization program (see Section2).
The next set of regressions estimate the program effects for cultivating
households. First, I test for differential changes in the rate of renting in
agri-cultural land in districts with a high program intensity. Table6shows that the
likelihood of renting in among cultivating households does not change due to the
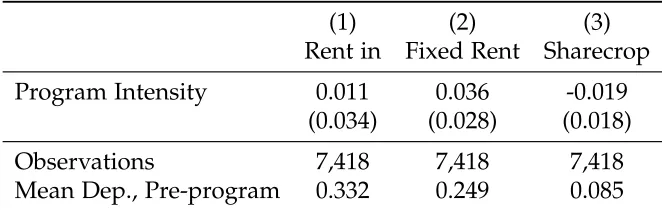
program. There is suggestive evidence that farmers shift toward fixed land rental
and away from sharecropping; this is demonstrated in column (2) and (3) of
Table6as the likelihood of leasing land on fixed rent increase due to the program
(insignificant) while sharecropping goes down (statistically significant). A test of
the equality of the program effect from columns (2) and (3) has a Chi-squared
statistic of 6.01 (p-value 0.01), rejecting the equality of the program’s impact on
the likelihood of fixed rent leasing versus sharecropping. This result is consistent
with the view that land owners with less secure property rights may choose
sharecropping, as it allows landlords to exert stricter property control by bearing
a higher amount of production risk than in fixed rent contracts. Sharecropping
is also typically arranged between landlords and tenants in the same village due
to the sharing nature of this tenancy arrangement and for ease of monitoring;
thus the threat of weak property rights might be less binding for sharecropping.
The results presented thus far demonstrate that renting out by landowners
increases, but renting in by cultivators does not. The lack of effect on the intensive
margin for renting in suggests there might be effects on the intensive margin, i.e.
existing tenant households rent in larger areas of land. The next set of results
test program effects on average farm area (total and rented in) to further explore
these hypotheses.
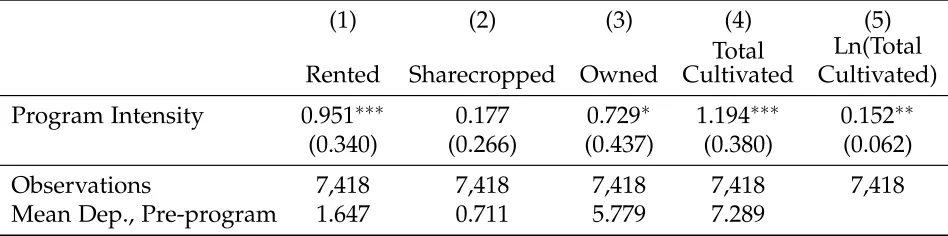
Table7shows the effect of the program on the intensive margin of renting
in, measured by average quantity of rented in land among cultivating households.
There is a strong positive effect on land rented in on fixed cash rent, and no
constraints in the fixed rent lease market for agricultural land. Column (3) shows
that owned cultivated area is marginally higher, but in the absence of any effects
on land acquisition by cultivating households, this effect is suspected to simply
reflect improved security of already owned property. Finally, column (4)-(5)
suggest that as more land is rented in average farm size increases, indicating
meaningful impacts of the program on scale of agriculture in Punjab. Change in
average operational farm size is 15% higher just after the program’s completion in
districts that receive the program earlier relative to districts that receive it later. In
the appendix, I explore heterogeneity across households in these outcomes; Table
A4presents these effects and shows that among cultivating households, landless
households benefit from greater access to land due to improved rental markets.
This heterogeneity in market access confirms the programs’ pre-intentioned goals
of facilitating land transactions the least connected households.
The effect of the program on farming scale has important implications
for agricultural input choices, mechanization and productivity improvement,
as farm size is assumed to be a constraint to adoption of capital intensive
technologies (Foster and Rosenzweig 2011). If optimal farm area induces higher
input, especially capital, usage on farms, output should increase. Even if the
capital margin is unaffected, increased tenancy activity alone may result in a
better allocation of land and higher aggregate productivity. I examine the effects
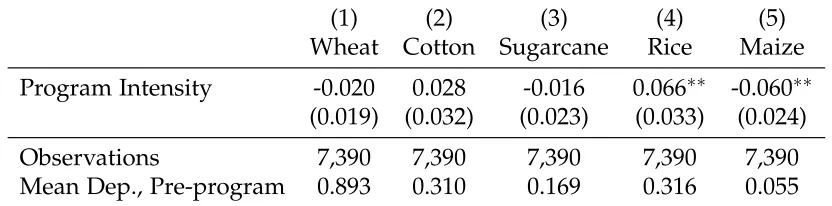
of the program on crop choice, farm inputs and output in Tables8-9. First, these
results demonstrate farmers shift into rice and away from planting maize on
their land, as shows in Table8. The coefficients are nearly identical with opposite
signs, lending more confidence to the inference that farmers make this switch in
crop choices. Such a shift may or may not be expected, and there are not many
consistent explanations that explain this shift.
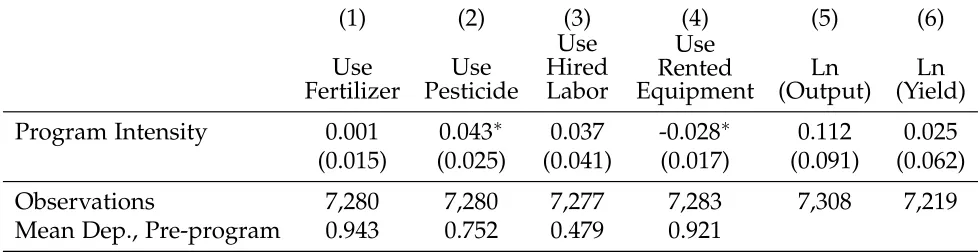
Input choices show an increase in the usage of fertilizer, pesticides and
is significant at the 10% level (Tables 9). The usage of rented equipment goes
down, which could be simultaneous with increased likelihood that farmers’
use owned machinery and equipment. Since data on farmer ownership of
agricultural machinery is not available, I cannot explicitly test this hypothesis.
The farmers do report if they acquired (purchased or received) any agricultural
machinery, including tube wells, tractors, ploughs, thresher, harvester or truck,
in the previous year. I test the affect of the program on acquisition of agricultural
machinery and find that while there is no overall effect, landless households
are particularly more likely to have acquired agricultural equipment when the
program is completed in their districts (Appendix TableA5). Altogether, greater
farm size, higher usage of pesticide, increased owned equipment and reduced
equipment rental are consistent with increased incentives to invest in productive
mechanized inputs.
To infer if enhanced land access for cultivators and changes in crop and
input choices, and the reallocation in the labor market results in output gains, I
test the program’s effects on output using farmer reported survey data on farm
yield, as well as administrative district level data on annual crop production.
Column (5)-(6) in table9show no significant effects on the total output or output
per acre. Despite an improvement in farming scale and crop choices, yield
does not show a significant improvement. The program may be ineffective in
improving productivity, or more time needs to pass for farmers to considerably
adjust investments choices before better yields are realized.
Table 10employs alternate, aggregate district level crop production data
from the administrative sources. The regressions are at district-crop-year level,
where the outcome of interest is log of crop yield (ton/ha) for each district by
year and for the four major crops (rice, cotton, wheat and maize). In addition
district fixed effects and district specific linear trends, the regression includes
program doesn’t affect total cultivated area, aggregate yield increases by 4.6%
more in districts with the program relative to districts that receive the program
later. This effect is significant at the 5% level. This alternate data does provide
evidence of improved productivity, but suffers from caveats that are typical for
government collected administrative data.
5
Robustness and Identification Concerns
As a robustness check, I combine the HIES with the Pakistan Social and Living
Standards Measurement (PSLM) surveys, to allow for more time periods. THE
PSLM is conducted in alternate years (when the HIES is not conducted) and is a
similar survey to the HIES but administered at a larger scale. Thus the PSLM
contains more households, but is shorter and in particular does not contain any
information about cultivation. The outcomes that are measured in both surveys
include land ownership and rental, and household occupation. Thus I can show
the program effect on these outcomes using both surveys as a robustness exercise.
Since the number of households vary across the two surveys, I calculate the
average for each outcome for each district in each year, and run the analysis
at the district year level to ensure that each district-year gets the same weight
in the regression. The output from these regressions is shown in TableA6and
confirms the outcomes from the regressions using only HIES data. I find that
the likelihood of renting out and leaving agriculture goes down for households
in the districts that receive the program sooner than those that receive it later.
There is no change in land ownership, size of agricultural land holding among
land owners and the likelihood of renting in among cultivating households.
Identification would be threatened if the program rollout was driven by
trends land market activity across districts. Figures 4 shows the event study
graphs for some of the outcomes with data available in all years. These figures
ydt =γ0+PγlYearsSinceProgramdt,l+Π
d+Tt+Πd×T+εdt
YearsSinceProgramdt,l is an indicator that equals one if it has been l years
since the start of the program in district d and year t; the omitted category is
l =−1, or the year just before the program starts in any district. These graphs
show that that program start is not driven by changes in land market activity, as
the trend is flat in the pre-program period.
I also explicitly test if changes in the land market drive the rollout of service
centers across the subdistrict. Particularly, are prior trends in rental activity,
operational farm size or sales activity correlated with the main independent
variable in the above regressions, ProgramIntensity. I construct district level
change in these land market outcomes between each survey year. Since the HIES
survey is conducted every alternate year, these changes capture the shift over the
previous 2 year period. I then run the following regression:
ProgramIntensitydt=φ0+φ1△Zd,t+Π
d+Tt+ηdt
ProgramIntensitydt is as defined above; Z includes average district level
share of households renting out, renting in, owning agricultural land, or engaged
in buying or selling agricultural land, and average farm size. △Zd,t = Zd,t −
Zd,t−1 measures the change in Zsince the last survey round (over the preceding
2). The regression output is shown in TableA8. Prior changes in neither of these
variables are correlated with the progress of the program. Table A8mitigates the
concern the program effects identified in the above analysis capture preexisting
changes in land market outcomes. A regression of Program Progress on all these
changes simultaneously has anF-statof 1.06 with ap-valueof 0.388 indicating
that the changes in these land market variables do not significantly explain the
roll out of the program. TableA9further confirms that the pre-existing trend in
yield is unrelated to program rollout.
the program is not correlated with changes in urbanization, literacy, education
or family size. The trends in these outcomes do not respond differentially to the
program, ruling out other demographic changes in program districts that may
have led to land and labor market effects that are observed due to the program.
6
Concluding Remarks
Tenure insecurity and thin land markets are a feature of rural Punjab (Pakistan)
where agrarian law has been informally defined for centuries and local officers
have discretionary powers in land market transactions. This limits mobility in the
land and labor markets suppressing agricultural as well as overall productivity.
Through the Punjab government’s efforts land records have been digitized and
are available on the world wide web as well as physically at designated service
centers. Innovative use of ICT allowed land transactions to be automated and free
from involvement of corrupt officers and administrative hurdles. The paper offers
evidence that despite being very recent, the program has managed to significantly
affect land markets. Rental markets are more active affectingallocation of land
within agriculture andselection of cultivators into agriculture.
Improved allocation of land due to land market activity after the program
suggests that informal land rights and restrictions on market activity may be
responsible for factor misallocation and lower productivity. Landowners who
faced these market constraints rent out land and exit agriculture. On the flip
side households that stay in cultivation, rent in more land, effectively increasing
average farm size, which has implications for modernization and aggregate
agricultural productivity. Consistent with the increased rental activity and
improved land allocation, aggregate yield improves in districts with the program,
although the yield effects are not observed in farm level data. I hypothesize
that these changes in market activity are driven by improved security of tenure
mechanisms.
The formalization of property rights can thus have potentially large positive
effects while obviating the financial and feasibility hurdles of titling programs.
The results also illustrate that land and labor market constraints limit rural
mobility in the South Asian context, shedding light on the rural-urban divide
and the prospect of structural transformation. Lastly, the paper further reinforces
our understanding of development economics by exhibiting how ICT use is
manifested in public service processes and can ease market frictions in lower
References
Adamopoulos, T., L. Brandt, J. Leight, and D. Restuccia (2017). Misallocation, selection and productivity: A quantitative analysis with panel data from china.
National Bureau of Economic Research working paper No. 23039.
Adamopoulos, T. and D. Restuccia (2014). The size distribution of farms and international productivity differences. American Economic Review 104(6), 1667– 97.
Ali, D. A., K. Deininger, and M. Goldstein (2014). Environmental and gender impacts of land tenure regularization in africa: pilot evidence from rwanda.
Journal of Development Economics 110, 262–275.
Banerjee, A., E. Duflo, C. Imbert, S. Mathew, and R. Pande (2014). Can e-governance reduce capture of public programs? experimental evidence from a financial reform of india’s employment guarantee. Technical report, Technical Report, MIT December 2014.
Banerjee, A. and S. Jain (2003). E-governance in india: Models that can be applied in other developing countries. In International Conference on Electronic Government, pp. 488–491. Springer.
Beg, S. (2019). Electoral accountability and clientelism. Working Paper.
Bellemare, M. F. (2012). Insecure land rights and share tenancy: Evidence from madagascar. Land Economics 88(1), 155–180.
Besley, T. (1995). Property rights and investment incentives: Theory and evidence from ghana. journal of Political Economy, 903–937.
Besley, T. J. and M. Ghatak (2009). Property rights and economic development.
Binswanger-Mkhize, H. P. (2013). The stunted structural transformation of the indian economy. Economic and Political weekly 48(26-27), 5–13.
Bryan, G., S. Chowdhury, and A. M. Mobarak (2014). Underinvestment in a profitable technology: The case of seasonal migration in bangladesh. Economet-rica 82(5), 1671–1748.
Carter, M. R. and P. Olinto (1996). Decomposition and identification of the impact of land titling on agricultural productivity in Paraguay.
Chari, A., E. M. Liu, S.-Y. Wang, and Y. Wang (2017). Property rights, land misallocation and agricultural efficiency in china. National Bureau of Economic Research Working Paper No. w24099.
Chen, C. (2017). Untitled land, occupational choice, and agricultural productivity.
Chen, C., D. Restuccia, and R. Santaeulàlia-Llopis (2017). The effects of land markets on resource allocation and agricultural productivity. Technical report, National Bureau of Economic Research.
Deininger, K., D. A. Ali, and T. Alemu (2010). Land rental markets: transaction costs and tenure insecurity in rural ethiopia. InThe Emergence of Land Markets in Africa, pp. 70–86. Routledge.
Deininger, K., D. A. Ali, and T. Alemu (2011). Impacts of land certification on tenure security, investment, and land market participation: evidence from ethiopia. Land Economics 87(2), 312–334.
Deininger, K. and A. Goyal (2012). Going digital: Credit effects of land registry computerization in india. Journal of Development Economics 99(2), 236–243.
Do, Q.-T. and L. Iyer (2008). Land titling and rural transition in vietnam.Economic Development and Cultural Change 56(3), 531–579.
Feder, G. (1988). Land policies and farm productivity in Thailand. Johns Hopkins University Press.
Field, E. (2007). Entitled to work: Urban property rights and labor supply in peru. The Quarterly Journal of Economics 122(4), 1561–1602.
Field, E. and M. Torero (2006). Do property titles increase credit access among the urban poor? evidence from a nationwide titling program. Technical report.
Foster, A. D. and M. R. Rosenzweig (2011). Are indian farms too small? mech-anization, agency costs, and farm efficiency. Unpublished Manuscript, Brown University and Yale University.
Galiani, S. and E. Schargrodsky (2010). Property rights for the poor: Effects of land titling. Journal of Public Economics 94(9-10), 700–729.
Ghosh, A. and G. Banerjee (2006). A study of e-governance in rural india.
Delivering E-government, 222.
Goldstein, M. and C. Udry (2008). The profits of power: Land rights and agricultural investment in ghana. Journal of political Economy 116(6), 981–1022.
Gollin, D., S. Parente, and R. Rogerson (2002). The role of agriculture in develop-ment. American economic review 92(2), 160–164.
Gonzalez, M. L. (2016). Land records go digital in punjab, pakistan. End Poverty in South Asia (http://blogs.worldbank.org/endpovertyinsouthasia).
Hornbeck, R. (2010). Barbed wire: Property rights and agricultural development.
Quarterly Journal of Economics 125(2).
López, R. and C. Romano (2000). Rural poverty in honduras: Asset distribu-tion and liquidity constraints. InRural Poverty in Latin America, pp. 227–243. Springer.
Lunduka, R., S. T. Holden, and R. Øygard (2010). Land rental market participa-tion and tenure security in malawi. InThe Emergence of Land Markets in Africa, pp. 125–143. Routledge.
Macours, K., A. De Janvry, and E. Sadoulet (2010). Insecurity of property rights and social matching in the tenancy market. European Economic Review 54(7), 880–899.
Restuccia, D. and R. Santaeulalia-Llopis (2017). Land misallocation and produc-tivity. National Bureau of Economic Research Working Paper No. 23128.
Roth, M. and N. McCarthy (2013). Land and Tenure, Property Rights and Economic Growth in Rural Areas. USAID Issue Brief.
Sural, A. (2013). Punjab may abolish patwari, kanungo systems. Times of India.
Wang, S.-Y. (2012). Credit constraints, job mobility, and entrepreneurship: evi-dence from a property reform in china. Review of Economics and Statistics 94(2), 532–551.
7
Figures and Tables
[image:31.595.93.527.405.676.2]Figure 1: A Land Record Register as maintained by Patwari (Adeel 2010)
Figure 4: Trend in Renting out (top-left); Renting in (top-right); Land ownership (bottom-left); Household Members in Agriculture (bottom-right) -. 2 0 .2 .4 .6
-5 -4 -3 -2 -1 0 1 2
Years since Program Start
0
.2
.4
.6
.8
-5 -4 -3 -2 -1 0 1 2
Years since Program Start
-. 0 2 -. 0 1 0 .01 .02
-5 -4 -3 -2 -1 0 1 2
Years since Program Start
-. 4 -. 3 -. 2 -. 1 0 .1
-5 -4 -3 -2 -1 0 1 2
Years since Program Start
Table 1:Summary of Program Progress
mean sd
2010
% of Subdistricts with a Center 0.00694 0.0417 % of Villages with Fully Functional Database 0 0
2011
% of Subdistricts with a Center 0.0551 0.187 % of Villages with Fully Functional Database 0 0
2012
% of Subdistricts with a Center 0.164 0.351 % of Villages with Fully Functional Database 0.0622 0.158
2013
% of Subdistricts with a Center 0.59 0.447 % of Villages with Fully Functional Database 0.243 0.235
2014
Table 2: Summary Statistics
District level aggregates: (1) Share of agricultural households renting in 0.207
(0.0940) Operational Farm Area (acres) 6.777
(2.547) Farm area rented in on fixed rent (acres) 1.641
(2.547) Farm area rented in on sharecropping (acres) 0.587
(1.088) Share of households owning agricultural land 0.352
(0.150) Owned agricultural land (acres) 6.269
(2.640) Share of landowning households renting out 0.254
(0.125) Agricultural share of household income 0.605
(0.146) Percentage of household members in agriculture 0.257
(0.0855) Share of households who cultivate a farm 0.780
(0.138)
Table 3:Program Effect on Market Activity for Land Owners
(1) Own Agland
(Y/N)
(2) Agland Purch.
(Y/N)
(3) Agland Sold
(Y/N)
(4) Own Agland
(acres)
(5)
Agland Rentout (Y/N) Program Intensity -0.016 0.002 0.001 0.495 0.053∗∗ (0.022) (0.003) (0.005) (0.509) (0.025) Observations 19,059 7,584 7,584 7,579 7,584 Mean Dep., Pre-program 0.433 0.006 0.009 6.844 0.219 Sample Households All Rural All Landowning All Landowning All Landowning All Landowning
Notes:All regressions include district and year fixed effects with robust standard errors clustered at the district-year level in parentheses. *** p<0.01, ** p<0.05, * p<0.1.
Table 4: Program Effect on Agricultural Participation
(1) (2) (3) (4)
HH Operates Any Farm
HH Operates Owned Land
HH Member Ag Worker
Share Income from Ag Program Intensity -0.086∗∗∗ -0.073∗∗ -0.092∗∗∗ -0.073∗∗
(0.026) (0.036) (0.031) (0.030) Observations 7,597 7,597 7,597 7,597 Mean Dep., Pre-program 0.818 0.624 0.808 0.655
Notes: Cultivator indicates households that operate a farm, Ag HH indicates households where at least one member participates in an agricultural activity. Ag Inc and Ag workers are agricultural share of household income and house-holds working members, respectively. All regressions include district and year fixed effects with robust standard errors clustered at the district-year level in parentheses.
*** p<0.01, ** p<0.05, * p<0.1.
Table 5: Program Effect on Non-Agricultural Participation
(1) (2) (3) Small
Business Owners
Large Business
Owners EmployedSelf- EmployeesPaid Program Intensity 0.164∗ 0.133∗∗∗ 0.286 0.863
(0.087) (0.051) (0.345) (0.708) Observations 7,597 7,597 7,597 7,597 Mean Dep., Pre-program 0.082 0.024 2.180 5.521
Notes:Outcomes indicate if any member of the household participates in the specific activity. All regres-sions include district and year fixed effects with robust standard errors clustered at the district-year level in parentheses.
*** p<0.01, ** p<0.05, * p<0.1.
Table 6: Program Effect on Land Rental for Cultivators
(1) (2) (3) Rent in Fixed Rent Sharecrop Program Intensity 0.011 0.036 -0.019
(0.034) (0.028) (0.018) Observations 7,418 7,418 7,418 Mean Dep., Pre-program 0.332 0.249 0.085
Notes:All regressions include district and year fixed effects with robust standard errors clustered at the district-year level in parentheses.
*** p<0.01, ** p<0.05, * p<0.1.
Table 7:Program Effect on Farm Size and Rented in Land
(1) (2) (3) (4) (5)
Rented Sharecropped Owned CultivatedTotal
Ln(Total Cultivated) Program Intensity 0.951∗∗∗ 0.177 0.729∗ 1.194∗∗∗ 0.152∗∗
(0.340) (0.266) (0.437) (0.380) (0.062) Observations 7,418 7,418 7,418 7,418 7,418 Mean Dep., Pre-program 1.647 0.711 5.779 7.289
Notes:Rent area corresponds to area under fixed cash rent contracts and S/C refers to area under sharecropping contracts. Farm size is total operational farm area including owned land. All regressions include district and year fixed effects with with robust standard errors clustered at the district-year level in parentheses.
*** p<0.01, ** p<0.05, * p<0.1.
Table 8: Program Effect on Crop Choice
(1) (2) (3) (4) (5) Wheat Cotton Sugarcane Rice Maize Program Intensity -0.020 0.028 -0.016 0.066∗∗ -0.060∗∗
(0.019) (0.032) (0.023) (0.033) (0.024) Observations 7,390 7,390 7,390 7,390 7,390 Mean Dep., Pre-program 0.893 0.310 0.169 0.316 0.055
Notes:All regressions include district and year fixed effects with robust standard errors clustered at the district-year level in parentheses.
*** p<0.01, ** p<0.05, * p<0.1.
Table 9: Program Effect on Agricultural Inputs and Production
(1) (2) (3) (4) (5) (6)
Use
Fertilizer PesticideUse
Use Hired Labor
Use Rented
Equipment (Output)Ln (Yield)Ln Program Intensity 0.001 0.043∗ 0.037 -0.028∗ 0.112 0.025
(0.015) (0.025) (0.041) (0.017) (0.091) (0.062) Observations 7,280 7,280 7,277 7,283 7,308 7,219 Mean Dep., Pre-program 0.943 0.752 0.479 0.921
Notes:All regressions include district and year fixed effects with robust standard errors clustered at the district-year level in paren-theses.
*** p<0.01, ** p<0.05, * p<0.1.
Table 10: Program Effect on Agricultural Production using District level data
(1) (2) Log Area Log Yield Program Progress -0.044 0.046∗∗
(0.033) (0.023) Observations 1,119 1,118
Notes: Regressions are at district-crop-year level, and the out-comes are logged total area and yield for each crop in each dis-trict and year. All regressions include disdis-trict, crop and year fixed effects with robust standard errors clustered at the district-year level.
*** p<0.01, ** p<0.05, * p<0.1.
8
Appendix Tables and Figues
Table A1:Program Effect on Market Activity by Income Quartile
(1) Own Agland
(Y/N)
(2) Agland Purch.
(Y/N)
(3) Agland Sold
(Y/N)
(4) Own Agland
(acres)
(5)
Agland Rentout (Y/N) Program Intensity -0.001 0.002 -0.002 1.130 0.105∗∗ (0.002) (0.004) (0.009) (0.720) (0.042) Program Intensity x Inc Quartile 2 0.001 0.001 0.014 -0.359 -0.012
(0.002) (0.002) (0.011) (0.619) (0.041) Program Intensity x Inc Quartile 3 0.005∗ -0.000 0.005 -0.332 -0.036
(0.003) (0.003) (0.009) (0.641) (0.042) Program Intensity x Inc Quartile 4 0.001 0.001 -0.002 -1.179 -0.076∗ (0.002) (0.004) (0.010) (0.738) (0.042)
Observations 7,597 7,584 7,584 7,579 7,584
Mean Dep., Pre-program 0.997 0.007 0.009 6.699 0.219 Sample Households All Rural All Landowning All Landowning All Landowning All Landowning
Notes:All regressions include district and year fixed effects with robust standard errors clustered at the district-year level in parentheses. *** p<0.01, ** p<0.05, * p<0.1.
Table A2:Program Effect on Agricultural Participation by Income Quartile
(1) (2) (3) (4)
HH Operates Any Farm
HH Operates Owned Land
HH Member Ag Worker
Share Income from Ag Program Intensity -0.144∗∗∗ -0.083∗ -0.182∗∗∗ -0.121∗∗∗ (0.040) (0.046) (0.041) (0.040) Program Intensity x Inc Quartile 2 0.016 -0.051 0.052 0.024
(0.038) (0.044) (0.038) (0.040) Program Intensity x Inc Quartile 3 0.042 -0.002 0.126∗∗∗ 0.075∗
(0.036) (0.044) (0.037) (0.039) Program Intensity x Inc Quartile 4 0.082∗∗ 0.036 0.101∗∗∗ 0.045
(0.040) (0.038) (0.035) (0.037) Observations 7,597 7,597 7,597 7,597 Mean Dep., Pre-program 0.818 0.624 0.808 0.655
Notes:All regressions include district and year fixed effects with robust standard errors clustered at the district-year level in parentheses. *** p<0.01, ** p<0.05, * p<0.1.
Table A3: Program Effect on Market Activity for Cultivators
(1) Own Agland
(Y/N)
(2) Agland Purch.
(Y/N)
(3) Agland Sold
(Y/N)
(4) Own Agland
(acres)
(5)
Agland Rentout (Y/N) Program Intensity -0.013 0.002 0.000 0.546 -0.012 (0.027) (0.004) (0.006) (0.558) (0.017)
Observations 7,418 6,226 6,226 6,224 6,226
Mean Dep., Pre-program 0.844 0.007 0.007 7.203 0.084
Sample Households All Cult. Landowning Cult. Landowning Cult. Landowning Cult. Landowning Cult.
Notes:All regressions include district and year fixed effects with robust standard errors clustered at the district-year level in parentheses. *** p<0.01, ** p<0.05, * p<0.1.