J. Range Manage.
56: 291-297 May 2003
Biological and chemical response of a grassland soil to burning
LILIANA I. PICONE, GABRIELA QUAGLIA, FERNANDO 0. GARCIA, AND PEDRO LATERRA
Authors are Assistant Professor; Graduate Student, Facultad de Ciencias Agrarias (UNMdP)-Estacion Experimental Agropecuaria Balcarce (INTA), C. C.
276, (7620) Balcarce, Argentina; director Latin American-Southern Cone, INPOFOS. CONO SUR. (1641) Acassuso, Buenos Aires, Argentina.; and Associate Professor, Facultad de Ciencias Agrarias (UNMdP)-Estacion Experimental Agropecuaria Balcarce (INTA), C.C. 276, (7620) Balcarce, Argentina.
Corresponding author (E-mail):[email protected]
Abstract
Changes in soil nutrient pools and microbial activity due to fire are important for understanding the availability of nutrients to plants. The objective of this study was to evaluate the effect of fire: 1) on size and seasonal dynamics of labile pools of C and N in a short-term after burning; and II) on chemical properties and microbial diversity immediately after fire, in a grassland with Paspalum quadrifarium Lam. Microbial biomass C and N tended to be higher in the burned (433 mg C kg'1 and 37 mg N kg 1) than in the unburned treatment (386 mg C kg'1 and 26 mg N kg"1).
Both microbial biomass, decreased at the beginning of the grow- ing season and then recovered at the end of the season. Levels of mineralizable C and N were similar in both treatments; however they showed different patterns of seasonal transformations. At initiation of plant growth, concentration of mineralizable C decreased while amount of mineralizable N increased; but the opposite occurred at the end of the growing season. Increases in microbial biomass coincided with low levels of mineralizable N and high concentrations of mineralizable C, suggesting a higher immobilization at the end of the season. Immediately after burn- ing, organic C and N decreased by 11 and 7%, respectively.
Mineral N was almost double, available P increased by 10 mg kg 1;
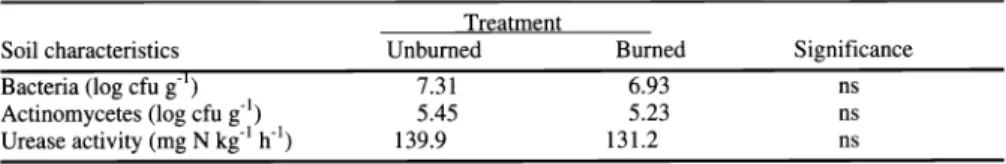
but exchangeable bases, bacterial and actinomycetes population, and urease activity were not affected by burning. Fire can induce immediate changes to the soil; however, long-term studies will be required to evaluate the duration of the effect of fire on soil biolog- ical processes and nutrient transformations.
Key Words: Paspalum quadrifarium, fire, microbial biomass, soil nutrients, flooding pampa
Flooding Pampa is a region characterized by poorly drained soils that occupies approximately 58,000 km2 in the central-east- ern area of Buenos Aires province (35° 30' N, 37° 40'S, 56° 50'E, 60° 30'W) in Argentina. Most of this area is under natural grass- lands, which have undergone significant changes in physiognomy and species composition. However, extended stands of pristine plant communities dominated by Paspalum quadrifarium Lam.
still exist.
Paspalum quadrifarium Lam. is a warm-season and perennial grass with tall canopy that excludes other species, and forms
Research was funded by Facultad de Ciencias Agrarias-Universidad Nacional de Mar del Plata (UNMdP) Grant AGR 20-93.
Manuscript accepted 16 Jul. 02.
Resumen
Estudiar los cambios en los nutrientes del suelo y la actividad microbiana producidos por el fuego es importante para poder entender la disponibilidad de nutrientes para las plantas. El objetivo de este estudio fue evaluar el efecto del fuego I) sobre el tamano y la dinamica de los pooles labiles de C y N, a corto plazo despues de la quema; y II) sobre las propiedades quimicas y la diversidad biologica, inmediatamente luego de efectuada la quema, en una pastura natural con predominio de Paspalum quadrifarium Lam. El C y N de la biomasa microbiana tendieron a ser mayores en el tratamiento de quema (433 mg C kg 1 y 37
mg N kg 1) que en el tratamiento de no quema (386 mg C kg' y
26 mg N kg'1). Ambos decrecieron al comienzo de la estacion de crecimiento de la pastura y se recuperaron al final de la misma.
Los niveles de C y N mineralizable fueron similares en ambos tratamientos; sin embargo ellos mostraron patrones diferentes de variacion estacional. Al inicio del crecimiento vegetal, la con- centracion de C mineralizable decrecio mientras que el con- tenido de N mineralizable incremento; to opuesto ocurrio al final de la estacion de crecimiento. Los incrementos en biomasa microbiana coincidieron con los bajos niveles de N mineralizable y la alta concentracion de C mineralizable sugiriendo una mayor inmovilizacion al comienzo de la estacion de crecimiento.
Inmediatamente luego del fuego, el C y N organico decrecio en un 11 y 7%, respectivamente. La concentracion de N mineral fue casi el doble, el P disponible incremento en 10 mg kg-1; sin embargo las bases intercambiables, y la poblacion de bacteria y actinomicetes como la actividad ureasa no fueron afectadas por el fuego. La quema puede inducir cambios inmediatos en el suelo, no obstante estudios a largo plazo son necesarios para evaluar la duracion del efecto del fuego sobre los procesos biologicos y las transformaciones de nutrientes.
dense stands locally known as `pajonales'. A small amount of the dead foliage falls on the soil surface, and it decomposes at slow rates because of its low nutritive value. About 70-80% of the aboveground dead plant material remains as standing dead bio- mass, exceeding 20 Mg dry matter ha 1 (Cahuepe and Laterra 1998). Winter-spring burning is a common management practice, which increases the productivity of these grasslands (Sakalauskas et al. 2001), cattle stocking rates (Cahuepe 1990) and nutritive quality of forage (Sacido et al. 1995).
Fire changes soil properties as a result of direct exposure to high temperatures and ash deposition. Furthermore, there are indirect and after-fire longer term effects caused by changes in
JOURNAL OF RANGE MANAGEMENT 56(3) May 2003 291
microclimate and plant species composi- tion (Raison et al. 1990). These changes depend on, among other factors, duration of fire, maximum burn temperature, soil texture, and water content (Wright and Bailey 1982). Several studies on the effect of fire on soils have shown changes in soil nutrient levels resulting mainly in total N losses, but short-term increases in avail- able N and other nutrients (Biederbeck et al. 1980, Kutiel and Naveh 1987, Fenn et al. 1993, Saa et al. 1998). Soil chemical properties such as exchangeable Ca++, Mg++ and K+, and pH also increase after fire (Tomkins et al. 1991). Microbial bio- mass is considered an agent of transforma- tion of soil organic materials, and a labile reservoir of nutrients such as N, P, and S (Jenkinson and Ladd 1981). Ojima (1987) found that microbial biomass C and N were reduced by long-term annual burning (> 40 yr), but they were not affected by short-term burning (1-2 yr).
Most research on the effects of fire on grasslands has focused on shifts in plant species composition and plant community productivity (Ricci et al. 1996, Laterra
1997, Laterra et al. 1998) providing scarce information about the impact of fire on soil properties, nutrient availability, and micro- bial activity. The objective of this study was to evaluate the effect of fire 1) on the size and seasonal dynamics of soil micro- bial biomass C and N in a short-term after burning; and II) on some soil chemical properties and microbial diversity, imme- diately after a single fire. This study along with others which are being carried out would contribute to obtain a better under- standing of soil nutrient transformations and microbial activity in a burned system.
Materials and Methods Experimental site
The study was conducted on several plots in a natural grassland located at San Ignacio (37° 10375, 58°25'50"W), about 20 km south of Ayacucho district, in the
southeast of Buenos Aires province
(Argentina). The soil belongs to subgroup Typic Natraquoll, which is generally water-logged during late winter and early spring. The local climate is characterized by a mean annual temperature and median annual precipitation of 15°C and 1,029 mm respectively, with summer droughts and spring floods. The area is a natural grassland composed of 2 types of vegeta- tion, which can be clearly distinguished by their composition and structure. The vege- tation that covers most of the area and
extends over lower topographical posi- tions is composed of short grasses such as Leersia hexandra Sw., Hordeum pusil- lum Nutt., and Distichlis spicata (L.) Green. Paspalum quadrifarium Lam. rep- resents patches within the landscape, which are located on slight slopes. The experimental site was selected to take into account the equal physiognomy of patches and the predominance of Paspalum quadrifarium Lam. in the grassland.
Experiment I
Experiment I was carried out in an area, which had been burned in August 1990. In December 1990, when there was approxi- mately 30 cm of post-fire regrowth, the eastern area (block I) was grazed for 5 months until May 1991, while the western area (block II) was left ungrazed. From May 1991 to August 1992 both blocks remained ungrazed, and at this time we delimited 4 plots within each block.
Treatments, burned and unburned, were randomly assigned to experimental units within a block, with each treatment
appearing twice in every block.
Plots were burned on 26 August 1992, in winter. Burning was done up wind to allow a slow and complete fuel combus- tion, and also a better control of fire. Prior to burning, canopy of Paspalum quadri- farium Lam. had a mean height of 95 cm, and the aerial biomass was 1,555 and 1,808 g m 2 in block I and II, respectively.
During burning, the mean wind speed was 1.8 m sec 1 and the maximum temperature at the ground level exceeded 390° C.
Maximum fire temperature was estimated using 8 sets of glass capillary tubes filled with substances, which melted at a differ- ent temperature (39-350°C).
Soil samples were taken from the upper 12 cm layer of each treatment at different dates: 1, 58, 215, and 360 days after burn- ing. Each soil sample was a composite of 25-30 cores (2.5 cm diam.) collected ran- domly from each experimental unit,
among plants.
Experiment II
Three homogeneous plots were selected from a site located close to experiment I.
These plots were not previously burned.
Two treatments, burned and unburned, were set-up in a randomized complete block design with 3 replications. Burning was done on 18 November 1994, in spring. Prior burning, aerial biomass was 1,847 g m 2, with 86% of dead standing biomass. During burning, the mean wind speed was 5 m sec l and the maximum burn temperature at ground level ranged
from 152 to 677°C. Temperature was measured using heat sensitive crayons (Tempilsticks (R), Big Three Industries, Inc. Hamilton Blvd., South Plainfield, N.J.
07080, USA) placed at soil level, among plants.
Soil samples were taken from the 0- to 5
cm depth, 1 day after burning in both treatments. Each soil sample was a com- posite of 25-30 cores (2.5 cm diam.) col- lected at random from the experimental unit, without removing either the existing litter prior to burning or the ashes after burning.
Biological and chemical analyses For chemical analyses (organic C, organic and inorganic N, pH, available P, cation exchange capacity (CEC), and exchangeable Ca, Mg, K+, and Na+)
soil samples were air-dried and sieved through 2 or 0.5 mm screens depending on the analytical technique. For microbial and biochemical analyses (microbial biomass C and N, number of bacteria and actino- mycetes, and urease activity) moist soil samples were passed through a 4 mm mesh to remove plant material.
Soil organic C content was analyzed with the technique of Walkley and Black (1934), soil organic N by Kjeldahl diges- tion (Bremner and Mulvaney 1982), and available P according to method of Bray and Kurtz (1945). Inorganic N (NH4+-N and N03--N) was determined on 0.5 M K2S04 soil extracts using steam distilla- tion (Bremner and Keeney 1966). Soil pH was measured with a glass-calomel elec- trode using a soil:water ratio of 1:2.5 (weight:volume). Quantification of CEC and exchangeable cations used the proce- dure of Chapman (1965): Ca++ and Mg++
were measured with an atomic absorption spectrophotometer; K+ and Na+ were measured with a flame photometer.
Soil microbial biomass C and N were determined by the chloroform fumigation-
incubation method (Jenkinson and Powlson 1976). Soil (50 g) was added in each of two, 125-m1 Erlenmeyer flasks.
Water was added to bring soils to field capacity, and samples were preincubated for 5 days at 25°C to stabilize microbial activity. At the end of the preincubation period, 1 of the samples was fumigated with chloroform and the another was left unfumigated. After 24 hours, chloroform was evacuated from the soil samples, and fumigated and unfumigated samples were placed into 1,250-ml glass jars containing a beaker with 15 ml of 0.4 N NaOH. Jars were closed tightly and incubated for 10 days at 25°C. Concentration of C02-C
292 JOURNAL OF RANGE MANAGEMENT 56(3) May 2003
absorbed by the alkali was determined by titration of excess 0.4 N NaOH with 0.1 N H2S04, in presence of BaCl2 (Anderson 1982). Subsequently, mineral N (NH4+-N and N03--N) in the samples was extracted with 0.5 M K2S04 and extracts were ana- lyzed by steam distillation (Bremner and Keeney 1966).
We express microbial biomass C and N as the difference in C02-C evolved and N mineralized between fumigated and unfu- migated samples, to avoid the confusion of using different conversion factors (Kc and KN). When comparing with other data, the microbial biomass C and N were calculat- ed according to the equation suggested by Voroney and Paul (1984):
Microbial biomass C (mg C kg') _
Cf - Cufkc (1)
where:
Cf = C02-C evolved from fumigated sample
Cu = C02-C evolved from unfumigated sample
K = 0.4 1 (fraction of microbial biomass converted to C02)
Microbial biomass N (mg N kg') _
Nf - Nu/KN (2)
where:
Nf = NH4+-N and N03--N mineralized from fumigated sample
Nu = NH4+-N and N03--N mineralized from unfumigated sample
KN = (- 0.014 x (Cf/Nf))+ 0.39
Cf = C02-C evolved from fumigated sample Indices of mineralizable C and N were obtained from unfumigated samples for microbial biomass. They were calculated as the difference of C02-C or inorganic N concentration before and after incubation, and were expressed as mg C02-C or mg inorganic N per kg of soil.
Microbial populations were quantified using a dilution pour- plate technique.
Bacteria were determined on nutrient agar supplemented with 5 g liter' of glucose (Zuberer 1994), and actinomycetes on casein-starch medium (Kuster and Williams 1964). Petri plates were incubat- ed at 25° C for 5 days for bacteria count, and 10 days for actinomycetes count.
Total number of bacteria and actino- mycetes were expressed as log value of colony forming unit per g of soil (cfu g').
Urease activity was measured according to no-buffer method of Douglas and Bremner (1970) and reported as mg N per kg of soil per hour.
Results are expressed on the basis of dry soil weight. Soil water content was deter- mined gravimetrically by oven drying at
105° C for 48 hours.
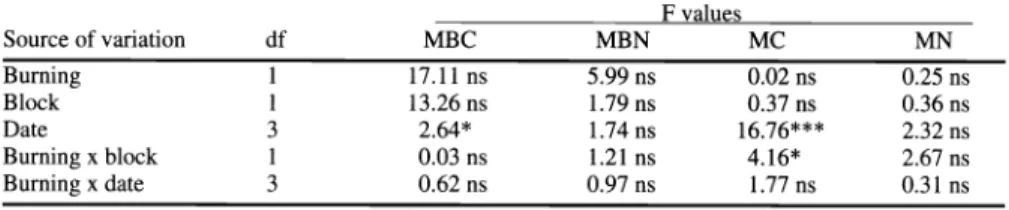
Table 1. Summary of analysis of variance for microbial biomass carbon (MBC) and nitrogen (MBN), and mineralizable carbon (MC) and nitrogen (MN) at 0-12 cm depth in a grassland soil.
F values
Source of variation df MBC
Burning 1 17.11 ns ns ns ns
Block 1 13.26 ns ns ns ns
Date 3 2.64* ns ns
Burning x block 1 0.03 ns ns ns
Burning x date 3 0.62 ns ns ns ns
*,*** significant at P < 0.10, and P < 0.0001, respectively.
ns = not significant.
Statistical analyses
Data were analyzed using the GLM pro- cedure of SAS (SAS Institute Inc. 1996).
In experiment I, content of microbial bio- mass C and N, and mineralizable C and N on different dates were subjected to an analysis of variance as a split-plot arrange- ment in a randomized complete block design, with 2 replications. The main plot was the treatment (unburned and burned), and subplot was the sampling date. In experiment II, variables were analyzed according to a randomized complete block design, with 3 replications. Means separa- tion, where necessary, was made by using the least significance difference test (LSD) with 5 or 10% probability.
Results and Discussion Experiment I
Fire and grazing can influence N cycling in grassland ecosystems by affecting the spatial distribution of accumulated plant biomass, and N additions and losses (Hobbs et al. 1991). In this study, there was no effect due to previous grazing on the size of microbial biomass C and N (Table 1). The reason is probably because the area was grazed for a relatively short time at a low stocking rate, and both blocks remained closed for 15 months before estimations of microbial biomass.
Averaged across all treatments and sam- pling dates, microbial biomass C was 421 mg CO2 - C kg', which is equivalent to 1,027 mg CO2 - C kg' according to equa- tion (1). This value is higher than those observed for other grasslands (Fenn et al.
1993, Garcia and Rice 1994). Although microbial C is a small fraction of the total soil organic C, about 1% of 67.8 g C kg',
it has a rapid rate of turnover (Jenkinson and Ladd 1981), and represents a substan- tial pool of soil nutrients. Microbial bio- mass C was not affected by burning (Table 1), but tended to be higher in the burned (433 mg CO2 - C kg') than in the unburned treatment (386 mg CO2 - C kg')
(Fig. la) as has been observed in annually-
burned tallgrass prairie (Garcia and Rice 1994). Soil microbial biomass C in the top 12 cm of soil ranged from 277 to 581 mg CO2 - C kg' in the burned treatment and from 170 to 569 mg CO2 - C kg' in the unburned treatment. This response was a result of the higher temperatures reached by the soil during burning (Garcia 1992), which increased plant residue decomposi- tion rates and the mineralization rates of organic matter (Risser and Parton 1982).
Microbial biomass C varied marginally due to sampling date (Table 1), but sea- sonal dynamics was not significantly affected by burning. The general pattern for microbial biomass C was to have a decrease at the beginning of plant growth (in early spring, October), a recovery by the end of the growing season (in late summer, March), and was low in winter (August) (Fig. 2a). It was likely that the significant drop in microbial biomass C in October was due to the reduced availabili- ty of organic compounds to soil microor- ganisms. At the March sampling, micro- bial biomass C was significantly higher than it was observed the previous month.
As the growing season progressed, the
0 Unburned
11
Bum da
Fig. 1. Content of soil microbial biomass carbon (a) and nitrogen (b) at 0-12 cm depth in unburned and burned grassland soil. Vertical bars represent standard deviations (n =16).
JOURNAL OF RANGE MANAGEMENT 56(3) May 2003 293
Fig. 2. Seasonal dynamics of soil microbial biomass carbon (a) and nitrogen (b) in a grassland soil at 0-12 cm depth. Vertical bars indicate standard deviations (n = 8).
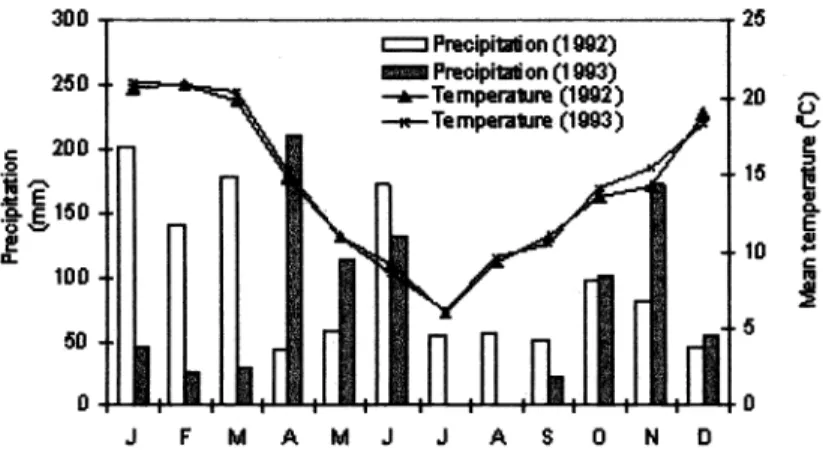
warmer temperatures along with the occurrence of precipitation (378 mm from September to March) (Fig. 3) increased root activity and root exudates, which result in increased microbial biomass C at the end of summer or beginning of fall.
Roots are an important source of easily decomposable C for microbial activity in the perennial grassland, where the majori- ty of plant C is located belowground (Coleman 1976, Coleman et al. 1983).
Lynch and Panting (1980) found that soil microbial biomass increased with root growth and rooting density. Moisture and temperature may also affect the microbial biomass by affecting plant growth and the amount of available substrate for microor-
300
J
ganisms (Garcia and Rice 1994). Microbial biomass C was low in soil samples collect- ed in August of the second growing sea- son, when temperature and soil moisture were unfavorable to microbial growth.
During winter, temperatures were colder and there were 60 days of drought imme- diately before sampling (Fig. 3).
Soil microbial biomass N was 31 mg N
kg' for the 0- to 12- cm depth averaged across all treatments and sampling dates.
This value is equivalent to 110 mg N kg'
according to equation (2), which is similar or higher than those reported for other grasslands (Fenn et al. 1993, Garcia and Rice 1994). The average C:N ratio of microbial biomass (9:1) was typical of microbial biomass C:N ratios (Paul and Voroney 1980). Soil microbial biomass N was not significantly affected either by burning or sampling date (Table 1).
However, it tended to be higher in the burned (37 mg N kg') than in the unburned treatment (26 mg N kg')(Fig.
lb), and showed a pattern of seasonal vari- ation similar to that of microbial biomass C (Fig. 2b). The decline in biomass N between August and October, assumed to be a result of mineralization, amount to 13 kg N ha' in the top 12 cm of soil, there- fore a substantial quantity of N will be available at the beginning of the active plant growth. Clark (1977) indicated that belowground N translocation may account for 33% of the aboveground N require- ments in shortgrass prairie, with the remainder provided by mineralization of soil organic N.
Mineralizable N has been suggested as an index of the soil capacity to supply mineralized N, while mineralizable C is an index of microbial activity. These pools include the biomass pool and other non- biomass active fractions of the soil organic matter. It is important to note that these
O Preoipit i an (1002)
Precipition (1003)
-e-Temperature (102) 20
-* -Temperature (1003)
25
410
F M A M J J A 3 D ND
Fig. 3. Weather conditions during the studied period.
measurements obtained using the short- term incubation may not reflect the entire mineralizable organic pools (Cabrera and Kisse11988).
The size of these pools was not affected by burning, and only mineralizable C sig-
nificantly varied with sampling dates (Table 1). Mineralizable C and N, aver- aged burned and unburned treatment, was 217 mg CO2 - C kg' and 27 mg N kg' for the 0- to 12- cm depth, respectively (Fig.
4a and 4b). In the early spring (October), 400,
e ; 300
200
p 100
0 Unburned
11
Burned0
Fig. 4. Mineralizable carbon (a) and nitro- gen (b) at 0-12 cm depth in unburned and burned grassland soil. Vertical bars rep- resent standard deviations (n =16).
the grassland soil tended to have a lower production of mineralizable C but higher inorganic N content suggesting a lower immobilization of N into microbial bio- mass (Fig. 5a and 5b). In fact, microbial biomass showed an important drop at that time. At the end of the growing season (March) occurred the opposite, the grass- land soil had higher microbial activity with lower inorganic N content indicating a higher immobilization, which resulted in more microbial growth and then in micro- bial biomass (Fig 5a and 5b). Also, at this time the plant uptake of nutrients decreased and N mineralized is either immobilized by microorganisms or accu- mulated as inorganic N. Ratio of CO2 evolved : N mineralized has been suggest- ed as an index of N immobilization (Schimel 1986). If this ratio is high it means that soil has the ability to immobi- lize N, but if the ratio is low, the N miner- alization may be high. The calculated ratio
294 JOURNAL OF RANGE MANAGEMENT 56(3) May 2003
a biomass was seasonally dependent, affect-
b
A Oct tU r Aig
Fig. 5. Temporal dynamics of mineralizable carbon (a) and nitrogen (b) in a grassland soil at 0-12 cm depth. Vertical bars repre- sent standard deviations (n = 8).
(data not shown) corroborated the previ- ous observations, and it showed between 3-4 times more microbial activity per unit of mineralizable N at the initiation of plant growth and 14 more microbial activity per unit of mineralizable N at the end of the growing season, suggesting higher immo- bilization at the latter date. The amount and quality of organic substrates available to microorganisms are important controls over the microbial immobilization-miner- alization process (Schimel 1986), and may partially explain the changes observed in immobilization-mineralization balance.
When the substrate available to microor- ganisms was the plant tissue with low C:N ratio as a grassland regrowth, which was enhanced by moist conditions in early spring, N immobilization was likely reduced. However, as the easily degrad- able C compounds disappeared throughout the growing season, microbial growth and N immobilization were likely increased.
At the sampling of August in the second growing season, microbial activity and biomass were affected not only by the quality of substrate because most of the plant material was senescent, but also by environmental conditions, there was a pre- vious drought, which decreased the pools of N and C.
In conclusion, in the short term, bum- ing had no significant effect on the size of microbial biomass C and N or mineraliz- able C and N in the surface soil of grass- land, but microbial biomass tended to be higher in the burned soil. Soil microbial
ing the process of mineralization and immobilization of N. Seasonal changes in microbial biomass, which were not modi- fied by burning, could be related to fluctu- ations in organic inputs during the grow- ing season, and soil moisture and tempera- ture. The increase in mineralizable N at the beginning of the growing season matched with less mineralizable C02-C and microbial biomass; whereas the decrease in mineralizable N coincided with high mineralizable C02-C and microbial biomass at the end of the grow- ing season.
Experiment II
After field burning it is not possible to separate the effects of heat and ash on sev- eral processes in the soil, thus in this experiment we evaluate the potential
effect of heat and ash deposition on micro- bial diversity and some chemical proper- ties, immediately after a single burning.
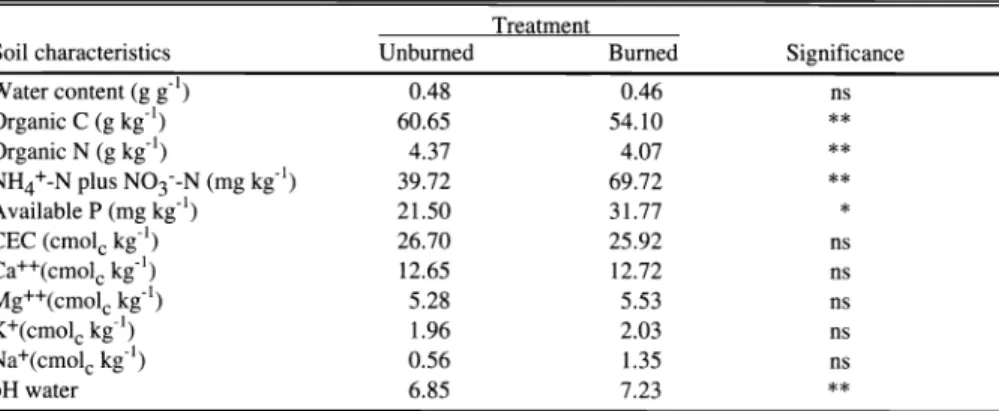
The immediate effect of fire was to decrease the soil organic C content in the 0- to 5 cm depth. Organic carbon from plant debris, roots, microbial biomass, and organic matter combusted due to the high temperature reached by the soil under fire.
The decrease was 11 % (Table 2), however it is likely that C losses only by heating were even higher in the surface layer because ashes can supply organic matter contributing to mask the differences in organic C content between burned and unburned treatments. As in the case of soil organic C, organic N content significantly decreased in the burned soil (Table 2). The
the level of total N, when soil and layers of organic residues remain wet less than 25% of total soil N is lost (DeBano et al.
1979). In this study, high soil water con- tent (Table 2) could account for the low percentage of N losses. The C:N ratio in the surface of the burned soil (14:1) was similar to that in the unburned one (13:1) because the decrease in organic N was proportional to the loss in organic C. This agrees with that reported by Raison et al.
(1985), in that N compounds are usually lost in direct proportion to the amount of oxidized C.
In spite of the reduction in soil organic N due to burning, the levels of inorganic N (NH4+ and NO3) for plants were almost double in the burned soil (Table 2). The immediate increase in inorganic N was probably a consequence of physicochemi- cal breakdown of soil organic matter by heat (Biederbeck et al. 1980, Kovacic et al. 1986), since the release of inorganic N through nitrification process requires a
period of time elapsed after burning.
Ashes can add mineral N, but in small amounts (Raison 1979). The elevated con- centration of inorganic N, in unburned soil, indicates that this ecosystems has a considerable potential of N mineralization.
The level of available P significantly increased from 21.5 to 31.7 mg kg', after burning (Table 2). This increase in P could arise from the release of P as H2P04- by heating (Fassbender 1975), which formed phosphates of Ca, Fe, and Al that are extractable with the technique used for P determination. Phosphorous may be also added to the soil surface in ashes, mainly
Table 2. Changes in soil nutrient pools and chemical properties at the 0-5 cm depth in the unburned and burned grassland soil.
Treatment
Soil characteristics Unburned Burned
Water content (g g 1) 0.48 0.46
Organic C (g kg') 60.65 54.10
Organic N (g kg 1) 4.37 4.07
NH4+-N plus N03--N (mg kg l) 39.72 69.72
Available P (mg kg 1) 21.50 31.77 *
CEC (cmolc kg 1) 26.70 25.92
Ca++(cmolc kg 1) 12.65 12.72
Mg++(cmolc kg 1) 5.28 5.53
K+(cmolc kg 1) 1.96 2.03
Na+(cmolc kg 1) 0.56 1.35
pH water 6.85 7.23 * *
significant at P < 0.1 and P < 0.05, respectively.
ns = not significant.
organic N loss, 7%, was probably a result of volatilization of N compounds during fire (DeBano et al. 1979). Soil moisture content at the time of fire strongly affects
as polyphosphates of Ca (Raison 1979).
The high levels of inorganic N and avail- able P may affect the growth of the plant
JOURNAL OF RANGE MANAGEMENT 56(3) May 2003 295