RESEARCH ARTICLE
Skeletal muscle contractile function predicts activity and behaviour
in zebrafish
Frank Seebacher1,*, Alexander G. Little2and Rob S. James3
ABSTRACT
Locomotion facilitates behaviour and its underlying physiological mechanisms may therefore impact behavioural phenotypes. Metabolism is often thought to modulate locomotion and behaviour, but empirical support for this suggestion is equivocal. Muscle contractile function is directly associated with locomotion. Here, we test the hypotheses that muscle mechanics determine locomotor performance and activity in zebrafish (Danio rerio) and thereby also affect risk-taking behaviour. We show that there is a mechanistic link between muscle performance and behaviour by manipulating muscle contractile properties, which caused proportional changes in critical sustained swimming performance and, in an open arena, voluntary swimming speed, the proportion of time fish were active, and the latency to move. We modelled the relationships between muscle contractile properties, swimming performance, activity and behaviour with a partial least-squares path model. The latent variable‘muscle’, formed by isolated muscle force production, stress, fatigue resistance and activation and relaxation rates, had a significant positive effect on swimming performance (‘swim’ reflected in sustained and sprint speeds). Together, muscle and swim had a significant positive effect on activity, and explained 71.8% of variation in the distance moved, time active and maximum voluntary speed in an open field. Activity had a significant positive effect on boldness, explaining 76.0% of variation in latencies to move and to approach a novel object. Muscle contractile function determines voluntary movement and we suggest that exploration and dispersal are functions of physiological and mechanical optimisation. Boldness therefore may be partly explained by the greater likelihood of faster fish to move further and encounter novel objects and conspecifics more quickly as a result.
KEY WORDS: Locomotor performance, Voluntary speed, Boldness, Muscle force, Muscle fatigue resistance, Open field
INTRODUCTION
Locomotion enables animal behaviour, facilitating foraging and predator–prey interactions (Dickson et al., 2002; Grigaltchik et al., 2012), migration (Kvist et al., 2001) and movement associated with behavioural interactions (Mowles et al., 2010). The position of locomotion at the interface between physiology, behaviour and ecology means that it is an essential component that determines fitness of individuals (Husak et al., 2006) and thereby, persistence of populations (Nathan et al., 2008). Locomotor performance affects behaviour by increasing resource-holding potential (Mowles et al.,
2010) and because greater physiological capacities will permit more sustained physical activity and exploration (Garland et al., 2011; Sinclair et al., 2014). The physiological traits underlying locomotor performance are therefore likely to influence behaviour.
Locomotor performance is determined to a large extent by energy metabolism and muscle function, as well as by the shape of the animal which affects hydro- or aerodynamic drag (Drucker and Lauder, 1999; Fish and Lauder, 2006). Energy metabolism supplies the energy (ATP) necessary to power muscle contraction and relaxation (Allen et al., 2008) so that locomotor performance can be positively related to maximal metabolic capacities (Claireaux et al., 2006). However, this is not always the case and whole-animal oxygen consumption and the activities of muscle mitochondrial and glycolytic enzymes are often poor predictors of locomotor performance (Gibb and Dickson, 2002). At the same time, rates of oxygen consumption are linked to behavioural phenotypes (Biro and Stamps, 2010) and theory predicts that individuals with higher metabolic rates are also bolder, more prone to move and explore novel environments, and to take risk (Biro and Stamps, 2010; Careau and Garland, 2012; Careau et al., 2008; Dingemanse et al., 2010; Killen et al., 2014; Reale et al., 2010). However, the link between metabolic rates and behaviour is not consistent across species and contexts (Reale et al., 2010).
In addition to energy metabolism, intrinsic muscle function can cause variation in locomotion (Gundersen, 2011) and thereby affect the behaviour and ecology of animals. Muscle contraction and relaxation are the proximate mechanism that cause movement and are therefore directly involved in mediating animal locomotion. Muscle contraction is initiated by neural stimulation of dihydropyridine receptors, which interact with ryanodine receptors to release calcium from the sarcoplasmic reticulum (Berchtold et al., 2000). Calcium binding to troponin facilitates the interaction between myosin and actin and thereby muscle contraction. Calcium is re-sequestered into the sarcoplasmic reticulum by the activity of sarco-endoplasmic reticulum calcium ATPase in a process that mediates muscle relaxation (Berchtold et al., 2000). The calcium-dependent rates of muscle contraction and relaxation determine force production and fatigue resistance (Allen et al., 2008). Differences in intrinsic muscle function can therefore cause individual differences in locomotor performance (Berchtold et al., 2000; Seebacher et al., 2012), which may directly impinge on behavioural phenotypes.
Our aim was to determine whether variation in muscle function is associated with inter-individual differences in locomotor performance, and therefore activity and behaviour. Behaviour comprises a number of categories that together make up animal personality (Briffa and Weiss, 2010). Here, we considered the behavioural dimensions of activity, which may be defined as patterns of movement resulting from muscular activity, and boldness, which reflects the reaction of an individual to a novel and potentially risky situation (Careau and Garland, 2012; Webster and Ward, 2011).
Received 23 July 2015; Accepted 11 October 2015 1
School of Biological Sciences A08, University of Sydney, Sydney, New South Wales 2006, Australia.2Donnelly Centre for Cellular and Biomolecular Research, Faculty of Medicine, The University Of Toronto, Toronto ON M5S, Canada.3Centre for Applied Biological and Exercise Sciences, Coventry University, Coventry CV1 5FB, UK.
*Author for correspondence ([email protected])
Journal
of
Experimental
We approached this aim by manipulating muscle function with the calcium channel inhibitor nifedipine to test the hypothesis that decreases in muscle contractile performance will cause proportional decreases in swimming performance, activity and behaviour. Nifedipine is a muscle-specific calcium channel blocker that reduces force production (Foster et al., 1983; Seebacher et al., 2012). We used path modelling to determine functional relationships between sets of response variables. Hence, we tested the hypotheses that increases in muscle mechanical performance– rates of muscle activation and relaxation, force production, stress (i.e. normalised force) and fatigue resistance–cause increases in locomotor performance. We next hypothesised that differences in locomotor performance (sustained and sprint speeds) are positively associated with different levels of activity between individuals; we measured activity in an open field test as total distance moved, proportion of time spent moving and maximum speed attained. We also tested the hypothesis that muscle mechanics affect activity directly, for example, by influencing unsteady swimming during turning (Webb, 1982). Lastly, we tested the hypothesis that increased levels of activity lead to bolder phenotypes that show shorter latencies to move in a novel environment or to approach a novel object.
MATERIALS AND METHODS
Study animals
All experiments were performed with the approval of the University of Sydney Animal Ethics Committee (approval number L04/8/2012/1/5803). Zebrafish [Danio rerio(Hamilton 1822); standard length, 26.52±0.45 mm; mass, 0.31±0.022 g (means±s.e.)] were obtained from a commercial supplier (Livefish, Bundaberg, Australia) and maintained in plastic tanks (600×450×250 mm; 1–2 fish l−1) with dechlorinated water at 23°C, and a
12 h dark:12 h light photoperiod for at least 2 weeks before experimentation. Fish were fed twice a day with commercial tropical fish flakes (Wardley Tropical Fish Flakes, The Hartz Mountain Corporation, Secaucus, NJ, USA).
Experimental treatments
Our aim was to test the hypothesis that changes in muscle function will have downstream effects on locomotor performance activity and behaviour. We approached this aim by manipulating muscle performance experimentally by exposing fish (N=10) to the calcium channel blocker nifedipine (Foster et al., 1983) dissolved in dimethylsulfoxide (DMSO; 50 µmol l−1final
concentration in tank water) or DMSO alone (N=10), as described previously (Seebacher et al., 2012; Sinclair et al., 2014). The half-life of nifedipine is several hours (Foster et al., 1983; Sinclair et al., 2014), so its effect persisted throughout the experiments. Additionally, we conducted muscle mechanics experiments in Ringer solution (see below) with the same concentrations of nifedipine and DMSO as for the whole animal exposure experiments to ensure that drug effects persisted until the end of all experimentation. Unequal sample sizes are due to missing data, and we obtained a full data set of all muscle mechanics, locomotor and behavioural measures from 24 individuals (9 control, 10 nifedipine, 5 DMSO) only. Consecutively, on the same day, we measured activity and behaviour in an open field arena, followed by measures of swimming performance in the same fish, after which fish were killed to determine mechanics of isolated locomotory rostral muscle.
Activity, behaviour and swimming
Activity and behaviour were determined in an open field arena (600×400 mm) with water depth of 25 mm (Stewart et al., 2012); water in the arenas consisted of the same aged freshwater source as holding tanks and 500 ml of home tank water was added to the arenas to ensure that fish in all trials experienced similar chemical signals. Fish were removed from their home tanks and introduced into a small, opaque cylindrical enclosure (50 mm diameter×100 mm high) situated in one corner of the open field
arena. After 10 min, the enclosure was lifted remotely and fish were free to explore the arena for 10 min. After 10 min, a novel object (a blue hose T-connector measuring 50 mm along each axis) was dropped into the tank. The trial was filmed (with a HD Pro Webcam C905, Logitech, China, filming at 30 frames s−1) from the time when fish were first introduced to the enclosure until fish approached within 50 mm of the novel object. All videos were analysed in video-tracking software (Tracker Video Analysis and Modeling Tool, www.opensourcephysics.org).
As response variables (Stewart et al., 2012; Wilson et al., 2010), we measured the time it took fish to move more than 50 mm from their release site (time to move). In the following 60 s we then measured the total distance moved (distance), the mean voluntary swimming speed, the maximum speed attained (max. speed), and the number of seconds a fish was active (time active), where activity was defined as moving more than 1 body length in a second. Lastly, we measured the time it took fish to approach the novel object to within 50 mm after the object was introduced (novel object). After the behavioural trials, fish were removed from the open field arena and swimming performance was measured. We measured sprint performance (sprint) and sustained swimming speed (Ucrit)
according to Seebacher and Walter (2012). Filming at 30 frames s−1is sufficient to determine maximum voluntary speed and sprint speed: at a maximum swimming speed of 0.6 m s−1, 30 frames s−1gives an accuracy of 3% of the true value, which is small relative to the differences between individuals that we were interested in.
Muscle biomechanics
We killed fish with a blow to the head and transected the spinal cord. The skin was removed and a section of rostral (anterior dorsal) muscle fibres of 7–8 myotomes in length was dissected from one side of the fish for measurements of muscle mechanics, in cooled (<5°C) aerated fish Ringer solution [composition in mmol l−1: NaCl, 115.7; sodium pyruvate, 8.4; KCl, 2.7; MgCl2, 1.2; NaHCO3, 5.6; NaH2PO4, 0.64;
HEPES sodium salt, 3.2; HEPES, 0.97; CaCl2, 2.1; pH 7.4 at 20°C;
(Wakeling et al., 2000)]. The spine was removed from most of the muscle preparation leaving one myotome attached to the residual amount of spine at either end.
We conducted isometric studies to determine the twitch and tetanus kinetics of the isolated muscle. Suture thread was attached to each section of spine to enable the muscle preparation to be tied onto a strain gauge at one end (UF1, Pioden Controls Ltd, Canterbury, UK) and a motor arm at the other end (V201, Ling Dynamics Systems, Royston, UK) attached to an LVDT (linear variable displacement transformer DFG 5.0, Solartron Metrology, Bognor Regis, UK). Each muscle preparation was then allowed to equilibrate for 10 min at 23.5±0.5°C in circulating aerated fish Ringer solution. Square wave stimuli of 165 mA were delivered via parallel platinum electrodes to each muscle preparation, held at constant length, to generate a series of twitches. We adjusted stimulus amplitude (14 to 24V), pulse width ( pulse duration, 2.2 to 2.4 ms) and muscle length to determine the settings that corresponded to maximal isometric twitch force. We measured the muscle length that yielded maximal twitch force with Vernier calipers to the nearest 0.1 mm. An isometric tetanic force response was then elicited by subjecting the muscle preparation to a 150 ms train of stimulation, using the stimulation amplitude, pulse width and muscle length found to generate maximum twitch force. We measured time to half peak tetanic force and time from last stimulus to half tetanic force relaxation. We allowed a rest period of 5 min between each tetanic response, before altering stimulation frequency (230 to 250 Hz) to determine maximal tetanic force. We calculated rates of force production [( peak tetanic force/2)×time to half peak tetanus] and muscle relaxation [( peak tetanic force/2)×time from last stimulus to half relaxation] for the maximal tetanic response as additional measures of the contractile performance of muscle. After a further 5 min rest, we determined fatigue resistance by subjecting muscle preparations to a series of tetani, each of 150 ms stimulation duration, at a rate of one tetanus per second for 25 s. For each muscle, fatigue resistance was calculated as the maximal force produced in the 25th tetanus as a percentage of the maximal force produced in the 1st tetanus for the same muscle. Ten minutes after the fatigue run each preparation was stimulated to produce a further tetanus to determine recovery from the fatigue run (mean recovery was 67%).
Journal
of
Experimental
At the end of the muscle mechanics experiments, we removed bone and connective tissue and blotted each muscle preparation on absorbent paper to remove excess Ringer solution. We measured wet muscle mass to the nearest 0.1 mg using an electronic balance. Mean muscle cross-sectional area was calculated from muscle length and mass assuming a density of 1060 kg m−3 (Mendez and Keys, 1960) as 1.99±0.56 mm2. Maximum isometric muscle stress (kN m−2) was then calculated for each tetanic response as the maximum tetanic force within that response divided by mean cross-sectional area.
Statistical analyses
We tested the effects of nifedipine by comparing between treatment groups [nifedipine (N=10), DMSO (N=5) and controls (N=9)] for each response variable with permutational analyses using lmPerm in R (R Development Core Team, 2013; Wheeler, 2014). We used standard length as a covariate. Tukey HSDpost hoctest indicated that DMSO did not affect any of the response variables (allP>0.14), so that we present results for comparisons between nifedipine and control treatments only. We tested for the potential effect of multiple hypothesis testing using the truncated product method (Zaykin et al., 2002; Moran, 2003). The truncated product method analyses the distribution ofP-values from multiple hypothesis tests to provide a table-widePvalue for the overall hypothesis thatP-values were not skewed. Multiple hypothesis testing did not bias the statistical results presented here (P<0.001).
Path model
We analysed the effect of traits at different levels of organisation on behaviour by partial least-squares path modelling in the R package plspm (Sanchez, 2013). Partial least-squares path modelling is a method designed to test for significant relationships in a network of causal relationships that have been defined according to an appropriate theoretical model (Esposito Vinzi et al., 2010; Tenenhaus et al., 2005). The technique relies on defining a set of latent variables that represent the biological responses of interest. The directional relationship between these latent variables is modelled based on theory. In our case, latent variables (the inner model) were muscle, swimming, activity and boldness, which represent muscle mechanics, swimming performance, voluntary activity and behaviour along the bold-shy continuum, respectively. Additionally, we added shape as a latent variable to account for the effect of differences in body shape, and therefore drag, between individuals on swimming performance. As outlined in the Introduction, we predicted that muscle affects swimming performance positively, and that there is a positive relationship between swimming and activity. Additionally, we predict that muscle also has a direct positive influence on activity by facilitating unsteady movement such as postural changes and turning. Lastly, we predict that activity is positively related to boldness, or in the case of our measures (latency to move and approaching a novel object), there is a negative relationship between increasing activity and latency, indicating that more active fish are quicker to move and approach novel objects sooner.
Each latent variable is defined by a set of measurable indicators (the outer model). We used the complete data set from 24 fish to define our latent variables. Hence, muscle is defined by the formative indicators (i.e. indicators that form the latent variable) force, stress, fatigue resistance and rates of contraction and relaxation. We predicted that muscle causes changes in swim, which is reflected in the indicators sprint and Ucrit
(reflective indicators). Shape was defined as: mass (g)×length−3(cm)×100 (Nash et al., 2006) as the single formative indicator and we predicted that shorter fish with greater mass have slower swimming speeds because wider fish would need to displace more water; this reasoning assumes that the body condition (e.g. proportion of fat to muscle) of animals is similar, which is reasonable given that all fish were adults and were kept under identical conditions. Activity was reflected by distance moved, the time (s) fish were active during the trial (=time active), and maximum voluntary speed. Lastly, we predicted that increased activity also increases boldness, which is reflected in the latency to move and approach a novel object. In the analysis, we multiplied latency scores by−1 so that a positive association indicated a shorter time to move or approach a novel object, and hence increased boldness.
For reflective indicators, the analysis assumes unidimensionality of indicators for each latent variable, which was the case for each of our latent variables (Dillon–Glodsteins rho: swim=0.76; activity=0.88; boldness=0.87). Additionally, crossloadings of reflective indicators show that each indicator was appropriately assigned to its latent variable and did not score higher with any of the other variables. Note that these assumptions are not necessary for formative indicators.
RESULTS
Nifedipine treatment
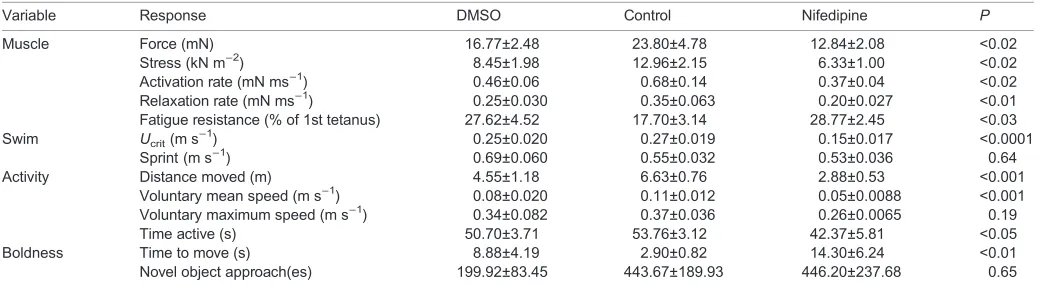
[image:3.612.47.571.556.698.2]The nifedipine treatment significantly reduced muscle force production, stress and activation and relaxation rates (Table 1). However, fatigue resistance increased in the nifedipine treatments (Table 1). Ucrit decreased significantly following exposure to nifedipine but sprint speed remained unaffected (Table 1). In the open field arena, the distance moved, mean voluntary speed, the time active and the time to move all decreased significantly following nifedipine treatment. However, voluntary maximum speed and the time to approach a novel object were not affected by nifedipine (Table 1).
Path model
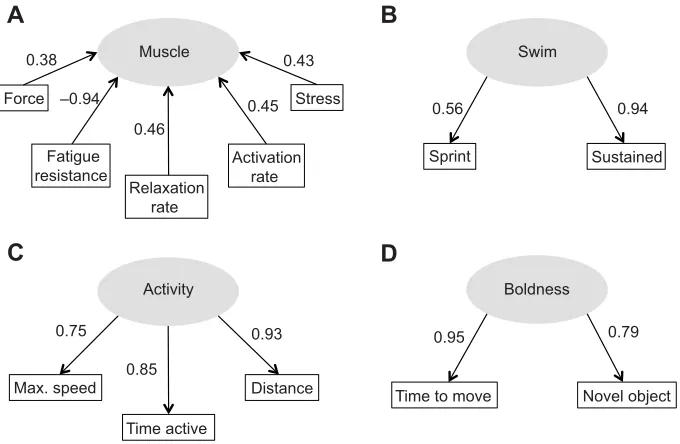
In the outer model, force, stress and activation and relaxation rates had a positive effect on the latent variable muscle and each explained around 15–20% of variance in the latent variable (loadings2; (Sanchez, 2013); Fig. 1A]. However, fatigue
Table 1. Effect of nifedipine on responses used to define the latent variables
Variable Response DMSO Control Nifedipine P
Muscle Force (mN) 16.77±2.48 23.80±4.78 12.84±2.08 <0.02
Stress (kN m−2) 8.45±1.98 12.96±2.15 6.33±1.00 <0.02
Activation rate (mN ms−1) 0.46±0.06 0.68±0.14 0.37±0.04 <0.02
Relaxation rate (mN ms−1) 0.25±0.030 0.35±0.063 0.20±0.027 <0.01
Fatigue resistance (% of 1st tetanus) 27.62±4.52 17.70±3.14 28.77±2.45 <0.03 Swim Ucrit(m s−
1
) 0.25±0.020 0.27±0.019 0.15±0.017 <0.0001
Sprint (m s−1) 0.69±0.060 0.55±0.032 0.53±0.036 0.64
Activity Distance moved (m) 4.55±1.18 6.63±0.76 2.88±0.53 <0.001
Voluntary mean speed (m s−1) 0.08±0.020 0.11±0.012 0.05±0.0088 <0.001
Voluntary maximum speed (m s−1) 0.34±0.082 0.37±0.036 0.26±0.0065 0.19
Time active (s) 50.70±3.71 53.76±3.12 42.37±5.81 <0.05
Boldness Time to move (s) 8.88±4.19 2.90±0.82 14.30±6.24 <0.01
Novel object approach(es) 199.92±83.45 443.67±189.93 446.20±237.68 0.65
Compared with control, nifedipine altered muscle performance (force, stress, activation rate, relaxation rate, fatigue resistance). A significant effect of nifedipine on locomotor performance (swim;Ucritand sprint), activity (voluntary mean speed, distance moved, voluntary maximum speed, time active) and boldness (time to
move, novel object approach) indicates a downstream effect of reduced muscle performance. There were no statistically significant differences between the DMSO (N=5) and control (N=9) treatments, soP-values refer to the comparison between control and nifedipine (N=10) treatments.
Journal
of
Experimental
resistance scaled negatively with muscle; note that formative indicators are not assumed to be positively correlated, but reflective indicators are. All reflective indicators each explained more that 50% of variation in their respective latent variables (i.e. loadings >0.7 for indicators of swim, activity and boldness), except for sprint performance, which was the weakest indicator (Fig. 1B). In the inner model, muscle had a significant positive effect on swim ( path coefficient=0.38,t=2.19,P<0.05) and on activity ( path coefficient=0.50,t=3.16,P<0.01; Fig. 2). Shape had a significant negative effect on swim so that shorter and heavier fish had slower swimming speeds (t=−2.56,P<0.02). Muscle and shape together explained 59.6% of variation in swim (average redundancy=0.596; Sanchez, 2013). Swim affected activity positively ( path coefficient=0.41, t=2.60, P<0.02); the high loading of Ucrit on swim means that sustained swimming performance in particular had a strong positive association with activity. Hence, mean voluntary swimming speed in the open field, which encompasses the predictors‘time active’and‘distance’, increased proportionally to
Ucrit (linear regression,R2=0.50,F1,22=22.27, P<0.0001; Fig. 3) and voluntary speed was 35.5±3.0% (mean±s.e.) ofUcrit. Together, muscle and swim explained 71.8% of variation in activity (average redundancy=0.718). Activity had a positive effect on boldness, explaining 76.0% of its variation ( path coefficient=0.69, t=4.43, P<0.001; average redundancy=0.760; Fig. 2).
DISCUSSION
We have shown that changes in muscle mechanics elicit proportional changes in swimming performance, activity and behaviour. This finding means that behaviour is dependent on intrinsic muscle contractile properties as well as on metabolic and endocrine systems (Briffa and Sneddon, 2007). We used nifedipine to manipulate muscle function directly as a more robust test of the hypothesis that muscle function modulates behaviour, rather than relying on inter-individual variation and correlations between traits alone, because the latter approach cannot establish cause and effect. However, the experimental approach also introduces variation in the traits we measured. The variance in the population of our experimental fish may therefore exceed that occurring naturally, so that the applicability of our results to natural situations may be diminished. However, the total range of values and the standard deviation of swimming performance in our experimental fish were similar to those of larger untreated populations of zebrafish (McClelland et al., 2006; Seebacher and Walter, 2012). As far as we are aware, there are no previously published values for isolated muscle performance in zebrafish. However, the variation in measures of muscle mechanics in our total zebrafish population was similar to that observed in other ectotherms, including fish (Johnston and Sidell, 1985; Seebacher et al., 2012; Wilson et al., 2002). Nifedipine does not block the calcium channel (dihydropyridine receptor) completely, but reduces its activity so that the treated fish perform within a normal range, albeit at the lower end (see also Sinclair et al., 2014). The variation in our data set is probably greater than in a similar sized sample of untreated fish, but it is not greater than in larger samples that probably reflect natural variation better (e.g. Seebacher and Walter, 2012).
Resistance to movement increases with increasing mass so that heavier fish for a given length have to produce greater force to move a given distance (Webb, 1971). The effect of mass can be
Muscle Swim
Fatigue resistance
Relaxation rate
Activation rate
Stress Force
0.38
–0.94
0.46
0.45 0.43
A
Sprint 0.56
Sustained 0.94
B
C
D
Max. speed
Time active
Distance Time to move Novel object
0.79 0.95
0.93
0.85 0.75
[image:4.612.49.389.59.281.2]Activity Boldness
Fig. 1. The outer model of indicator variables that define each latent variable.The latent variable muscle (A) is formed by the isolated muscle mechanics measures of force, stress (normalised force), rates of activation and relaxation, and fatigue resistance. The remainder of the latent variables are reflected by their indicator variables, where swim (B) is reflected in sprint and sustained (Ucrit) swimming
performance, activity (C) is reflected by maximum speed attained during trials (max. speed), total distance moved (distance) and the time per trial fish were active (time active) and boldness (D) was reflected by the latencies of fish to move (time to move) at the start of the trial, and to approach a novel object (novel object). Note that the latent variable shape has a single indicator and it is therefore not shown here. The loadings for each indicator variable are shown, and the squared loadings indicate the percentage of variation explained in the latent variable.
Muscle
Boldness
Activity Swim
0.38
0.41 0.69 0.50
Shape
–0.44
Fig. 2. The inner model of the path analysis showing relationships between latent variables.Path coefficients; negative values indicate significant negative relationships between latent variables and similarly, positive values indicate significant positive relationships between latent variables. Links between latent variables represent hypotheses that are determineda prioriand are based on the biological arguments outlined in the
main text.
Journal
of
Experimental
[image:4.612.52.289.519.663.2]particularly important during unsteady swimming, when drag is determined to a large extent by the product of mass and acceleration (Webb, 1982). Additionally, stouter fish, that is those with greater body mass relative to body length, may be less-efficient swimmers (Boily and Magnan, 2002). These considerations explain our result that an increasingly stout body shape had a negative effect on swimming performance.
Together, muscle mechanics and swimming performance explained a significant proportion of variation in activity. The role of muscle mechanics we show here is novel, but swimming performance is also associated with activity and behaviour in other species of fish both in the laboratory and in the wild (Hasler et al., 2009; McDonald et al., 2007; Plaut, 2001). An interesting question is how activity relates to dispersal in an ecologically relevant context (Clobert et al., 2009). Animals that move frequently do not necessarily move for long distances. Our data, however, indicate that frequency of movement and distance moved are closely correlated, so that variation in muscle function may also influence dispersal. The tendency to disperse and dispersal distance vary between individuals, and differences in behavioural phenotypes can at least partly explain dispersal (Clobert et al., 2009; Cote et al., 2010). Our data suggest that muscle function and dispersal are linked by activity. Individual differences in muscle function, which may partly explain dispersal tendency, may arise from trade-offs between modes of locomotion. Sprint and sustained locomotion may be advantageous in different contexts, but physiological constraints permit optimisation of only one, so that some individuals within a population may be specialised for sprint performance and others for sustained performance (Vanhooydonck et al., 2001; Wilson and James, 2004). The latter would be more likely to produce individuals with greater dispersal tendency. The process of dispersal itself represents‘exercise training’, which can produce a training effect at the level of cardiovascular, metabolic and muscle function that improve locomotor performance (Davison, 1997; Gundersen, 2011), and it can cause hormonal changes that increase the motivation to move (Fragala et al., 2011). Hence, the initial tendency to disperse may be reinforced during the dispersal process (Sinclair et al., 2014). However, these suggestions regarding dispersal should be treated as hypotheses that need to be verified experimentally under more realistic dispersal conditions.
The influence of muscle function on speed during voluntary movement indicates that voluntary speed is determined by maximal capacities. TheUcritof nifedipine-treated fish was greater than the mean voluntary speed of control fish so that the nifedipine treatment did not prevent fish swimming at the same speed as controls. Instead, voluntary speed occurred at a given proportion of maximal speed. Maximal speeds may be important ecologically under certain circumstances, such as when defending territories or escaping predators (Husak and Fox, 2006). However, animals under undisturbed conditions often do not move at their maximal capacity (Hasler et al., 2009; Husak, 2006; Husak and Fox, 2006; McDonald et al., 2007; Irschick and Losos, 1998; Irschick et al., 2005; Palstra et al., 2010; Wickler et al., 2000). Our data showing that voluntary speed changes linearly with maximal speed is interesting because it suggests that there is a mechanistic link between the two. In theory, animals move at preferred speeds and step lengths, which may be determined by minimising the cost of transport (Weihs, 1973; Wickler et al., 2000; Claireaux et al., 2006) and by maximising the efficiency of muscle performance, which occurs at a fraction of maximal power output (Lichtwark and Wilson, 2005). Our data suggest that voluntary speeds reflect optimisation of efficiency at a fraction of maximal speed. Energy expenditure during locomotion may be determined by constraints of metabolic ATP supply, and the rate of ATP use at the level of the muscle. The latter comprises ATP use by myosin ATPase to provide the energy for actin–myosin interaction and contraction, and by the sarco-endoplasmic reticulum ATPase to facilitate re-sequestration of calcium into the sarcoplasmic reticulum to facilitate muscle relaxation (Berchtold et al., 2000). The rates of contraction and relaxation we measured are proportional to these biochemical processes, respectively and both influence force production and stress (Berchtold et al., 2000; James, 2013; Seebacher et al., 2012). ATP produced by mitochondria or glycolysis and ATPase activities therefore represent supply and demand, respectively, in the energetics of muscle function and locomotion. Both may constrain locomotion, and the extent of that constraint determines which one predicts locomotor performance.
Variation in muscle and metabolic traits as a result of environmental changes will also have broader effects on animal behaviour and dispersal (Killen et al., 2013; Sinclair et al., 2014). Plasticity of locomotor function in response to environmental variability differs between individuals as a result of trade-offs between responses to warm and cold (Herrel et al., 2007; Seebacher et al., 2015) and these dynamics could also maintain behavioural variability within populations. If preferred speeds are associated with boldness as our data indicate, then boldness may be determined simply by the greater likelihood of faster fish to move further (i.e. explore more) and encounter novel objects and conspecifics more quickly as a result. It may be hypothesised that differences in voluntary speed could therefore also explain behavioural differences between individuals within populations.
Competing interests
The authors declare no competing or financial interests.
Author contributions
F.S. designed the project, conducted experiments, analysed the data, and wrote the manuscript; R.S.J. performed muscle mechanics experiments, analysed data, and edited the manuscript; A.G.L. performed experiments and edited the manuscript.
Funding
This project was funded by the University of Sydney and R.S.J. was supported by a research grant from Coventry University.
0 5 10 15
0 2 4 6 8
Ucrit (BL s–1)
V
oluntary speed (BL
s
–1
) NifedipineDMSO
[image:5.612.95.256.57.220.2]Control
Fig. 3. Mean voluntary swimming speed in an open field is strongly positively related to maximal swimming performance (Ucrit).Mean
voluntary swimming speed was 35.5±3.0% (mean±s.e.) ofUcrit. Data from all
treatments and the significant regression line are shown (y=−0.35+0.40x; R2=0.50).
Journal
of
Experimental
References
Allen, D. G., Lamb, G. D. and Westerblad, H.(2008). Skeletal muscle fatigue: cellular mechanisms.Physiol. Rev.88, 287-332.
Berchtold, M. W., Brinkmeier, H. and Müntener, M.(2000). Calcium ion in skeletal muscle: its crucial role for muscle function, plasticity, and disease.Physiol. Rev. 80, 1215-1265.
Biro, P. A. and Stamps, J. A.(2010). Do consistent individual differences in metabolic rate promote consistent individual differences in behavior?Trends Ecol. Evol.25, 653-659.
Boily, P. and Magnan, P.(2002). Relationship between individual variation in morphological characters and swimming costs in brook charr (Salvelinus fontinalis) and yellow perch (Perca flavescens).J. Exp. Biol.205, 1031-1036. Briffa, M. and Sneddon, L. U. (2007). Physiological constraints on contest
behaviour.Funct. Ecol.21, 627-637.
Briffa, M. and Weiss, A.(2010). Animal personality.Curr. Biol.20, R912-R914. Careau, V. and Garland, T., Jr. (2012). Performance, personality, and
energetics: correlation, causation, and mechanism. Physiol. Biochem. Zool. 85, 543-571.
Careau, V., Thomas, D., Humphries, M. M. and Réale, D. (2008). Energy metabolism and animal personality.Oikos117, 641-653.
Claireaux, G., Couturier, C. and Groison, A.-L.(2006). Effect of temperature on maximum swimming speed and cost of transport in juvenile European sea bass (Dicentrarchus labrax).J. Exp. Biol.209, 3420-3428.
Clobert, J., Le Galliard, J.-F., Cote, J., Meylan, S. and Massot, M.(2009). Informed dispersal, heterogeneity in animal dispersal syndromes and the dynamics of spatially structured populations.Ecol. Lett.12, 197-209.
Cote, J., Fogarty, S., Weinersmith, K., Brodin, T. and Sih, A.(2010). Personality traits and dispersal tendency in the invasive mosquitofish (Gambusia affinis). Proc. R. Soc. B Biol. Sci.277, 1571-1579.
Davison, W.(1997). The effects of exercise training on teleost fish, a review of recent literature.Comp. Biochem. Physiol. A Physiol.117, 67-75.
Dickson, K. A., Donley, J. M., Sepulveda, C. and Bhoopat, L.(2002). Effects of temperature on sustained swimming performance and swimming kinematics of the chub mackerelScomber japonicus.J. Exp. Biol.205, 969-980.
Dingemanse, N. J., Kazem, A. J. N., Réale, D. and Wright, J.(2010). Behavioural reaction norms: animal personality meets individual plasticity.Trends Ecol. Evol. 25, 81-89.
Drucker, E. G. and Lauder, G. V.(1999). Locomotor forces on a swimming fish: three-dimensional vortex wake dynamics quantified using digital particle image velocimetry.J. Exp. Biol.202, 2393-2412.
Esposito Vinzi, V., Trinchera, L. Amato, S.(2010). PLS path modeling: from foundations to recent developments and open issues for model assessment and imrpovement. InHandbook of Partial Least Squares(ed. V. Esposito Vinzi, W. W. Chin, J. Henseler and H. Wang). Berlin, Heidelberg: Springer.
Fish, F. E. and Lauder, G. V.(2006). Passive and active flow control by swimming fishes and mammals.Annu. Rev. Fluid Mech.38, 193-224.
Foster, T. S., Hamann, S. R., Richards, V. R., Bryant, P. J., Graves, D. A. and McAllister, R. G. (1983). Nifedipine kinetics and bioavailability after single intravenous and oral doses in normal subjects. J. Clin. Pharmacol. 23, 161-170.
Fragala, M. S., Kraemer, W. J., Denegar, C. R., Maresh, C. M., Mastro, A. M. and Volek, J. S. (2011). Neuroendocrine-immune interactions and responses to exercise.Sports Med.41, 621-639.
Garland, T., Schutz, H., Chappell, M. A., Keeney, B. K., Meek, T. H., Copes, L. E., Acosta, W., Drenowatz, C., Maciel, R. C., van Dijk, G. et al. (2011). The biological control of voluntary exercise, spontaneous physical activity and daily energy expenditure in relation to obesity: human and rodent perspectives.J. Exp. Biol.214, 206-229.
Gibb, A. C. and Dickson, K. A.(2002). Functional morphology and biochemical indices of performance: is there a correlation between metabolic enzyme activity and swimming performance?Integr. Comp. Biol.42, 199-207.
Grigaltchik, V. S., Ward, A. J. W. and Seebacher, F.(2012). Thermal acclimation of interactions: differential responses to temperature change alter predator-prey relationship.Proc. R. Soc. B Biol. Sci.279, 4058-4064.
Gundersen, K.(2011). Excitation-transcription coupling in skeletal muscle: the molecular pathways of exercise.Biol. Rev.86, 564-600.
Hasler, C. T., Suski, C. D., Hanson, K. C., Cooke, S. J., Philipp, D. P. and Tufts, B. L. (2009). Effect of water temperature on laboratory swimming performance and natural activity levels of adult largemouth bass.Can. J. Zool. 87, 589-596.
Herrel, A., James, R. S. and Van Damme, R. (2007). Fight versus flight: physiological basis for temperature-dependent behavioral shifts in lizards.J. Exp. Biol.210, 1762-1767.
Husak, J. F.(2006). Does survival depend on how fast you can run or how fast you do run?Funct. Ecol.20, 1080-1086.
Husak, J. F. and Fox, S. F.(2006). Field use of maximal sprint speed by collared lizards (Crotaphytus collaris): compensation and sexual selection.Evolution60, 1888-1895.
Husak, J. F., Fox, S. F., Lovern, M. B. and Van Den Bussche, R. A.(2006). Faster lizards sire more offspring: sexual selection on whole-animal performance. Evolution60, 2122-2130.
Irschick, D. J. and Losos, J. B.(1998). A comparative analysis of the ecological significance of maximal locomotor performance in CaribbeanAnolis lizards. Evolution52, 219-226.
Irschick, D. J., Herrel, A., Vanhooydonck, B., Huyghe, K. and Van Damme, R. (2005). Locomotor compensation creates a mismatch between laboratory and field estimates of escape speed in lizards: a cautionary tale for performance-to-fitness studies.Evolution59, 1579-1587.
James, R. S.(2013). A review of the thermal sensitivity of the mechanics of vertebrate skeletal muscle.J. Comp. Physiol. B183, 723-733.
Johnston, I. and Sidell, B.(1985). Force-velocity characteristics and metabolism of carp muscle fibres following temperature acclimation.J. Exp. Biol. 119, 239-249.
Killen, S. S., Marras, S., Metcalfe, N. B., McKenzie, D. J. and Domenici, P. (2013). Environmental stressors alter relationships between physiology and behaviour.Trends Ecol. Evol.28, 651-658.
Killen, S. S., Mitchell, M. D., Rummer, J. L., Chivers, D. P., Ferrari, M. C. O., Meekan, M. G. and McCormick, M. I.(2014). Aerobic scope predicts dominance during early life in a tropical damselfish.Funct. Ecol.28, 1367-1376.
Kvist, A., Lindström, A., Green, M., Piersma, T. and Visser, G. H.(2001). Carrying large fuel loads during sustained bird flight is cheaper than expected.Nature413, 730-732.
Lichtwark, G. A. and Wilson, A. M.(2005). A modified Hill muscle model that predicts muscle power output and efficiency during sinusoidal length changes. J. Exp. Biol.208, 2831-2843.
McClelland, G. B., Craig, P. M., Dhekney, K. and Dipardo, S. (2006). Temperature- and exercise-induced gene expression and metabolic enzyme changes in skeletal muscle of adult zebrafish (Danio rerio).J. Physiol.577, 739-751.
McDonald, D. G., Keeler, R. A. and McFarlane, W. J.(2007). The relationships among sprint performance, voluntary swimming activity, and social dominance in juvenile rainbow trout.Physiol. Biochem. Zool.80, 619-634.
Mendez, J. and Keys, A.(1960). Density and composition of mammalian muscle. Metabolism9, 184-188.
Moran, M. D.(2003). Arguments for rejecting the sequential Bonferroni in ecological studies.Oikos100, 403-405.
Mowles, S. L., Cotton, P. A. and Briffa, M.(2010). Whole-organism performance capacity predicts resource-holding potential in the hermit crab Pagurus bernhardus.Anim. Behav.80, 277-282.
Nash, R., Valencia, A. H. and Geffen, A. J.(2006). The origin of Fulton’s condition factor—setting the record straight.Fisheries31, 236-238.
Nathan, R., Getz, W. M., Revilla, E., Holyoak, M., Kadmon, R., Saltz, D. and Smouse, P. E.(2008). A movement ecology paradigm for unifying organismal movement research.Proc. Natl. Acad. Sci.105, 19052-19059.
Palstra, A. P., Tudorache, C., Rovira, M., Brittijn, S. A., Burgerhout, E., van den Thillart, G. E. E. J. M., Spaink, H. P. and Planas, J. V. (2010). Establishing zebrafish as a novel exercise model: swimming economy, swimming-enhanced growth and muscle growth marker gene expression. PLoS ONE5, e14483.
Plaut, I.(2001). Critical swimming speed: its ecological relevance.Comp. Biochem. Physiol. A Mol. Integr. Physiol.131, 41-50.
R Development Core Team(2013).R: A Language and Environment for Statistical Computing. Vienna, Austria: R Foundation for Statistical Computing.
Reale, D., Garant, D., Humphries, M. M., Bergeron, P., Careau, V. and Montiglio, P.-O.(2010). Personality and the emergence of the pace-of-life syndrome concept at the population level.Phil. Trans. R. Soc. B Biol. Sci.365, 4051-4063.
Sanchez, G.(2013).PLS Path Modeling with R. Berkeley, CA, USA: Trowchez Editions.
Seebacher, F. and Walter, I. (2012). Differences in locomotor performance between individuals: importance of parvalbumin, calcium handling and metabolism.J. Exp. Biol.215, 663-670.
Seebacher, F., Pollard, S. R. and James, R. S.(2012). How well do muscle biomechanics predict whole-animal locomotor performance? The role of Ca2+ handling.J. Exp. Biol.215, 1847-1853.
Seebacher, F., Ducret, V., Little, A. G. and Adriaenssens, B.(2015). Generalist-specialist trade-off during thermal acclimation.R. Soc. Open Sci.2, 140251. Sinclair, E. L. E., de Souza, C. R. N., Ward, A. J. W. and Seebacher, F.(2014).
Exercise changes behaviour.Funct. Ecol.28, 652-659.
Stewart, A. M., Gaikwad, S., Kyzar, E. and Kalueff, A. V.(2012). Understanding spatio-temporal strategies of adult zebrafish exploration in the open field test. Brain Res.1451, 44-52.
Tenenhaus, M., Vinzi, V. E., Chatelin, Y.-M. and Lauro, C.(2005). PLS path modeling.Comp. Stat. Data Anal.48, 159-205.
Vanhooydonck, B., Van Damme, R. and Aerts, P.(2001). Speed and stamina trade-off in lacertid lizards.Evolution55, 1040-1048.
Wakeling, J. M., Cole, N. J., Kemp, K. M. and Johnston, I. A.(2000). The biomechanics and evolutionary significance of thermal acclimation in the common
Journal
of
Experimental
carp Cyprinus carpio. Am. J. Physiol. Reg. Integr. Comp. Physiol. 279, R657-R665.
Webb, P. W.(1971). The swimming energetics of trout. I. Thrust and power output at cruising speeds.J. Exp. Biol.55, 489-520.
Webb, P. W.(1982). Locomotor patterns in the evolution of Actinopterygian fishes. Amer. Zool.22, 329-342.
Webster, M. M. and Ward, A. J. W.(2011). Personality and social context.Biol. Rev. 86, 759-773.
Weihs, D.(1973). Optimal fish cruising speed.Nature245, 48-50. Wheeler, B.(2014). Package“lmPerm.”R Package Version 1.1-2, 1-24. Wickler, S. J., Hoyt, D. F., Cogger, E. A. and Hirschbein, M. H. (2000).
Preferred speed and the cost of transport: the effect of incline.J. Exp. Biol. 203, 2195-2200.
Wilson, R. S. and James, R. S.(2004). Constraints on muscular performance: trade-offs between power output and fatigue resistance.Proc. R. Soc. B Biol. Sci. 271, S222-S225.
Wilson, R., James, R. S. and Van Damme, R.(2002). Trade-offs between speed and endurance in the frogXenopus laevis: a multi-level approach.J. Exp. Biol. 205, 1145-1152.
Wilson, A. D. M., Godin, J.-G. J. and Ward, A. J. W.(2010). Boldness and reproductive fitness correlates in the eastern mosquitofish,Gambusia holbrooki. Ethology116, 96-104.
Zaykin, D. V., Zhivotovsky, L. A., Westfall, P. H. and Weir, B. S. (2002). Truncated product method for combining P-values. Genet. Epedimiol. 22, 170-185.