Effect of Frequency Content on Seismic
Performance of RC Frames by Time History
Analysis
Chaitra Javoor1, Dr. Jagadish G. Kori2 1
P.G. Student, Department of Civil Engineering, Govt engineering college, Devagiri, Haveri, Karnataka, India
2
Professor and Head of the department, Department of Civil Engineering, Govt engineering college, Devagiri, Haveri, Karnataka, India
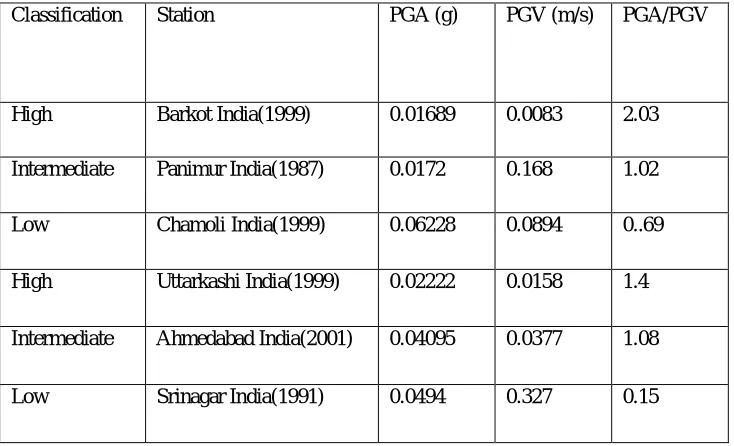
Abstract: Earthquake causes the random ground motions in all direction, radiating from the epicenter. These ground motions causes structure to vibrate and induces inertia forces in them. In India majority of the existing reinforced concrete structures in this seismic region do not meet the current seismic code requirements as these are primarily designed for gravity loads only. The performance of the existing buildings can be improved to perform better during the earthquakes, it must be analyzed and designed as per the Indian seismic code IS 1893 (Part 1) 2002. The impact of the event is most traumatic because it affects large area, occurs all on a sudden and unpredictable. They can cause large scale loss of life and property. Hundreds of small earthquake occurs around the world every day. Some of them are so minor that humans cannot feel them, but seismographs and other sensitive machines can record them. Buildings being one of the prime structures for mankind, Therefore, it is important to control structural response of symmetric and asymmetric buildings when subjected to earthquake ground motion. Behaviour of structures under seismic loads is influenced by the most important dynamic characteristics of earthquake viz. Peak Ground Acceleration (PGA), Peak Ground Velocity (PGV. The strength of ground motion is measured by frequency content which is defined as the ratio of PGA and PGV. High and low frequency contents are having PGA/PGV ratio greater than 1.2 and less than 0.8 respectively. Whereas, intermediate frequency content, PGA/PGV ratio lies in between these values.
Keywords: E-TABS, Ground Motion, Frequency Content, Non-linear Time History, Story Displacement, Story Drift, Story Shear.
I. INTRODUCTION
Earthquakes are one of the major natural hazards and responsible for the lives of thousands of people and the emission of seismic waves damages the structural buildings, roads and non-structural elements. Buildings being one of the prime structures for mankind, therefore necessary study should be carried out to know the earthquake acting on the structure and what will be the response of the structure. The damage on the structural element mainly depends on the magnitude and epicentre of the earthquake, and also on the type of structure. To minimize the damages on structural buildings due to earthquake loads, the structure should be analyzed and designed as per BIS (Bureau of Indian Standards) codes of practice. Seismic response controlled structures are being accepted as a fresh concept that can respond to the needs of a society in the new century. Structural control is one area of current research that looks promising in attaining reduce structural vibrations during loadings such as earthquakes and strong winds. The present study is to know the effect of frequency content on seismic performance of RC asymmetric and symmetric buildings.
II. OBJECTIVE OF THE PROJECT
A. To develop G+9 storied symmetric and asymmetric RC model.
B. To carryout time history analysis as per guidelines of IS 1893 (Part 1, 2002) on G+9 storied symmetric and asymmetric RC model considering the data of Barkot India (1999),Uttarkashi India (1999),Panimur India(1987),Ahmedabad India(2001), Chamoli India (1999) ,Srinagar India (1991) earthquakes with varying frequency contents.
C. To obtain the seismic parameters such as storey displacement, storey drift ratio and storey shear.
D. To evaluate the effect of time history analyses and varying frequency contents on seismic performance of G+10 storied symmetric and asymmetric RC model.
III. METHODOLOGY
The methodology, which was conducted, is briefly described as below:
A. To develop G+9 storied symmetric and asymmetric RC model
B. To collect Ground motion record. Barkot India( 1999), Uttarkashi India (1999), Panimur India(1987), Ahmedabad India (2001), Chamoli India (1999), Srinagar India (1991).
C. To perform Time history analysis using E-TABS software.
D. Building response such as story displacement, story drift and story shear are found due to the ground motions.
[image:2.612.124.491.503.726.2]E. The results of the R.C buildings are compared with respect to the varying frequency content ground motions data.
Table 3.1.Parameters for the development of G+9 storied RC frame model Sl. No. Description Remarks
1 Type of structure Residential
2 Total dimension 18.7 mX34 m
3 Number of stories 9
4 Each storey height 3.0 m
5 Dimension of columns 200x600 mm
6 Dimension of beams 200x500 mm
7 Thickness of slab 200 mm
8 Wall thickness 200 mm
9 Density of concrete 25 kN/m3
10 Grade of concrete M30
11 Grade of steel HYSD 550
12 Live load 2 kN/m2
13 Floor finish 1kN/m2
14 Seismic zone III,IV,V
Table3.2 Ground motion characteristics of selected earthquakes Frequency content Classification Station PGA (g) PGV (m/s) PGA/PGV
High Barkot India(1999) 0.01689 0.0083 2.03
Intermediate Panimur India(1987) 0.0172 0.168 1.02
Low Chamoli India(1999) 0.06228 0.0894 0..69
High Uttarkashi India(1999) 0.02222 0.0158 1.4
Intermediate Ahmedabad India(2001) 0.04095 0.0377 1.08
IV. ANALYSIS AND RESULTS
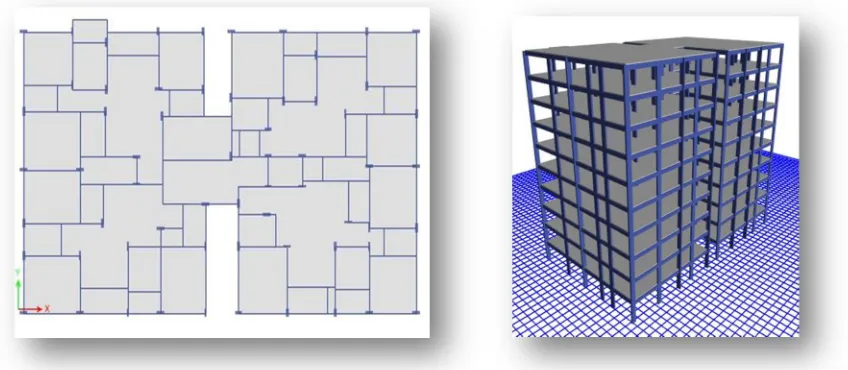
[image:3.612.95.519.124.309.2]The FEM based structural software is used for modelling and analysis of the building. The analysis is carried out using ETABS (2016) software.
Fig.1: Plan of G+9 storied RC bare frame model Fig.2: 3D View of G+9 storied RC bare frame model
[image:3.612.92.521.354.517.2]
Fig.3: Plan of G+9 storied RC irregular model Fig.4: 3D View of G+9 storied RC irregular model
V. RESULTS
A. Regular Structure
Tables 4.1,4.2and4.3 and figure 5, 6 and 7 respectively show the maximum storey displacement (i.e. at top storey) in X and Y directions, obtained for the developed G+9 storied regular RC frame model by THA containing six earthquake data
[image:3.612.199.417.636.737.2]1) Story Displacement
Table 4.1 Maximum story displacement in X and Y directions Model X Dir (mm) Y Dir (mm)
Fig.5: Maximum story displacement in X and Y directions
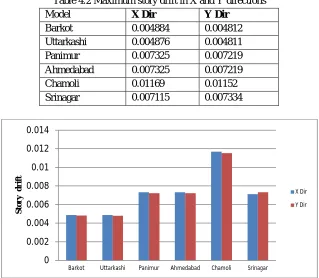
[image:4.612.147.466.288.566.2]2) Story Drift
Table 4.2 Maximum story drift in X and Y directions Model X Dir Y Dir
Barkot 0.004884 0.004812 Uttarkashi 0.004876 0.004811 Panimur 0.007325 0.007219 Ahmedabad 0.007325 0.007219 Chamoli 0.01169 0.01152 Srinagar 0.007115 0.007334
Fig.6: Maximum story drift in X and Y directions
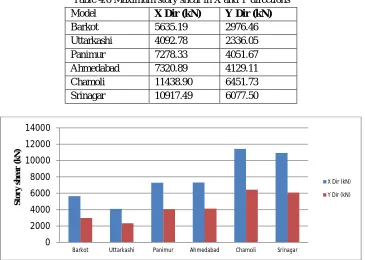
[image:4.612.187.430.629.729.2]3) Story Shear
Table 4.3 Maximum story shear in X and Y directions Model X Dir (kN) Y Dir (kN) Barkot 5635.19 2976.46 Uttarkashi 4092.78 2336.05 Panimur 7278.33 4051.67 Ahmedabad 7320.89 4129.11 Chamoli 11438.90 6451.73 Srinagar 10917.49 6077.50
0 20 40 60 80 100 120 140 160
Barkot Uttarkashi Panimur Ahmedabad Chamoli Srinagar
S
to
r
y
d
is
p
la
c
e
m
e
n
t
(m
m
)
X DIRECTION Y DIRECTION
0 0.002 0.004 0.006 0.008 0.01 0.012 0.014
Barkot Uttarkashi Panimur Ahmedabad Chamoli Srinagar
S
to
r
y
d
r
ift
Fig.7: Maximum story shear in X and Y directions
B. Irregular Structure
Tables 4.4,4.5 and 4.6 and figure 8,9 and 10 respectively show the maximum storey displacement (i.e. at top storey) in X and Y directions, obtained for the developed G+9 storied irregular RC frame model by THA containing six earthquake data.
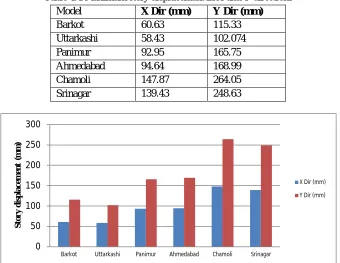
[image:5.612.138.478.301.564.2]1) Story Displacement
Table 4.4 Maximum story displacement in X and Y directions Model X Dir (mm) Y Dir (mm)
Barkot 60.63 115.33 Uttarkashi 58.43 102.074 Panimur 92.95 165.75 Ahmedabad 94.64 168.99 Chamoli 147.87 264.05 Srinagar 139.43 248.63
Fig.8: Maximum story displacement in X and Y directions
[image:5.612.191.425.619.716.2]2) Story Drift
Table 4.5 Maximum story drift in X and Y directions Model X Dir Y Dir
Barkot 0.005234 0.01483 Uttarkashi 0.00507 0.0128 Panimur 0.00127 0.00143 Ahmedabad 0.0078 0.0211 Chamoli 0.0122 0.033 Srinagar 0.0116 0.0311
0 5000 10000 15000
Barkot Uttarkashi Panimur Ahmedabad Chamoli Srinagar
S
to
r
y
s
h
e
a
r
(k
N
)
X Dir (kN) Y Dir (kN)
0 50 100 150 200 250 300
Barkot Uttarkashi Panimur Ahmedabad Chamoli Srinagar
S
to
r
y
d
is
p
la
c
e
m
e
n
t
(m
m
)
Fig.9: Maximum story displacement in X and Y directions
[image:6.612.125.490.268.528.2]3) Story Shear
Table 4.6 Maximum story shear in X and Y directions Model X Dir (kN) Y Dir (kN)
Barkot 5635.19 2976.46 Uttarkashi 4092.78 2336.05 Panimur 7278.33 4051.67 Ahmedabad 7320.89 4129.11 Chamoli 11438.90 6451.73 Srinagar 10917.49 6077.50
Fig.10: Maximum story displacement in X and Y directions
C. Final Discussion
Tables 4.7,4.8 and 4.9 and figure 11,12 and 13 respectively show the maximum storey displacement (i.e. at top storey) obtained for the developed G+9 storied regular and irregular RC frame model by THA containing six earthquake data.
[image:6.612.192.425.641.741.2]1) Story Displacement
Table 4.7 Maximum story displacement for regular and irregular structures Model Regular (mm) Irregular (mm)
Barkot 58.584 87.98 Uttarkashi 58.3615 80.25 Panimur 87.877 129.35 Ahmedabad 87.8765 131.81 Chamoli 140.24 208.46 Srinagar 112.88 197.03
0 0.005 0.01 0.015 0.02 0.025 0.03 0.035
Barkot Uttarkashi Panimur Ahmedabad Chamoli Srinagar
S
to
r
y
d
r
ift
X Dir Y Dir
0 2000 4000 6000 8000 10000 12000 14000
Barkot Uttarkashi Panimur Ahmedabad Chamoli Srinagar
S
to
r
y
s
h
e
a
r
(k
N
)
Fig.11: Maximum story displacement of regular and irregular structures
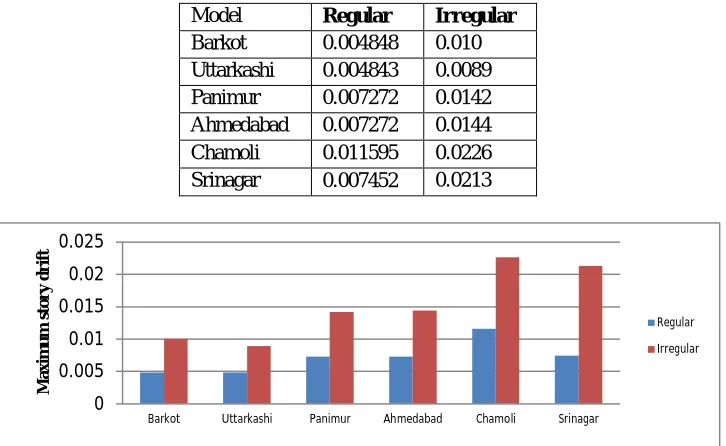
[image:7.612.127.490.228.451.2]2) Story Drift
Table 4.2 Maximum story drift for regular and irregular structures Model Regular Irregular
Barkot 0.004848 0.010 Uttarkashi 0.004843 0.0089 Panimur 0.007272 0.0142 Ahmedabad 0.007272 0.0144 Chamoli 0.011595 0.0226 Srinagar 0.007452 0.0213
Fig.13: Maximum story driftt of regular and irregular structures
[image:7.612.74.514.501.723.2]3) Story Shear
Table 4.3 Maximum story shear for regular and irregular structures Model Regular (kN) Irregular (kN)
Barkot 2148.225 4305.82 Uttarkashi 2150.48 3214.41 Panimur 3222.375 5665 Ahmedabad 3222 5725 Chamoli 5142.78 8945.31 Srinagar 4169.79 8497.49
0 100 200 300
Barkot Uttarkashi Panimur Ahmedabad Chamoli Srinagar
M a x im u m s to r y d is p la c e m e n t (m m ) Regular (mm) Irregular (mm) 0 0.005 0.01 0.015 0.02 0.025
Barkot Uttarkashi Panimur Ahmedabad Chamoli Srinagar
M a x im u m s to r y d r ift Regular Irregular 0 2000 4000 6000 8000 10000
Barkot Uttarkashi Panimur Ahmedabad Chamoli Srinagar
VI. CONCLUSION
In the present study, G+9 storied RC residential, symmetrical and asymmetrical frame is modelled using ETABS software (Version 2016). Considering seismic zone III ,IV ,V of IS 1893 (Part 1, 2002), the developed model is subjected to Time History Analysis (THA) considering the data of Barkot (1999), Uttarkashi (1999) and Panimur (1987), Ahmedabad(2001), Chamoli(1999), Srinagar(1991) are carried out to study the seismic response of the model by determining seismic parameters such as storey displacement, storey drift ratio and storey shear. From the current study on effect of frequency content on seismic performance of RC frames, following conclusions are drawn.
A. Story displacement, story drift and story shear has significant effect for low frequency content (Chamoli an555d Srinagar),on both symmetrical and asymmetrical RC buildings than the high (Barkot and Uttarkashi) and medium frequency content (Panimur and Ahmedabad).
B. The displacement in Barkot is 33%,58.22% more than Panimur and Chamoli for symmetrical structure.
C. The drift in Barkot is 12.67%, 29.57% more than Panimur and Chamoli and the shear in Barkot is 50%, 58.22% more than Panimur and Chamoli.
D. The displacement in Uttarkashi is 50%, 58.38% more than Ahmedabad and Chamoli for asymmetrical structure.
E. The drift in Uttarkashi is 61.79,60.61% more than Ahmedabad and Chamoli and the shear in Uttarkashi is 78.10%, 64% more than Ahmedabad and Chamoli.
F. In both symmetry and asymmetry, chamoli (low frequency content) shows maximum values as compare to other locations.
G. Uttarkashi (high frequency content) shows well performance when compared to other locations in both symmetry and asymmetry.
H. Story displacement, story drift and story shear are minimum in Symmetrical structure, hence it is better to consider for the future construction work.
REFERENCES
[1] A.S. Patil and P.D. Kumbhar (2013), “Time history Analysis of Multistoried RCC buildings for different seismic intensities”, International Journal of Structural and Civil Engineering Research, Vol. 2, No. 3, pp. 194–201.
[2] Farqaleet A. (2016), “Dynamic Analysis of Multi-storey RCC building”, International Journal of Innovative Research in Technology, Vol. 3, No. 3, pp. 140– 146.
[3] Kumar M.A. and Balakrishna V. (2017), “Experimental Investigation on RC Buildings of Seismic Behaviour Under Significance o Fluctuating Frequency”, International Journal of Advance Research in Science and Engineering, Vol. 6, No. 12, pp. 1311–1324.
[4] Mandloi P. and Chaturvedi R. (2017), “Seismic Analysis of Vertical Irregular Building with Time history Analysis”, IOSR Journal of Mechanical and Civil Engineering, Vol. 14, No. 4, pp. 11–18.
[5] Nagod S. and Zende A.J. (2017), “Seismic Analysis of Multistoried RC Building Due to Mass Irregularity by Time history Analysis”, International Research Journal of Engineering and Technology, Vol. 4, No. 8, pp. 621–625.
[6] T. Cakir (2013), “Evaluation of the effect of earthquake frequency content on seismic behaviour of cantiliver retaining wall including soil-structure interaction”, Soil Dynamics and Earthquake Engineering, vol. 45, pp. 96-111.
[7] Waseem Khan, Dr. Saleem Akhtar and Aslam Hussain (2014), “Non-Linear Time History Analysis of Tall Structure for Seismic Load Using Damper” (Department of Civil Engineering, University Institute of Technology, Rajiv Gandhi Proudyogiki Vishwavidyalaya, Bhopal. M.P. India)
[8] IS 875 (Part 1, 1987), “Code of Practice for Design Loads for Buildings and Structures – Part 1 : Dead Loads”, Bureau of Indian Standards, New Delhi, India. [9] IS 456 (2000), “Indian Standard Code of Practice for Plain and Reinforced concrete”, Bureau of Indian Standards, New Delhi, India.