Determination of Optimal FDM Parameters
Settings for PC/ABS Blend using Taguchi Method
Aamir M. Shaikh 1, Omkar A. Salokhe 2
1
Assistant Professor, Production Engineering Department,
2
P.G Student, K. B. P. College of Engineering, Satara, India
Abstract: This paper shows an experimental investigation on dimensional behaviour of Polycarbonate/ Acrylonitrile Butadiene Styrene (PC/ABS) blend material parts fabricated on Fused Deposition Modeling (FDM) machine. For that total 27 parts were manufactured to study effects of FDM parameters on top surface flatness error, surface roughness and part build time quality characteristics of parts. Reduction in build time and material consumption without compromising its dimensional accuracy are the major objectives of many industries, so in this work part printed without support structures. A Taguchi’s Design of experiment was used to study effect of five parameters at three levels such as layer thickness, raster width, extrusion temperature, bed temperature and printing speed on quality characteristics. Analysis of variance (ANOVA) method also used to find out significant parameters and confirmation test of experimental result were also performed to verify the optimal settings of parameters. Results of this work showed different combination of FDM process parameters for optimum quality characteristics. Keywords: FDM, PC/ABS blend material, Taguchi’s method, surface roughness, flatness, build time.
I.INTRODUCTION
The profit of production is depends upon manufacturing of quality product with less cost and time and this makes company competitive in market. So intent of all manufacturers to rapidly manufacture and deliver the customized product within a time. For these types of application Rapid Prototyping (RP) processes are suitable. RP is a type of Additive Manufacturing (AM) process, in that parts are fabricated by addition of materials in layered format. These processes were developed in the early of 1986’s for production of prototypes [1]. These processes are also called as Three Dimensional (3D) printing process, because it create any physical 3D models or object of any oddly shaped in RP machines by using Computer Aided Design (CAD) data. These processes have main four types classified according to their manufacturing process and use of raw material. At the time of introduction of 3D printing machine there was some limitation such as parts were not accurate, cost of machines were high and limited to print materials mostly uses only thermoplastic materials but now days due to advancement in printers they can print metal material also using x-rays and cost of machines also reduced. Stereolithography (SLA), Selective Laser Sintering (SLS), Laminated Object Manufacturing (LOM) and Fused Deposition Modeling (FDM) are the main types of 3D printing processes [1, 2]. In that FDM is mostly used 3D printing machine because price of machine and materials is less than other technique but limitation to print high strength materials, manufacturing of part with dimensional accuracy and surface finish etc. and this was developed in 1990’s by Stratasys Inc. [3]. So, focus of present study is to obtain optimal combinations of Fused Deposition Modeling (FDM) machine process parameters to improve surface finish and dimensional accuracy of parts.
II. LITERATURESURVEY
maximize tensile strength. Also it concluded that FDM parts can compete with conventional manufacturing processes with mechanical properties. O. A. Mohamed et al [6] performed optimization for PC-ABS blend material to increase creep strength of parts fabricated in FDM. In this work result showed creep displacement decreased when part printed with slice height at 0.2540 mm, air gap at 0mm, raster fill angle at 0º, bead width at 0.4572mm, part print direction at 200 and number of shells at 8. M. Halonen [7] this work is in injection molding process to study effect of different combination of PC/ABS on blend on mechanical properties and thermal properties of parts with variation of rubber content in ABS. Result showed different combination gives different mechanical properties like 70/30 (PC/ABS) gives high strength to the parts and increase in % of rubber content in ABS gives high impact strength. From that it is concluded that increase in percentage of PC in ABS improves mechanical properties but it effects on process ability in manufacturing of parts. Ishtiaq Ahmed et al [8] showed different FDM problems in part printing and how to solve them by adjustment of parameters settings. O. A. Mohamed et al [9] concluded storage and loss modulus of PC/ABS blend material increases as increase in layer thickness and number of contours and by decreasing in air gap, raster angle and orientation of part. Also, mechanical damping capacity of parts was increased by increasing layer thickness, road width value and decrease in part orientation. K.G. Jaya Christiyan et al [10] worked on optimization of FDM process parameters to increases tensile strength and flexural strength of ABS+hydrous magnesium silicate parts. Best result was obtained at lower layer thickness (0.2mm) and lower printing speed (30mm/s) to increase tensile and flexural strength of parts. O. A. Mohamed et al [11] showed optimum combination of FDM process parameter to increase dynamic mechanical performance of PC/ABS blend material parts using I-optimal response surface methodology. The optimum combination of parameters was layer thickness at 0.3302 mm, air gap at 0 mm, raster angle at 14.6249°, build orientation at 5.568°, road width at 0.470 mm and number of contours at 10 to increase properties. O. Luzanin et al [12] performed experimentation on Polylactic Acid (PLA) material to improve surface finish by controlling extrusion temperature and extrusion speed at three levels. At last result showed higher extrusion temperature (235°C) and lower printing speed (40mm/s) helps to increase surface finish of the parts. From above literature survey it is found that there is less work on PC/ABS blend material to study effect of layer thickness, raster width, extrusion temperature, bed temperature and printing speed combination on dimensional accuracy and on mechanical properties of the parts.
III.EXPERIMENTALDETAILS
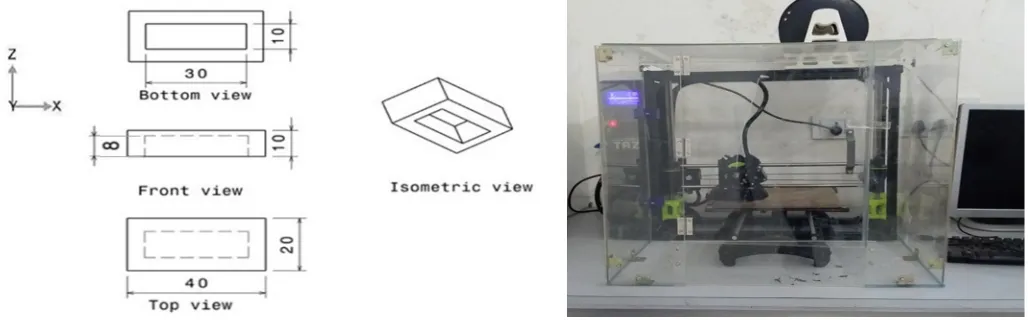
In the present work DOE was done using Taguchi optimization method in MINITAB 17 software and L27 OA were selected for this work shown in table 1. These selections of array was based on five parameters at three levels such as layer thickness (A) in mm, raster width (B) in mm, extrusion temperature (C) in 0C, bed temperature (D) in 0C and printing speed (E) in mm/sec. For that, in this study major quality characteristics examined were surface roughness (Ra) in µm, build time in sec. (BT) and flatness (F) error in mm for PC/ABS blend material. In that first, workpiece was designed in CATIA V5 CAD modeling software shown in figure. 1 and then converted into .stl (Standard Triangulation Language) file. Then Ultimkaer Cura 3.4.1 software was used to generate the tool path parameters for all the parts. First, total 8 samples were manufactured for pilot experimentation to select ranges of parameters on FDM printer, shown in figure 2 (LulzBot Taz 6) [13]. Next levels of parameters were selected according pilot reading and ranges of machine parameters settings. During manufacturing of parts build time status was recorded on computer screen. Then Surface roughness was measured (Top and side faces) on surface roughness tester (Mitutoyo, SJ210) and flatness error (Top surface) of the part measured by using CMM.
[image:2.612.49.563.557.717.2]
IV. EXPERIMENTALRESULTS
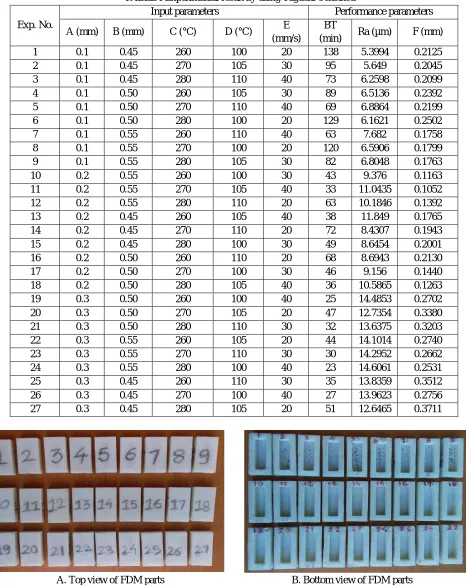
[image:3.612.72.538.135.720.2]Following Table. 1 shows experimental results of twenty seven experiments using Taguchi’s method for surface roughness, build time and flatness error of the FDM parts and figure 3 shows photograph of L27 experimental fabricated parts.
TABLE I Experimental result by using Taguchi’s method
Exp. No.
Input parameters Performance parameters
A (mm) B (mm) C (°C) D (°C) E
(mm/s)
BT
(min) Ra (µm) F (mm)
1 0.1 0.45 260 100 20 138 5.3994 0.2125
2 0.1 0.45 270 105 30 95 5.649 0.2045
3 0.1 0.45 280 110 40 73 6.2598 0.2099
4 0.1 0.50 260 105 30 89 6.5136 0.2392
5 0.1 0.50 270 110 40 69 6.8864 0.2199
6 0.1 0.50 280 100 20 129 6.1621 0.2502
7 0.1 0.55 260 110 40 63 7.682 0.1758
8 0.1 0.55 270 100 20 120 6.5906 0.1799
9 0.1 0.55 280 105 30 82 6.8048 0.1763
10 0.2 0.55 260 100 30 43 9.376 0.1163
11 0.2 0.55 270 105 40 33 11.0435 0.1052
12 0.2 0.55 280 110 20 63 10.1846 0.1392
13 0.2 0.45 260 105 40 38 11.849 0.1765
14 0.2 0.45 270 110 20 72 8.4307 0.1943
15 0.2 0.45 280 100 30 49 8.6454 0.2001
16 0.2 0.50 260 110 20 68 8.6943 0.2130
17 0.2 0.50 270 100 30 46 9.156 0.1440
18 0.2 0.50 280 105 40 36 10.5865 0.1263
19 0.3 0.50 260 100 40 25 14.4853 0.2702
20 0.3 0.50 270 105 20 47 12.7354 0.3380
21 0.3 0.50 280 110 30 32 13.6375 0.3203
22 0.3 0.55 260 105 20 44 14.1014 0.2740
23 0.3 0.55 270 110 30 30 14.2952 0.2662
24 0.3 0.55 280 100 40 23 14.6061 0.2531
25 0.3 0.45 260 110 30 35 13.8359 0.3512
26 0.3 0.45 270 100 40 27 13.9623 0.2756
27 0.3 0.45 280 105 20 51 12.6465 0.3711
[image:3.612.58.545.139.723.2]
A. ANOVA for Surface Roughness (Ra)
Effect of FDM process parameters on surface roughness for lower the better performance characteristics at different levels is shown in following figure 4. And table 2 shows ranks of parameters by using S/N ratio calculation.
Fig. 4 Main effect plot for S/N ratio of surface roughness (μm)
[image:4.612.44.285.133.305.2]Above figure. 4 shows, lower values of layer thickness (0.1mm), raster width (0.45mm), bed temperature (100°C) and printing speed (20mm/s) and medium level of extrusion temperature (270°C) was the optimum combination to reduce surface roughness of PC/ABS blend material parts. Also variation of surface roughness values was shown in above Table 1. This Table 1. shows lower roughness value was observed for experiment no. 1 with 5.3994µm and higher 14.6061µm for experiment no. 24.
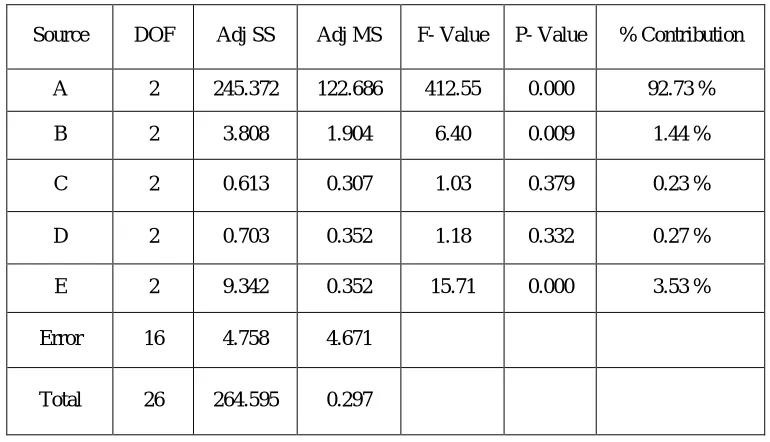
TABLE III Analysis of variance (ANOVA) for surface roughness
The significance of FDM parameters for surface roughness values was shown in Table 3. using ANOVA. This analysis was carried out with 0.05 significance level (95% of confidence level) and this shows layer thickness, printing speed and raster width were the most significant parameters of FDM for surface roughness. Also, this ANOVA table shows that, layer thickness has more percentage of contribution with 92.73% to reduce surface roughness. Because higher value of layer thickness produces stairsteps effects on side faces by increasing peaks and valley distance and this increase roughness of parts with higher printing speed and raster width. However, extrusion temperature and bed temperature shows less significant for surface roughness in this work.
0.3 0.2 0.1 -1 6
-1 7
-1 8
-1 9
-20
-21
-22
-23
0.55 0.50
0.45 260 270 280 1 00 1 05 1 10 20 30 40 A
M
e
a
n
o
f
S
N
r
a
ti
o
s
B C D E
Main Effects Plot for SN ratios
Data Means
Signal-to-noise: Smaller is better
Level A B C D E
1 -16.13 -19.12 -19.71 -19.29 -19.05
2 -19.74 -19.48 -19.43 -19.77 -19.33
3 -22.79 -20.07 -19.53 -19.61 -20.29
Delta 6.66 0.94 0.27 0.48 1.25
rank 1 3 5 4 2
Source DOF Adj SS Adj MS F- Value P- Value % Contribution
A 2 245.372 122.686 412.55 0.000 92.73 %
B 2 3.808 1.904 6.40 0.009 1.44 %
C 2 0.613 0.307 1.03 0.379 0.23 %
D 2 0.703 0.352 1.18 0.332 0.27 %
E 2 9.342 0.352 15.71 0.000 3.53 %
Error 16 4.758 4.671
[image:4.612.113.498.421.642.2]Total 26 264.595 0.297
B. ANOVA for Build time (BT)
[image:5.612.51.560.130.303.2]Effect of process parameters on build time for lower the better performance characteristics at different levels is shown in following figure 5. And Table 4 shows important parameters with the help of ranks for build time by using S/N ratio calculation.
Fig. 5 Main effect plot for S/N ratio of Build time (BT)
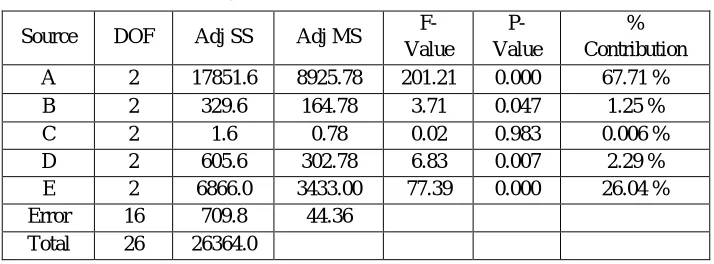
[image:5.612.52.297.134.299.2]Above figure 5. and table 4 shows layer thickness, printing speed, bed temperature and raster width were the most significant parameters to reduce build time. In that part build time was more significantly influenced by changing the layer thickness from 0.1mm to 0.3mm, raster width from 0.45mm to 0.55mm and printing speed from 20mm/s to 40mm/s but this affected on to increase surface roughness values shown in above table 1. Table 1. shows lower build time was observed for experiment no. 24 with 23min and higher part build time 138 min for experiment no. 1. ANOVA for build time was shown in following table 5 with 0.05 significance value. This shows layer thickness and printing speed has a more percentage of contribution with 67.70%, 26.04% respectively of FDM parameters to reduce build time of parts. From figure 5 and table 4 optimum combination obtained for minimum build time at higher values of layer thickness at 0.3mm, raster width at 0.55mm, extrusion temperature at 280°C, printing speed 40mm/s and lower value of bed temperature 100°C.
TABLE V Analysis of variance (ANOVA) for Build time (min)
C. ANOVA for Flatness (F)
Following figure 6. shows of main effects plot for S/N ratio for flatness error with lower the better quality characteristics. This graphs shows optimum combination of FDM parameters for minimum flatness error with layer thickness at 0.2mm, raster width at 0.55mm, extrusion temperature 270°C, bed temperature 100°C and printing speed at 40mm/s. Also table 7 shows layer thickness, raster width, printing speed parameters were the most significant with 74.55%, 5.53% and 12.87% contribution respectively to increase flatness of overhang structure. And table 6 shows importance of parameters by rank 1st, 2nd and 3rd to layer thickness, raster width and printing speed respectively to maintain flatness of overhang structure.
0.3 0.2 0.1 -30 -31 -32 -33 -34 -35 -36 -37 -38 -39
0.55 0.50
0.45 260 270 280 100 105 1 10 20 30 40
A
M
e
a
n
o
f
S
N
r
a
ti
o
s
B C D E
Main Effects Plot for SN ratios
Data Means
Signal-to-noise: Smaller is better
Level A B C D E
1
-39.27 -35.09 -34.49 -34.46 -37.43
2
-33.62 -34.50 -34.48 -34.49 -34.12
3
-30.53 -33.84 -34.46 -34.48 -31.88
Delta 8.74 1.26 0.03 0.03 5.54
rank 1 3 4 5 2
Source DOF Adj SS Adj MS F-
Value
P- Value
% Contribution
A 2 17851.6 8925.78 201.21 0.000 67.71 %
B 2 329.6 164.78 3.71 0.047 1.25 %
C 2 1.6 0.78 0.02 0.983 0.006 %
D 2 605.6 302.78 6.83 0.007 2.29 %
E 2 6866.0 3433.00 77.39 0.000 26.04 %
Error 16 709.8 44.36
Total 26 26364.0
[image:5.612.128.485.474.606.2]Fig. 6 Main effect plot for S/N ratio of Flatness (mm)
TABLE VII Analysis of variance for Flatness error
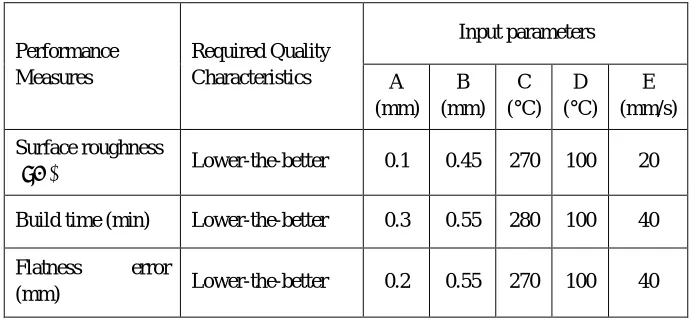
Part printed with 0.1 mm layer thickness were failed to print some initial layers where support structure was not present so this effected on separation of raster in initial layers and this caused to increase flatness error and surface roughness of top surface. But side face roughness values were less than 0.2mm and 0.3mm layer thickness. Following table 8 shows optimal combination of FDM parameters for Ra, BT and F from figure 4, figure 5 and figure 6.
ABLE VIII Optimum parametric combinations for PC-ABS blend material
Performance Measures
Required Quality Characteristics
Input parameters
A (mm)
B (mm)
C (°C)
D (°C)
E (mm/s)
Surface roughness
(μm) Lower-the-better 0.1 0.45 270 100 20
Build time (min) Lower-the-better 0.3 0.55 280 100 40
Flatness error
(mm) Lower-the-better 0.2 0.55 270 100 40
0.3 0.2 0.1 1 7
1 6
1 5
1 4
1 3
1 2
1 1
1 0
0.55 0.50
0.45 260 270 280 100 1 05 110 20 30 40
A
M
e
a
n
o
f
S
N
r
a
ti
o
s
B C D E
Main Effects Plot for SN ratios
Data Means
Signal-to-noise: Smaller is better
Level A B C D E
1 13.72 12.55 13.32 13.82 12.72
2 16.32 12.95 13.84 13.68 13.47
3 10.47 15.01 13.35 13.01 14.32
Delta 5.85 2.46 0.52 0.81 1.61
Rank 1 2 5 4 3
Source DOF Adj SS Adj MS F-
Value P- Value % Contribution
A 2 0.097520 0.048760 123.52 0.000 74.55 %
B 2 0.016840 0.008420 21.33 0.000 12.87 %
C 2 0.000914 0.000457 1.16 0.339 0.69 %
D 2 0.001979 0.000989 2.51 0.113 1.51 %
E 2 0.007237 0.003619 9.17 0.002 5.53 %
Error 16 0.006316 0.000395
[image:6.612.126.490.287.475.2]Total 26 0.130805
[image:6.612.133.478.566.727.2]V. CONCLUSIONS
In this research, optimization were done on FDM machine to improve dimensional accuracy of PC/ABS material parts using Taguchi’s and ANOVA methods. For that, part printed without support structure to study how to maintain top surface flatness where support structure were not present by proper settings of parameters with lower surface roughness and build time of parts. From above experimentation results following conclusions are obtained
A. The minimum surface roughness value 5.3994µm was obtained with combination of lower values of layer thickness (0.1mm), raster width (0.45mm), bed temperature (100°C), printing speed (20mm/s) and medium level of extrusion temperature (270°C). ANOVA results from table 3. and S/N ratio graph from fig. 4 shows that increase in layer thickness from 0.1mm to 0.3mm, raster width 0.45mm to 0.55mm and printing speed from 20mm/s to 40mm/s were the most significantly effects on to increase surface roughness values with 92.73% and 3.53% respectively contribution in surface roughness.
B. In the case of flatness error of overhang structure, fig. 6 shows minimum flatness error 0.1052mm was obtained for combination of layer thickness at 0.2mm, raster width at 0.55mm, extrusion temperature at 270°C, bed temperature at 100°C and printing speed at 40mm/s. In this it is observed that initial layers of part printed with 0.1mm layer thickness failed to print initial layers so this effected on to increase flatness error as well as roughness values. ANOVA table 7 of flatness error shows layer thickness, raster width and printing speed were the most significant parameters for maintain flatness with contribution of 74.55%, 12.87% and 5.53% respectively.
C. Optimum combination for build time was obtained from figure 5 and table 4 at higher values of layer thickness 0.3mm, raster width 0.5mm, printing speed 40mm/s, extrusion temperature 280°C and lower value of bed temperature 100°C. And ANOVA table 5 for build time shows that layer thickness, raster width, printing speed and bed temperature were the most significant parameters to reduce build time of the parts.
D. But part printed with optimal combination for build time shows worst results in case of surface roughness values so it shows that there is need to use multi-objective optimization which gives optimal combination for multi-pal responses.
E. In last confirmation of optimal combination of FDM parameters for different quality characteristics were also performed for validation of results and results shows reduction in surface roughness value with 5.2161µm and flatness error value 0.0809mm. Also part printed in this study saved material and build time for support structure.
REFERENCES
[1] Mr. Vishal Chahare, Saurabh M. Patil, Sourabh V. Patil, “3 D Printing: Techniques and Applications”,IJRASET, Vol. 5, pp.1314-1317, 2017.
[2] Jaiganesh. V., Andrew Anthony christopher, Mugilan, “Manufacturing of PMMA Cam shaft by Rapid Prototyping”, Procedia Engineering, Vol. 97, pp.
2127-2135, 2014.
[3] Omar Ahmed Mohamed, Syed Hasan Masood, Jahar Lal Bhowmik, “Mathematical modeling and FDM process parameters optimization using response
surface methodology based on Q-optimal design”, Applied Mathematical Modeling 40, pp. 10052-10073, 2016.
[4] K. Thrimurthulu, Pulak M. Pandey, N. Venkata Reddy, “optimum part deposition orientation in fused deposition modeling”, International Journal of Machine
Tool and Manufacture 44, pp. 585-594, 2004.
[5] O. S. Carneiro, A. F. Silva, R. Gomes, “Fused deposition modeling with polypropylene”, Materials and design 83, pp. 768-776, 2015.
[6] Omar Ahmed Mohamed, Syed Hasan Masood, Jahar Lal Bhowmik, “Experimental investigation of time-dependent mechanical properties of PC-ABS
prototypes processed by FDM additive manufacturing process”, Materials Letters, 2017.
[7] Mikko. Halonen, “A Study About PC/ABS Blends”, Aalto University, Mechanical Engineering Spring, 2016.
[8] Ishtiaq Ahmed, Mohammed Shoaib Shariff, M Syed Ismail Zeeshan, Prashanth S, “Troubleshooting for FDM Technology”, IJRASET, Vol. 6, pp.986-990,
2018.
[9] Omar Ahmed Mohamed, Syed Hasan Masood, Jahar Lal Bhowmik, Mostafa Nikzad, Jalal Azadmanjiri “Effect of Process Parameters on Dynamic Mechanical
Performance of FDM PCABS Printed Parts Through Design of Experiment”, Journal of Materials Engineering and Performance, 2016.
[10] K. G. Jaya Christiyan, U. Chandrasekhar, K. Venkateswarlu, “A study on the influence of process parameters on the Mechanical Properties of 3D printed ABS
composite”, IOP conference series Materials Science and Engineering 114, 2016.
[11] Omar Ahmed Mohamed, Syed Hasan Masood, Jahar Lal Bhowmik, “Characterization and dynamic mechanical analysis of PC-ABS material processed by
fused deposition modelling: An investigation through I-optimal response surface methodology”, Measurement, 2017.
[12] O. Luzanin, D. Movrin, M. Plancak, “Experimental investigation of Extrusion speed and Temperature on Arithmetic mean Surface roughness in FDM built
specimens”, Journal for Technology of Plasticity, Vol. 38, pp. 179-189, 2013.
[13] Omkar A. Salokhe, Aamir M. Shaikh, “Study of Fused Deposition Modeling Process Parameters for Polycarbonate/Acrylonitrile Butadiene Styrene Blend