1 RUNNING HEAD: Computer-assisted intervention
Cluster Randomized Controlled Trial Evaluating the Effectiveness of Computer-Assisted Intervention Delivered by Educators for Children with Speech Sound Disorders
Sharynne McLeod
Charles Sturt University, Australia Elise Baker
The University of Sydney, Australia Jane McCormack
Charles Sturt University, Australia Yvonne Wren
Bristol Speech and Language Therapy Research Unit, UK University of Bristol, Bristol, UK
Sue Roulstone
Bristol Speech and Language Therapy Research Unit, UK University of the West of England, UK
Kathryn Crowe Sarah Masso
Charles Sturt University, Australia Paul White
University of the West of England, UK Charlotte Howland
2 Correspondence:
Professor Sharynne McLeod, Ph.D.,
School of Teacher Education, Charles Sturt University Panorama Avenue, Bathurst, NSW AUSTRALIA, 2795 Email: [email protected]
3
Abstract
Purpose: To evaluate the effectiveness of computer-assisted input-based intervention for children with speech sound disorders (SSD).
Method: The Sound Start Study was a cluster randomized controlled trial. Seventy-nine early childhood centers were invited to participate, 45 were recruited, and 1,205 4- to 5-year-old children’s parents/educators returned questionnaires. Children whose parents/educators had concerns about speech were assessed (n=275); 132 children who were identified with
phonological impairment of unknown origin underwent additional assessment. Children with SSD and no receptive language or hearing difficulties, typical non-verbal intelligence, and English as their primary language were eligible; 123 were randomized (Intervention n=65; Control n=58); 3 withdrew. Intervention involved Phoneme Factory Sound Sorter software administered by educators over 9 weeks; Control involved typical classroom practices.
Participants were re-assessed twice by a speech-language pathologist (SLP) blinded to the initial assessment and intervention conditions.
Results: For the primary outcome variable (percentage of consonants correct), the significant mean change from pre- to post-intervention for the Intervention group (mean change+6.15,
p<.001) was comparable in magnitude to the significant change for the Control group (mean change+5.43, p<.001) with a small between groups effect size for change (Cohen’s d=0.08). Similar results occurred for measures of emergent literacy, phonological processing,
participation, and wellbeing.
4
5
Cluster Randomized Controlled Trial Evaluating the Effectiveness of Computer-Assisted
Intervention for Children with Speech Sound Disorders
There is a high prevalence of speech sound disorders (SSD) in young children (Eadie et al., 2014; Law, Boyle, Harris, Harkness, & Nye, 2000; Wren, Miller, Peters, Emond, &
Roulstone, 2016) and a high number of children with SSD on speech-language pathologists’ (SLPs’) caseloads (e.g., Broomfield & Dodd, 2004). Accordingly, there are many interventions for SSD that are supported by research evidence (see Baker & McLeod, 2011 for a review). However, within real service contexts, the frequency and total number of intervention sessions provided can be limited by available resources (McAllister, McCormack, McLeod, & Harrison, 2011; McCormack & Verdon, 2015; Ruggero, McCabe, Ballard & Munro, 2012) and service delivery provisions (McLeod & Baker, 2014). For instance, despite evidence that children with SSD can require approximately 30 to 40 hours of intervention by SLPs to become intelligible (Hodson, 2007; Williams, 2012), children have been reported to receive an average of 6.2 hours of intervention over 12 months (Glogowska, Roulstone, Enderby, & Peters, 2000) or even less (Ruggero et al., 2012).
6
interventions, the outcomes have not always been ideal. Law, Garrett and Nye (2003/2010) in a meta-analysis of interventions for expressive phonology found that intervention conditions were associated with better child progress in phonology than control conditions. However, when parent-administered interventions were removed from the analysis, the effect size increased suggesting that parent-administered interventions produced less impact on children’s speech. For instance, Lancaster et al. (2010) compared SLP- and parent-delivered intervention with no intervention for 15 preschool children with SSD. The preschool children who received the SLP-delivered intervention made the most improvement. It was unclear whether this improvement was due to the difference in the intervention agent (SLP versus parent) or the difference in the intervention, as the SLPs delivered their own “eclectic” intervention involving speech production practice, auditory tasks, and phonological awareness while the parents implemented “auditory input and bombardment activities that related to their child’s error patterns” (Lancaster et al., 2010, p. 187). Dodd and Barker (1990) examined parent- and teacher-delivered minimal pair intervention for 11 preschool children with SSD. Although an improvement was detected for both the parent- and teacher-implemented intervention, the improvement was described as limited for the children receiving the teacher-delivered intervention. Two barriers to implementation were identified—lack of time and intervention agent capability. Dodd and Barker (1990) noted that despite the teachers receiving approximately 24 hours of extensive training, the training did not yield competence similar to SLP-delivered intervention. One way to circumvent this barrier is to make the intervention simpler and easier to implement through the use of computer technology.
7
effective. Unlike inexperienced intervention agents, computers can be programed to provide accurate and consistent feedback, thus circumventing barriers to implementation noted by Dodd and Barker (1990). Ruscello et al. (1993) discovered this to be the case when they found that computer-based minimal pairs intervention delivered by a parent, was just as effective as direct speech-language pathology intervention at improving the children’s speech. This study was small (12 participants), and the parents needed to attended the speech-language pathology clinic in order to access the computer program to provide the intervention. Given that the time spent training parents benefits their children, it would seem advantageous to train educators as they could expand their knowledge and skills to more children (Dodd & Barker, 1990). However, it is unknown whether computer-based intervention delivered by educators in a preschool setting would yield similar positive results to that delivered by parents. It is also unknown whether such an intervention could help prepare preschool children with SSD for future literacy instruction. This idea has appeal, because children with SSD are at risk of literacy difficulties (Anthony et al., 2011).
Models of language processing have typically identified a common pathway between speech and literacy development (Duggirala & Dodd, 1991; Kay, Lesser & Coltheart, 1992; Stackhouse & Wells, 1997) which helps explain why difficulties in these two areas commonly co-exist. What is less clear is whether differing presentations or subtypes of SSD can be
identified which have distinct pathways and require different interventions. Waring and Knight (2013) identified three approaches to classification of SSD based on etiology (Shriberg et al., 2010), linguistics (Dodd, 2013) and processing skills (Stackhouse & Wells, 1997). Each approach offers alternate ways of conceptualising SSD and identifying approaches to
8
categorical subtypes, Stackhouse and Wells (1997) proposed a system which links a plausible underlying processing cause with speech output. Specifically, they propose three core elements: input processes (i.e., detecting and perceiving speech or seeing a written word/letter); cognitive-linguistic processes (i.e., creating, storing, and accessing lexical representations for words comprising semantic, phonological, grammatical, orthographic, and/or motor information); and output processes (i.e., producing speech or writing a word or letter). Some children with
9
small group session over an average of 25.5 hours. Three of the 12 children also needed an additional 10 to 12 hours of intervention to improve their intelligibility.
A computer-based intervention program designed to target the input processing and phonological awareness skills of children with SSD is Phoneme Factory Sound Sorter® (PFSS) (Wren & Roulstone, 2006, 2013). PFSS comprises seven interactive games that can be
10
Wren and Roulstone (2008) compared the effect of 12 hours of an experimental version of PFSS with conventional table-top intervention (targeting input processing and phonological awareness) and no intervention (n = 33, with 11 randomly assigned to each of three groups: computer-based PFSS, conventional table-top intervention, and no intervention). Participants received three sessions a week over 8 weeks, each session lasting 30 minutes. One session a week was delivered by the SLP with a teaching assistant observing. The teaching assistant then delivered the other two sessions each week. The free configuration settings were used rather than the teacher settings, allowing the SLP to select the most appropriate targets and stimuli for each child from session to session. Wren and Roulstone (2008) discovered that although there was not a statistically significant difference between the groups, the preschool children who received the PFSS intervention showed a trend towards more improvement compared to the children in the control group. This occurred when the children were stimulable for the target sounds prior to intervention and showed developmental rather than non-developmental error patterns. As these were the same processes targeted via the pre-set teaching settings, it was hypothesized that the same results could perhaps be achieved with the tool being delivered by non-SLPs. The effect of the intervention on the children’s emergent literacy skills (i.e., phonological awareness and print knowledge), and phonological processing (i.e., ability to rapidly retrieve stored words from memory, and recall information) was not measured. The potential for intervention to indirectly address the impact of SSD on children’s everyday wellbeing (i.e., activity and participation) was also not considered.
11
implemented simply and easily, the teacher settings (rather than free configuration setting) would need to be used and children with developmental rather than non-developmental phonological error patterns selected. In light of research examining the effect of intervention intensity for children with SSD (Allen, 2013; Williams, 2012), PFSS would also need to be implemented with an adequate and feasible intensity, including dose, session frequency, and total intervention duration (Baker, 2012; Warren, Fey, & Yoder, 2007).
There is no clear answer as to what constitutes adequate and feasible intensity in intervention for children with SSD. The majority of peer reviewed published intervention research (94% of 134 studies) for children with SSD reported intervention outcomes for a pre-determined period of time rather than from referral to dismissal (Baker & McLeod, 2011). This is often because of constraints within a research context such as the time and funds available to conduct intervention research. This creates a challenge—conducting experimental research within the confines of a budget, with a feasible session dose, duration, and frequency for a period of time sufficient to demonstrate a clinically significant effect. Across a selection of peer
reviewed published intervention studies involving children with SSD using pre-determine time periods and a robust RCT design, positive effects have been reported for 30-minute sessions scheduled three times weekly over 8 weeks (i.e., 24 sessions) (Allen, 2013), 12 weekly 30-minute sessions (Dodd et al., 2008), and 16 twice weekly 1 hour sessions over 8 weeks (Ruscello et al., 1993). Together, these studies suggest that twice weekly 60 minute sessions (or four 30 minute sessions each week) over approximately 8 to 12 weeks may be sufficient to demonstrate an effect in a research context.
12
The aim of the Sound Start Study was to evaluate the effectiveness of PFSS delivered by educators (using the teacher settings) compared with typical classroom practices on the speech production, emergent literacy, phonological processing, and participation and wellbeing of 4- to 5-year-old children with phonologically-based SSD.
METHOD
Participant Recruitment and Eligibility
Seventy-nine early childhood education centers in Sydney, Australia were invited to be involved in the Sound Start Study between 2013 and 2015 and 45 early childhood centers were recruited1. Early childhood centers were identified by geographical location (postcode) in order to obtain a sample of children living in range of socio-economic advantage and disadvantage. Private (n = 7), community (n = 9), government-funded (n = 24), and local council-funded (n = 5) early childhood education centers were included in the sample. Directors of the early
childhood education centers agreeing to participate in the study were asked to distribute
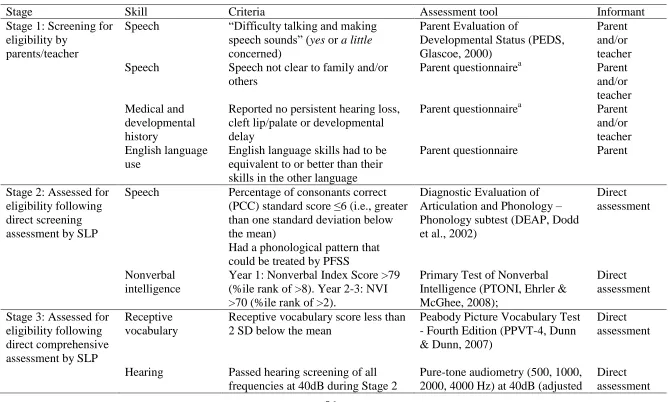
screening questionnaires to parents of all 4- to 5-year-old children within their center (n = 1,920). The Sound Start Study was undertaken in six stages with recruitment occurring over three years (Figure 1). Eleven sites participated during more than one year. In stage 1 parent and educator screening questionnaires were returned for 1,205 4- to 5-year-old children attending one of the 45 early childhood centers. In stage 2, 275 children whose parents and/or educators were concerned about how they “talked and made speech sounds” (Glascoe, 2000) were directly assessed to screen their eligibility for the trial. In stage 3, 132 eligible children received a more comprehensive assessment. Data from stages 2 and 3 were gathered pre-intervention and served
1
13
as baseline measures. At the end of stage 3, there were 123 children at 39 sites who were eligible for intervention in stage 4. The early childhood education centers with eligible children were randomized to the Intervention (n = 19 sites, 65 children) or Control (n = 20 sites, 58 children) conditions. Computerized intervention using PFSS was provided to 63 eligible children in the intervention condition. Fifty-seven children received the control condition of typical classroom practices. That is, they continued to participate in their classroom environment as usual without any input from the researchers. Three children withdrew from the study. In stage 5, immediate follow-up assessments were undertaken with 113 children. In stage 6, long-term follow-up assessments were conducted with 114 children, 6-8 weeks later. Data from stages 5 and 6 were gathered post-intervention and served as outcome measures. All direct assessments (pre- and post-intervention) were completed in a quiet room within the early childhood centers except nine stage 6 (year 1) assessments that were completed at the child’s home during the school holidays due to the children’s availability. This paper reports data from stages 1 to 6 (screening, baseline, intervention, and outcome), with a particular emphasis on the baseline (stages 2-3), intervention (stage 4), and outcome measures (stages 5-6). Some data regarding stage 1 are reported in McLeod et al. (2015) and stages 2 and 3 in McLeod et al. (2017).
14
nonverbal intelligence2, oromusculature, hearing, and receptive language during direct
assessment. Children who spoke languages in addition to English were included; however, their English language skills had to be equivalent to or better than their skills in the other language(s).
Participants in the Randomized Controlled Trial
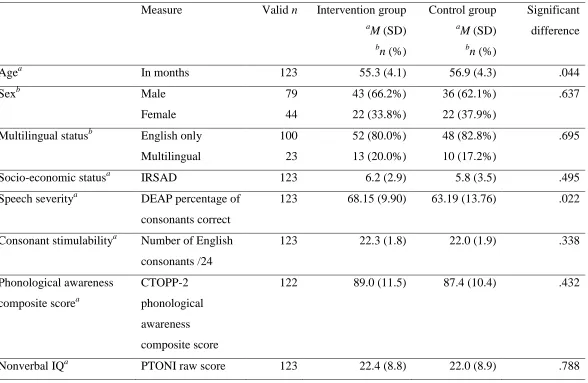
Participants in the randomized controlled trial were 123 children who were eligible for intervention in stage 4 of the Sound Start Study. The participants ranged in age from 4;0 to 5;4 (M = 54.89 months; SD = 4.2) when they were assessed at stage 3 (see Table 2). There were more males (n = 79, 64.2%) than females (n = 44, 35.8%). The participants lived in a range of suburbs from the most disadvantaged (1st decile) to most advantaged (10th decile) according to the Australian Index of Relative Socioeconomic Advantage and Disadvantage (IRSAD,
Australian Bureau of Statistics, ABS, 2008) that considers “people’s access to material and social resources, and their ability to participate in society” (ABS, 2008, p. 17). The mean IRSAD decile of participants was 5.97 (SD = 3.2) and mode of 8 (25th percentile = 3, 50th percentile = 7, 75th percentile = 8). Information about family IRSAD was available for all participants. The majority of participants (n = 114) were reported to use English at home (107 spoke English only at home and seven spoke English and an additional language at home). Nine participants spoke a language other than English at home. The parents of most (n = 120) of the participants described their child’s English language proficiency. The majority were described by their parents as using English “very well” (n = 64, 52.0%), with fewer parents reporting “somewhat well” (n = 48, 39%), or “not very well” (n = 8, 6.5%). According to their parents, the participants spoke one (n
= 100, 81.3%), two (n = 21, 17.1%), or three (n = 2, 1.6%) languages with 17 languages reported
2
15
in total. The languages in addition to English were: Arabic, Cantonese, Filipino, Greek, Hindi, Indonesian, Korean, Malayalam, Maltese, Marathi, Portuguese, Punjabi, Spanish, Tamil, Thai and Urdu.
Instruments
Questionnaires for parents.
Parents were asked to complete questionnaires created by the research team at each stage of the research. The questionnaires focused on different areas including parental concern about their children’s development, demographic information, languages spoken, developmental history, family history of speech and language difficulties, home literacy, home computer use, reading skills, and communication skills. The questionnaires included questions created by the researchers as well as questions from previously published scales that were included after gaining permission from the authors (e.g., Parents Evaluation of Developmental Status, PEDS, Glascoe, 2000). Typically questions were asked once; however, some key questions were repeated at different stages. For example, at each stage parents were asked to provide information regarding previous and current speech-language pathology assessment and intervention (in addition to the intervention received during the Sound Start Study).
Questionnaires for directors and educators at the early childhood education centers
Directors of all participating centers completed a 22-item questionnaire that focused on different aspects of the environment, staffing and use of resources at their center. Directors were asked to describe the number of qualified staff and teaching assistants at the center each day, the organisational basis for the center, parent engagement practices, daily activities, and access, use, and attitudes towards technology at the center.
16
Baseline measures from stages 2 and 3 and outcome measures from stages 5 and 6 are described below (see McLeod et al., 2017 for the complete assessment protocol). The stage when assessments were administered is shown in Tables 3 and 4. Each outcome measure pertains to the individual participant level.
Speech production instruments.
The participants’ speech production was assessed using four measures: (1) the Phonology subtest from the Diagnostic Evaluation of Articulation and Phonology (DEAP, Dodd, Hua, Crosbie, Holm, & Ozanne, 2002), (2) phonological probes created by the research team, (3) Intelligibility in Context Scale(ICS, McLeod, Harrison, & McCormack, 2012a), and (4) stimulability for each English consonant. The DEAP Phonology subtest (Dodd et al., 2002) enabled comprehensive sampling of a broad range of phonemes (consonants, vowels, and consonant clusters) in a range of contexts and syllable shapes, and provided normative data for Australian and British children. Each participant’s responses to items on the DEAP were entered into Computerized Profiling (PROPH+; Long, Fey, & Channell, 2008). The percentage of
17
(McLeod, Crowe, & Shahaeian, 2015; McLeod, Harrison, & McCormack, 2012b). Consonant stimulability was assessed by asking participants to produce consonants in isolation after a model from the SLP with subsequent prompting if necessary. A score was generated regarding the number of stimulable consonants out of a possible total of 24.
Emergent literacy instruments.
18
initial and final sounds). The CTOPP-2 has been validated and normed in the US on 1,900 children.
Phonological processing instrument.
Individual subtests from the CTOPP-2 (Wagner et al., 2013) were used to examine participants’ phonological processing and skills: the three subtests also used to measure
phonological awareness (described above), Elision, Blending Words, and Sound Matching; two subtests of phonological memory, Memory for Digits (repeating numbers accurately), and Nonword Repetition (repeating nonwords accurately); and two subtests of rapid non-symbolic naming, Rapid Color Naming (rapidly naming colors) and Rapid Object Naming (rapidly naming objects).
Children’s participation and wellbeing instruments.
Children’s participation and wellbeing was considered using four measures: (1) Focus on the Outcomes of Children Under Six (FOCUS, Thomas-Stonell, Robertson, Walker, Oddson, Washington, & Rosenbaum, 2012), (2) Kiddy-Communication and Attitude Test (KiddyCAT; Vanryckeghem & Brutten, 2007), (3) Speech Participation and Activity Assessment of Children (SPAA-C, McLeod, 2004), and (4) Australian Therapy Outcome Measures for Speech Pathology (AusTOMs, Perry & Skeat, 2004). The FOCUS (Thomas-Stonell et al., 2012) enabled
measurement of changes in participants’ participation in communicative contexts. The 50-item parent-report measure was used to consider participants’ function (speech, expressive language, pragmatics, receptive language/attention) and performance (intelligibility, expressive language, social/play, independence, coping strategies/emotions) and has been validated on 210 children in Canada (Thomas-Stonell, Oddson, Robertson, & Rosenbaum, 2010). The KiddyCAT
19
their speech ability and difficulties they had with talking. The KiddyCAT comprises 12 yes/no questions, including “Is talking hard for you?” and “Do you think that people need to help you talk?” The KiddyCAT has been standardized for children aged 3-6 years and has been used with a variety of clinical populations including children with SSD (McLeod, Harrison, McAllister, & McCormack, 2013). Ten questions from the SPAA-C (McLeod, 2004) were administered to consider participants’ feelings about talking in different communicative situations (e.g., How do you feel when you talk to the whole class?). Children were asked to color the face that best matched their response from the following options: ? O (another feeling). The total number of responses were added to calculate a score out of a possible total of 10. To date, the SPAA-C has not been normed or validated. The AusTOMs (Perry & Skeat, 2004) were
completed by the SLP to describe participants’ speech impairment, activity limitation, participation restriction, and distress on a 6-point scale ranging from 5 = no difficulty to 0 =
profound difficulty. Face and content validity of the AusTOMs was established by Perry and colleagues (2004) and the inter-rater and test-retest reliability of the tool was found to be “mostly satisfactory” (Morris et al., 2005, p. 344).
Intervention instrument: Phoneme Factory Sound Sorter
The original British version of PFSS (Wren & Roulstone, 2006) was adapted for
20
Trial Design
The Sound Start Study was a blinded cluster randomized controlled trial in which children’s progress with the PFSS (Wren & Roulstone, 2013) completed using pre-set teacher settings with early childhood educators was compared with a group of similar size who received typical classroom practices (i.e., whatever the child would typically receive). Early childhood education centers were randomized to receive one of the two types of service delivery. The allocation of participants within clusters (sites) provided protection from contamination across trial arms and also increased the convenience of delivering the intervention within community settings.
21
assessments were completed by four experienced SLPs (including SLP1 and SLP2). The SLPs were blinded to the intervention condition when undertaking the post-intervention assessments (SLP1 and SLP2 did not re-assess children from their allocated pre-intervention sites).
Procedure
Ethical approval was gained from Charles Sturt University (Approval number 2013/070), the NSW Department of Education and Communities State Education Research Applications Process (SERAP) (Approval number 2013267), and individual early childhood centers as required. Consent was gained from the directors, teachers, and teaching assistants at the early childhood education centers and the participants’ parents/caregivers and assent was gained from the participants at each stage of the study.
Stage 1: Screening for eligibility
The Sound Start Study was conducted in six stages (Figure 1). During stage 1 1,205 parents completed a 2-page screening questionnaire containing questions about their children’s speech, language, and general development. Teachers subsequently completed the same
screening questionnaire for children whose parents consented to participate. Children who met inclusion criteria for stage 2 (n = 323) were invited to participate in a direct assessment of their speech and language skills.
Stages 2 and 3: Direct screening and comprehensive assessments
The parents of a total of 275 participants provided consent for participation in the direct screening assessment phase of the study (see Table 1). Assessments were completed with one of two experienced SLPs in a quiet room within each participant’s early childhood education center once assent had been obtained from the child. Stage 2 and stage 3 assessments took
22
Video and/or audio recording was completed for tasks using a Panasonic HC-V700 video camera with an external Hahnel Mk100 uni-directional microphone, and Zoom H1 audio recorder. Online broad phonetic transcription of the DEAP (Dodd et al., 2002) was completed by the assessing SLP and later checked by the same SLP for accuracy based on the audio recording. The AusTOMs measure was completed during, or immediately after, each assessment.
Parents were given a questionnaire to complete before each assessment stage and were asked to return the questionnaire to their early childhood education center. After administration of the DEAP in stage 2, a member of the research team (second author) determined which phonological probes should be administered in stage 3 to each participant based on their patterns of errors on the DEAP. For example, if a participant produced /s/ as [t] and /f/ as [p] then the stopping probe was selected. Participants’ results on the probes then were used by the second author to determine the primary and secondary PFSS teacher settings to be used in the
intervention phase. A primary and secondary intervention goal corresponding to a PFSS teacher setting was allocated to each participant who was eligible for stage 4 (Intervention and Control) before allocation of the participants’ intervention condition.
Stage 4:Intervention
23
Intervention was individualized for each child using the preset teacher settings in PFSS based on the identified phonological error patterns present during pre-intervention assessment (stage 2). The allocation of 18 hours of intervention with PFSS was considered appropriate with respect to intervention literature (Baker, 2012; Williams, 2012) and feasible within a 10 week preschool term, as PFSS could be provided over first nine weeks of term (4 x 30 min or 2 x 60 min/week) allowing the 10th week to conduct an immediate post-treatment evaluation. The participants and educators wore headphones to listen to the PFSS program. The activities in PFSS required the participants to listen and look at stimuli and respond in various ways using the computer mouse. When participants were not proficient at using the mouse, the educators moved it to the location on the screen indicated by the participants’ pointing.
The first intervention session was overseen by the SLP who undertook their stage 1-3 assessments to standardize delivery and solve any technical difficulties that arose. The same SLP monitored and videoed intervention in weeks 2-3 and 7-9 to ensure fidelity. The educators recorded the number of sessions completed (on paper). In addition, the PFSS program recorded the total number of games, total number of plays, total time spent on each game, and the score achieved (/10) for each game. Children in both conditions were allowed to attend additional speech-language pathology if organized by their parents or educators, and known attendance is noted in Figure 1.
Standard care consisted of typical classroom practice. All sites were asked to document their typical daily activities in a center questionnaire.
Stages 5 and 6: Immediate and long-term follow-up assessments
24
102, 89.5%) with two other experienced SLPs completing a small proportion of the assessment in stage 5 (n = 24, 21.2%) and stage 6 (n = 12, 10.5%) in the final year of data collection. All SLPs were blinded to the information about the pre-intervention assessments (stages 1-3) and trial arm (stage 4) for the participants they assessed during stages 5 and 6. The post-intervention assessments followed a similar protocol to the pre-intervention assessments in that they took place in a quiet room in the early childhood education center that the participants attended, with the consent of parents and the assent of child participants. The assessments took approximately 60 minutes to complete. All assessment sessions were video-recorded and audio-recorded. Broad transcription of the DEAP (Dodd et al., 2002) was completed online where possible.
Reliability
Inter- and intra-judge point-by-point reliability was completed for the DEAP-Phonology based on a randomly selected sample of 30 (10.9% of 275 participants) speech samples
comprising 6,629 data points. Intra-judge agreement for broad phonetic transcription was 91.5% and inter-judge agreement was 90.1%. The reported level of reliability reflects “acceptable agreement” as it was >85% (Shriberg & Lof, 1991, p. 255).
Intervention Fidelity
Fidelity checking was based on video samples that included at least one full PFSS game (up to 10 minutes of recorded video) of 32% of the participants (n = 20) in the Intervention group during a session at the early childhood center with the educator. A checklist was developed to determine if the experimental tasks were completed as described. An independent observer viewed 20 videos of participants completing the intervention. Based on 264 data points,
25
Data Analysis
Randomization of clusters (sites).
Prior reasoning on the design suggested on average 3 participants be allocated per cluster (early childhood education center/site). The intra-cluster correlation coefficient was
conservatively estimated to be 0.1, and hence conservative design effect of 1.2. A design effect of 1.2 indicates a 20% sample size inflation is needed to maintain pre-specified power after accounting for cluster effects. In the study, a total of 19 participating sites were randomized to the intervention arm, with a mean of 3.42 participants per cluster. A total of 20 participating sites were randomized to the control arm, with a mean of 2.90 participants per cluster. The intra-class correlation coefficient for the primary outcome variable was 0.11 (95% CI ranging from 0.04 to 0.289) consistent with prior expectations. For the sample data, an analysis using individual level analyses produces the same broad conclusions as cluster-level analyses weighted by cluster size and for brevity the individual level analyses are presented in the results section.
Analysis of outcome variables.
The randomized controlled trial comprised two randomized groups (Intervention,
two-26
way interaction between Group and Stage (i.e., are mean changes group dependent). Between groups comparisons at each stage were undertaken using the independent samples t-test, and within groups comparisons between stages were performed using the paired samples t-test.
The two-way interaction effect between Group and Stage for the primary outcome variable was the most important contrast for the design. For correlated measures (r >= 0.6) a minimum sample size of n = 46 per group was needed for an interaction corresponding to a medium effect size with 80% power in a design without clustering. For a clustered design, with design effect of 1.2, the required minimum sample size rose to n = 56 per group. To account for 10% missing values the sample size were upwardly revised to n = 63 per group.
In all analyses, the effect size was quantified using partial eta squared ( ). In two-way and higher order ANOVAs, the partial eta squared statistic indicates the proportion of variation attributable to a factor relative to the total of the error and factor variation, and as such always lies between 0 and 1. Thresholds for are 0.01, 0.06, and 0.14 for small, medium and large effects respectively (Miles & Shevlin, 2001). The chi-square test of association was used to examine differences between groups for categorical data.
A missing values analysis indicated only 2.2% of outcome data was missing at stage 2 or stage 3 on those eligible for randomisation. This percentage of missing data rose to 8.9% at stage 5 but included 5.1% of randomized participants with data known to be missing completely at random (e.g., missing due to illness, or away at time of assessment) and otherwise missing with no systematic pattern. Overall percentage of missing data at stage 6 was similarly 8.9% including 5.1.% with data known to be missing completely at random (e.g., due to illness, or absence at time of evaluation). Overall missing data is relatively small (<10%), is missing completely at
2 p
2 p
2 p
27
random (MCAR), or missing at random (MAR). Analysis under multiple imputation does not affect the conclusions drawn for this data set and for this reason the data are reported without imputation.
RESULTS
An intention-to-treat analysis was carried out on the primary outcome measure (PCC) and the secondary outcome measures followed by an analysis per protocol to account for the
variation (with respect to intensity of PFSS in the Intervention group), and receipt of additional SLP intervention received by each group.
Effectiveness of PFSS: Intention to Treat
The 123 participants who were eligible for intervention in stage 4 of the Sound Start Study were randomized into two groups. There were 65 participants randomized to the Intervention group and 58 randomized to the Control group; however, three participants
withdrew from the study (parents of two participants withdrew consent, one child did not provide assent to participate in intervention). Consequently, there were 63 children (19 sites) in the intervention arm and 57 children (20 sites) in the Control group (see Figure 1) whose results are reported. The two groups were similar on most measures, but differed on the severity of speech, and in age by one month on average (see Table 2). For percentage of consonants correct on the DEAP, the descriptive statistics suggest a higher average in those subsequently randomized to Intervention. However the standard deviation is also larger in the Control and these differences in the means and standard deviations are largely attributable to a single relatively low valued but genuine outlier in the Control group at stage 2 (consequently depressing the mean and raising the standard deviation in this group).
28
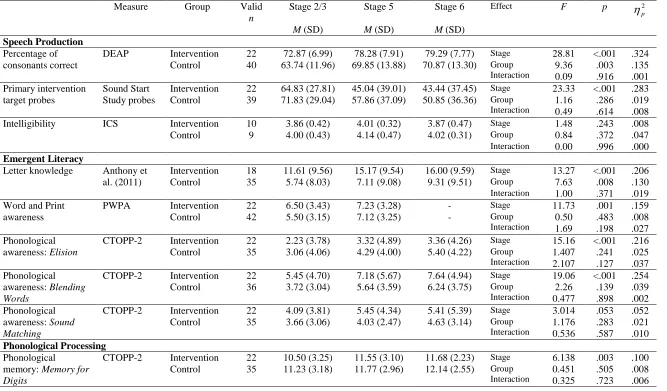
Three speech production accuracy measures were collected once before intervention (either at stage 2 or stage 3), and twice after intervention (stages 5 and 6).
Percentage of consonants correct on the Diagnostic Evaluation of Articulation and
Phonology(DEAP, Dodd et al., 2002). Analysis using an ANOVA for a 2 by 3 mixed design indicated a statistically significant change in mean PCC on the Phonology subtest of the DEAP between the data collection stages (p < .001, 2
p
= .287), and a statistically significant average
difference between the two Groups (p = .009, 2 p
= .062). The interaction between Stage and
Group was not a significant effect (p < .874, 2 p
= .001) (see Table 3). In the Intervention group there was a significant increase between stage 2 and stage 5 (p < .001) and this effect was maintained at stage 6 (p = .458). This same pattern is observed in the Control group, with a significant increase between stage 2 and stage 5 (p < .001) and this effect was maintained at stage 6 (p = .078). When the mean DEAP PCC was adjusted for baseline levels at stage 2, the mean DEAP PCC at stage 6 did not significantly differ between groups (p = 0.368,
2 p
= .007).
Primary intervention target phonological probes. Analysis of the data using an ANOVA for a 2 by 3 mixed design indicated statistically significant changes between the Stages (p < .001,
2 p
= .319), but no average significant difference between the two Groups (p = .322, 2 p
= .009)
29
significant (p < .001) as was the mean change between stage 3 and stage 6 (p < .001), and the mean change between stage 5 and stage 6 (p = .005).
Intelligibility in Context Scale (ICS, McLeod et al., 2012a). The mean score on the ICS was calculated for the participants whose parents provided data for all 7 items on the scale. Analysis using ANOVA for a 2 by 3 mixed design indicated a statistically significant change between Stages (p = .019, 2
p
= .094) but no significant difference between Groups (p = .365, 2 p
= .021). Additionally, the interaction between Stage and Group was not a statistically significant effect (p = .726, 2
p
= .008) (see Table 3). In the Intervention group there was a significant
change between stage 2 and stage 5 (p = .003) and between stage 2 and stage 6 (p = .006), but no significant change between stage 5 and stage 6. In the Control group there is a similar significant change between stage 5 and stage 6 (p = .009) but the effect was less clear when considering stage 2 against stage 6 (p = .074).
Emergent literacy skills.
Three emergent literacy measures were collected once before intervention (stage 3), and at least once post intervention (stages 5 and/or 6) to consider outcomes over time.
Letter knowledge (Anthony et al., 2011). Letter knowledge data were collected once pre-intervention (stage 3), and twice post-pre-intervention (stages 5 and 6). Analysis using an ANOVA for a 2 by 3 mixed design indicated there were significant changes over time (p < .001, 2
p = .186), but the main effect for randomized groups was not a statistically significant effect (p = 0.110, 2
p
= .030) and changes between stages were not group dependent (p = .190, 2 p
30
significantly increased between stage 5 and stage 6 (p = .030). In the Control group, mean values for Letter Knowledge significantly increased between stage 3 and stage 6 (p = .001) and between stage 5 and stage 6 (p = .022) but the effect between stage 3 and stage 5 was not significant (p = .129).
Preschool Word and Print Awareness (PWPA, Justice et al., 2006). PWPA data were collected for stages 3 and 5 and the data analyzed using ANOVA for a 2 by 2 mixed design. Mean PWPA significantly increased between the two stages (p < .001, 2
p
= .368), but there was no main effect attributable to randomized group (p = .858, 2
p
< .001), and changes over time
were not group dependent (p = .053, 2 p
= .035)
Phonological awareness (elision, blending words and sound matching). Phonological awareness data were collected once pre-intervention (stage 3), and twice post-intervention (stages 5 and 6). Statistically significant changes occurred between stages in elision (p < .001,
2 p
= .172), and blending words (p < .001, 2 p
= .181) but not in sound matching (p = .249, 2 p = .014). Over the three stages, the two randomized groups did not significantly differ on elision (p
= .238, 2 p
= .014), blending words (p = .837, 2 p
< .001), or sound matching (p = .573, 2 p =
.003), and any mean changes over time where not group dependent on elision (p = .208, 2 p = .016), blending words (p = .509, 2
p
= .007) or on sound matching (p = .518, 2 p
= .007).
Phonological processing skills.
Four phonological processing measures were collected once before intervention (stage 3), and twice post intervention (stages 5 and/or 6).
Memory for digits, nonword repetition, rapid color naming, and rapid object naming.
31 2
p
= .077), nonword repetition (p = .004, 2 p
= .057), and rapid color naming (p = .035, 2 p =
.060). However these changes are not group dependent (p = .624, 2 p
= .005; p = .727, 2 p
= .003;
p = .567, 2 p
= .010 respectively).
Children’s participation and wellbeing.
Four participation and wellbeing measures were collected once before intervention (stage 3), and twice post intervention (stages 5 and 6).
Focus on the Outcomes of Children Under Six(FOCUS, Thomas-Stonell et al., 2012).
The FOCUS total score was calculated for each participant. Analysis using an ANOVA for a 2 by 3 mixed design indicated there were no significant changes attributable to Stage (p = .167, 2
p
= .042), Group (p = .606, 2 p
= .006), nor for the interaction between Stage and Group (p = .668, 2
p
= .010) (see Table 3). A post hoc analysis of means indicated that the two groups did not significantly differ in mean FOCUS total score at any stage. Mean values for the FOCUS total score did not significantly change between stages for the Intervention group or the Control group.
Kiddy-Communication and Attitude Test (KiddyCAT, Vanryckeghem & Brutten, 2007).
Analysis using an ANOVA for a 2 by 3 mixed design, indicated statistically significant effects for Stage (p < .001, 2
p
= .073) but no significant effects for Group (p = .267, 2 p
= .012), or for
the interaction between Group and Stage (p = .292, 2 p
32
and stage 5, and stage 3 and stage 6, and stage 5 and stage 6 did not achieve statistical significance.
Speech Participation and Activity Assessment of Children (SPAA-C, McLeod, 2004). The number of times participants circled happy on the 10-items from the SPAA-C was determined for each stage. Analysis using an ANOVA for a 2 by 3 mixed design indicated the main effect for Stage was not statistically significant (p = .200, 2
p
= .016), and the main effect for
randomized group was not statistically significant (p = .080, 2 p
= .030). Similarly, the Group by
Stage interaction term did not achieve statistical significance (p = .151, 2 p
= .018) (see Table 3).
Australian Therapy Outcome Measures for Speech Pathology (AusTOMs, Perry & Skeat,
2004). The 5-point AusTOMs scales regarding Speech Impairment, Speech Activity, Speech Participation, and Speech Distress were completed by the assessing SLP and analyzed using Pearson’s chi-square statistic. Significant differences were found between the randomized groups for stage 2 and stage 5 on the Speech Activity and Speech Participation scales, but not for any other scale, or any other time. Specifically, Speech Impairment did not significantly differ
between the randomized groups at stage 2 (p = .480), nor at stage 5 (p = .601), nor at stage 6 (p = .253). Speech Activity did not significantly differ between the two groups at stage 2 (p = .716), nor at stage 6 (p = .122), but there was a significant differences at stage 5 (p = .048). Speech Participation did not significantly differ between the two groups at stage 2 (p = .212), nor at stage 6 (p = .314), but there were statistically significant differences at stage 5 (p = .040). Speech Distress did not significantly differ between randomized groups at stage 2 (p = .763), nor at stage 5 (p = .921), nor at stage 6 (p = .069).
33
Of the 45 participating sites, directors of 44 sites completed and returned questionnaires (valid percentages reported) reporting their typical classroom practices. None of the sites employed an SLP or had an SLP who visited their center to provide assessment or intervention for participants.
Emergent literacy instruction. Children were exposed “very much” or “quite a lot” to
letter name/sound activities at 18 sites (40.9%) and sound-play activities at 19 sites (43.2%). Fifteen (34.1%) sites reported that they used a specific phonological awareness program at their center. Only one site (2.3%) reported that they did not complete letter name/sound or sound-play activities at all. The directors of 34 centers (77.3%) reported that they felt children learned literacy through the use of computers.
Daily activities and technology use. Directors reported that they completed the following activities “very much” at their center: sitting and playing (n= 32, 72.7%), singing/stories/books (n = 20, 45.5%), individual attention in routines (n = 3, 6.8%), teaching good health practices (n
34
their center. The directors of 34 centers (77.3%) “agree” or “strongly agree” that computers are an essential part of learning and 41 (93.2%) “agree” or “strongly agree” that it was good to use technology to build on children’s interests. Only 14 (31.8%) directors saw facilitating internet access as a priority for the children at their center.
Adherence to Intervention Protocol
Each participant in the intervention arm was requested to work on the PFSS software over 9 weeks for at least 4 sessions per week (sessions were approximately 30 minutes each indicating a total of approximately 18 hours of intervention equivalent to 128-156 separate games). Over the trial there were 39 participants of 63 (61.9%) intervention participants who received at least 70% of the intended intervention intensity. This adherence level of 70% was considered acceptable, given that few studies have reported adherence levels better than 80%, and that “positive results have often been obtained with levels around 60%” reports (Durlak & Dupre, 2008, p. 331).
Parents of participants in the Intervention and Control groups were asked to indicate whether participants received speech-language pathology intervention during the Sound Start Study. In the Intervention group, 29 did not receive additional intervention, 24 did and 10 parents did not respond. In the Control group, 30 did not receive additional intervention, 10 did and 17 parents did not respond.
35
subsequently identified as “true controls”). Consequently, the effectiveness of PFSS was also considered using a per protocol analysis for the 23 participants who received true PFSS and the 47 true controls.
Effectiveness of PFSS: Per Protocol
Table 4 summarizes means, standard deviations and statistical significance for the per protocol analyses.
Speech production accuracy
Percentage of consonants correct on the Diagnostic Evaluation of Articulation and
Phonology(DEAP, Dodd et al., 2002). DEAP data for true controls and true PFSS is
summarized in Table 4. Analysis using an ANOVA for a 2 by 3 mixed design for these data gives the same statistical conclusions as the randomized groups analysis. That is, a statistically significant change in mean PCC on the Phonology subtest of the DEAP between the Stages (p < .001, 2
p
= .324), and a statistically significant average difference between the two Groups (p =
.003, 2 p
= .135), but with a non-significant interaction between Stage and Group (p = .916, 2 p = .001).
Primary intervention target phonological probes. Analysis of the per protocol subset indicates statistically significant change in means between the Stages (p < .001, 2
p
= .283), but
with no average significant difference between the two Groups (p = .286, 2 p
= .019), and any
changes in means were not group dependent (p = .614, 2 p
= .008) (see Table 4).
Intelligibility in Context Scale (ICS, McLeod et al., 2012a). In the per protocol analysis, average mean ICS did not significantly differ between the two Groups (p = .372, 2
p
36
not significantly differ between the three Stages (p = .243, 2 p
= .008), and differences between
groups did not significantly change between the Stages (p = .996, 2 p
< .001).
Emergent literacy skills
Three emergent literacy measures were collected once before intervention (stage 3), and at least once post intervention (stages 5 and/or 6) to consider outcomes over time (Table 4), as noted in the intention-to-treat section.
Letter knowledge (Anthony et al., 2011). For the per protocol analysis, there were statistically significant changes in mean letter knowledge between Stages (p < .001, 2
p
= .206), but the difference in means between groups did not significantly differ between Stages (p = .371,
2 p
= .019). The two groups significantly differed at stage 3 (p = .043), but with no significant difference at stage 5 (p = .128, 2
p
= .041), nor at stage 6 (p = .440, 2 p
= .011) after controlling for initial differences at stage 3.
Preschool Word and Print Awareness (PWPA, Justice et al., 2006). Mean PWPA significantly increased between stage 3 and stage 5 (p = .001, 2
p
= .159), but the per protocol
groups did not significantly differ on average (p = .483, 2 p
= .008), and changes over time were not group dependent (p = .198, 2
p
= .027).
Phonological awareness (elision, blending words and sound matching). Table 4 reports statistically significant changes between stages for elision (p < .001, 2
p
= .216), and blending
words (p < .001, 2 p
= .254) but not in sound matching (p = .053, 2 p
= .052). On average, the two
per protocol groups did not significantly differ on elision (p = .241, 2 p
= .025), blending words (p = .139, 2
p
= .039), or sound matching (p = .283, 2 p
37
difference between the two per protocol groups did not significantly change between stages for elision (p = .127, 2
p
= .037), for blending words (p = .898, 2 p
= .002) or sound matching (p = .587, 2
p
= .010)
Phonological processing skills
Four phonological processing measures were collected once before intervention (stage 3), and twice post intervention (stages 5 and stage 6) (Table 4).
Memory for digits, non-word repetition, rapid color naming, and rapid object naming.
Mean memory for digits significantly increased over the three stages (p = .003, 2 p
= .100) as shown in Table 4. However, mean changes between the stages were not significant effects for non-word repletion (p = .192, 2
p
= .030), for rapid color naming (p = .065, 2 p
= .082), and rapid object naming (p = .168, 2
p
= .041). On average, the two groups did not significantly differ on any of these four measures and the extent of between groups differences was not stage dependent for memory for digits (p = .723, 2
p
= .006), non-word repetition (p = .514, 2 p
= .012), rapid
color naming (p = .961, 2 p
= .001), or rapid object naming (p = .827, 2 p
= .001).
Children’s participation and wellbeing
Three participation and wellbeing measures were collected once before intervention (stage 3), and twice post intervention (stage 5 and stage 6) (Table 4). On average, the per protocol groups did not significantly differ on mean FOCUS (p = .584, 2
p
= .017), nor on mean
KiddyCAT (p = .367, 2 p
= .014), nor on mean SPAA-C (p = .493, 2 p
= .009). Mean KiddyCAT significantly decreased between stages (p < .001, 2
p
= .073) as shown in Table 4, but the main
effect of Stage did not achieve statistical significance for FOCUS (p = .355, 2 p
38 SPAA-C (p = .128, 2
p
= .037). In addition, the extent of differences between groups did not
significantly change between the stages for FOCUS (p = .827, 2 p
= .011), for KiddyCAT (p =
.292, 2 p
= .012), or for SPAA-C (p = .341, 2 p
= .019).
DISCUSSION
39
Separating statistical significance from clinical and personal significance
The statistical analyses revealed significant improvements in measures of speech
production, emergent literacy, and some measures of phonological processing, participation and wellbeing for the participants in the Intervention and Control groups. Although this was
encouraging, closer inspection of the measures suggested that the average improvement was not clinically significant, as speech, emergent literacy, and phonological processing difficulties were still apparent post-intervention. For example, the severity of the participants’ SSD in the
Intervention group remained mild-moderate (based on PCC), despite intervention. According to Bothe and Richardson (2011), clinical significance is only apparent when a change is sufficient to modify a clinical description or label for a presenting problem. The lack of clinical
significance is also apparent when the degree of change is considered. For example, the average percentage improvement in PCC from the DEAP Phonology subtest (Dodd et al., 2002) for the participants in both groups from pre- to immediate post-intervention was approximately 6%. Given that their pre-assessment occurred in Stage 2 (6 to 8 weeks before starting intervention), that intervention was 9 weeks in duration, and that the post-assessment occurred one week later, this degree of improvement occurred over approximately 16 weeks. In a study comparing the effect of minimal versus non-minimal contrast intervention delivered weekly by SLPs in 30-minute sessions for 12 weeks, Dodd et al. (2008) reported that their preschoolers increase in PCC (using the same assessment task as the current study) was over 16%. This degree of improvement was commensurate with other studies of phonological intervention (e.g., Crosbie, Holm, & Dodd, 2005).
40
significant. Personal significance is only apparent when clients report improvements that matter to them; improvements that change the way they function in day-to-day life (Bothe &
Richardson, 2011). The findings from this study highlight the importance of collecting measures of impairment (e.g., PCC, % occurrence of a phonological process) in addition to personal measures of participation and wellness when interpreting the effect of intervention on children with SSD and their families.
Why did the intervention not work?
PFSS was designed for children with phonologically-based SSD. In the current study, the delivery of PFSS by educators in early childhood centers did not result in significantly better speech, emergent literacy, phonological processing, or participation and wellbeing for the children in the Intervention group compared to the Control group. Five possible reasons for this are outlined below.
First, in the current study PFSS was delivered by educators using the teacher settings rather than the free configuration setting, as was used by Wren and Roulstone (2008). We chose to use the teacher settings, because it simplified the delivery of the intervention and addressed one of the primary aims of this study, to investigate the delivery of intervention by non-SLP
intervention agents. It meant that the educators did not need to assess and monitor children’s speech. They needed to facilitate a child’s completion of activities in PFSS. However, in doing so, it is possible that the teacher settings diminished opportunities to dynamically tailor PFSS to the children’s responses—selecting easier or more challenging games and/or selecting different error patterns to facilitate the children’s progress from session to session.
Second, while the effectiveness of the teacher settings themselves is unknown, an
41
ineffective, when SLP involvement is reduced to advising about targets and providing a program. As Dodd and Barker (1990) reported, it may be that educators may have too many barriers in their workplace setting to implement intervention for children with SSD. Many studies have included support from parents as a key element of the intervention program (Bowen & Cupples, 1999) and parents can be trained to be effective intervention agents (Sugden, Baker, Munro, & Williams, 2016), although meta-analyses of the effects of parent interventions suggest that implementation of this is by no means straightforward (Law et al., 2003/2010). The possibility that PFSS may be effective when well implemented by parents using the teacher or free configuration setting remains to be determined.
Third, not all participants in the Intervention group received the proposed intervention intensity—39 of the 63 participants (61.9%) in the Intervention group received at least 70% of the intended intervention. It is possible that under-dosing moderated the effect of PFSS. In follow-up investigations of the current study, the educators were interviewed about their experience implementing PFSS in a preschool setting (Crowe et al., 2016), and comparisons were made regarding the intensity of the intervention as recorded by the educators and the computer (McCormack et al., 2016). As part of these investigations multiple barriers and
facilitators to implementation were identified including personal factors (e.g., child engagement with PFSS), environmental factors (e.g., the logistics of implementing PFSS during a busy preschool day), and computerprogram factors (e.g., program format, varied game durations). Similar to Dodd and Barker (1990), the educators found it challenging to consistently find the time to conduct the prescribed number of games each week, with the participant(s) at their center. If we are to find a solution to the gap between the demand and supply for
42
appear to be a viable option. Alternative or supplementary solutions need to be found. Perhaps PFSS could be effective but only when an optimal intensity of practice is adhered to, and the program is implemented at an acceptable level across intervention agents and settings (e.g., SLP, parent, educator, therapy assistant). Exactly what constitutes an acceptable level of
implementation and what would be needed to ensure this level in day-to-day contexts remains to be determined. As Durlak (2015) points out, more research about implementation adherence is needed, if we are to determine the conditions under which interventions are and are not effective.
Fourth, it is possible that some children did not have input based problems underlying their surface level SSD or that input processing problems were having less impact on their SSD than output factors. Whilst individuals were assessed on the CTOPP-2 (Wagner et al., 2013), a measure of phonological processing, the results are presented for the groups and it is possible that analysis at the individual level may reveal that children with poorer performance on
phonological processing measures prior to intervention made more progress with the intervention than those who showed better performance. In contrast, those with a predominantly output
processing basis to their SSD would have benefited from a different approach to intervention. Finally it is important to consider the possibility that PFSS is not effective in changing speech output, or in teaching phonological awareness in children with phonologically-based SSD. There is not enough space to discuss whether this would be the tool itself or the theoretical approach to intervention which underpins it but nevertheless, it is difficult to know whether either is the case, as other factors (e.g., use of the teacher setting, the less than optimal
43
the amount of change in PCC from pre- to immediate post (-12.6% to +35.36%) for the
participants in the Intervention group. However, it is also possible that other factors influenced the change in the participants’ PCC from pre- to immediate post, given the range in the amount change (-12.5% to +29.10%) for participants in the Control group. Receipt of additional speech-language pathology services is one possible factor, given that the participant in the Intervention group who showed a change in PCC of 35.36% over approximately 16 weeks was reported to have received speech-language pathology intervention over the course of the study. This cannot be the sole factor influencing change, as the participant in the Control group who showed a change in PCC of 29.1% over the course of the intervention, was reported to have not received any additional speech-language pathology over the course of the study. Clearly, further research is needed to better understand the natural history of SSD in preschool children, and the factors associated with children who show little versus considerable improvement in speech production, emergent literacy, phonological processing, and participation and wellbeing overtime
(Roulstone, Miller, Wren, & Peters, 2009).
Limitations
Although this study used a robust experimental design, it is not without limitations. First, a variety of outcome measures were used to assess the effect of PFSS. Measures of the children’s speech focused on speech production. Measures of speech perception were not included. It is therefore unknown if PFSS improved the quality of the children’s acoustic-perceptual
44
have influenced the result. Given that individual SLPs have been reported to differentially contribute to gains in school-age children’s language and literacy abilities (Farquharson,
Rambyraja, Logan, Justice, & Schmitt, 2015), it is also possible that variation in early childhood educator characteristics (e.g., level of education, years of experience, age) influenced the results. Finally, not all participants received the recommended intensity. This was a difficult variable to control for, given the real-world constraints and demands on day-to-day life in a busy preschool setting. Some educators worked consistently with the participants, achieving intensity
compliance rates over 90%. Some did not adhere to the prescribed intensity (Crowe et al., 2016; McCormack et al., 2016). This variation in intensity may have influenced the result. Nonetheless, a pragmatic trial is an important step in understanding how effective an intervention is likely to be in a real-world setting.
Future directions: Closing the gap between the demand and supply of SLPs for children
with SSD
45
intervention intensity. For some children, this intervention might involve cognitive-linguistic tasks coupled with production practice (e.g., Williams, 2012). For others, intervention might combine input and output (production) procedures (e.g., Hodson, 2007). Rvachew and Brosseau-Lapré (2015) found that whatever approach is used by an SLP, follow-up activities completed by non-SLPs (e.g., parent, educator) need to be similar to what is completed by the SLP. For
instance, Rvachew and Brosseau-Lapré (2015) reported that an SLP-delivered input-based intervention comprising at least 16 different treatment procedures such as focused stimulation, chaining, delayed imitation, receptive and expressive minimal pairs was considered effective when paired with dialogic reading for home practice. It is important to note, that even though their approach was identified as an input-based approach, it still included opportunities for production practice.
Across empirical evidence reporting effective interventions for children with SSD, most involve speech production practice of carefully selected targets (with or without input-based procedures), implemented by an SLP through the use of a variety of instructional cues and feedback (Baker & McLeod, 2011; McLeod & Baker, 2017). If we are to move forward in closing the gap between supply and demand for intervention by using non-SLPs, the findings from the current study suggest that we need to focus our efforts on using effective interventions suited to children’s needs, and adopt empirically-supported training strategies that facilitate faithful implementation of those interventions.
ACKNOWLEDGMENTS
46
References
Allen, M. M. (2013). Intervention efficacy and intensity for children with speech sound disorders. Journal of Speech, Language, and Hearing Research, 56, 865–877. American Speech-Language-Hearing Association. (1985). Guidelines for identification
audiometry. ASHA, 27, 49-52.
Anthony, J. L., Aghara, R. G., Dunkelberger, M. J., Anthony, T. I., Williams, J. M., & Zhang, Z. (2011). What factors place children with speech sound disorder at risk for reading
problems? American Journal of Speech-Language Pathology, 20(2), 146-160.
Australian Bureau of Statistics (2008). An introduction to Socio-Economic Indexes for Areas (SEIFA) 2006. Canberra, Australia: Australian Bureau of Statistics.
Australian Institute of Family Studies. (2007). Growing up in Australia: The Longitudinal Study of
Australian Children. Retrieved from http://www.aifs.gov.au/growingup/
Baker, E. (2012). Optimal intervention intensity in speech-language pathology: Discoveries,
challenges, and unchartered territories. International Journal of Speech-Language Pathology,
14(5), 478-485.
Baker, E. & McLeod (2011). Evidence-based practice for children with speech sound disorders: Part 1 narrative review. Language, Speech, and Hearing Services in Schools, 14, 102-139.
47
Bowen, C. & Cupples, L. (1999) Parents and children together (PACT): A collaborative approach to phonological therapy. International Journal of Language and Communication Disorders, 34, 35-55.
Broen, P. A., & Westman, M. J. (1990). Project parent: A preschool speech program
implemented through parents. Journal of Speech and Hearing Disorders, 55, 495–502. Broomfield, J., & Dodd, B. (2004). The nature of referred subtypes of primary speech disability.
Child Language Teaching and Therapy, 20, 135-151.
Chen, Y.-P. P., Johnson, C., Lalbakhsh, P., Caelli, T., Deng, G., Tay, D., . . . Morris, M. E. (2016). Systematic review of virtual speech therapists for speech disorders. Computer Speech and Language, 37, 98-128.
Crosbie, S., Holm, A., & Dodd, B. (2005). Intervention for children with severe speech disorder: A comparison of two approaches. International Journal of Language and Communication Disorders, 40(4), 467-491.
Crowe, K., Cumming, T., McCormack, J., Baker, E., McLeod, S., Wren, Y., Roulstone, S., & Masso, S. (2016). Educators’ perspectives on facilitating computer-assisted speech
intervention in early childhood settings. Manuscript in submission.
Dodd, B. (2013). Differential diagnosis and treatment of speech disordered children (3rd ed.).
Hoboken, NJ: Wiley.
48
Dodd, B., Crosbie, S., McIntosh, B., Holm, A., Harvey, C., Liddy, M., . . . Rigby, H. (2008). The impact of selecting different contrasts in phonological therapy. International Journal of Speech-Language Pathology, 10(5), 334–345.
Dodd, B., Hua, Z., Crosbie, S., Holm, A., & Ozanne, A. (2002). Diagnostic Evaluation of Articulation and Phonology. London, UK: Pearson
Duggirala, V. & Dodd, B. (1991). A psycholinguistic assessment model for disordered
phonology. Congress for Phonetic Sciences, Aix-en-Provence, Université de Provence, 342–345.
Dunn, L. M., & Dunn, D. M. (2007). The Peabody Picture Vocabulary Test - Fourth Edition (PPVT-4). Bloomington, MN: Pearson.
Durlak, J. A. (2015). Studying program implementation is not easy but it is essential. Prevention Science, 16, 1123-1127.
Durlak, J. A. & DuPre, E. P. (2008). Implementation matters: A review of research on the influence of implementation on program outcomes and the factors affecting implementation. American Journal of Community Psychology, 41, 327-350.
Eadie, P., Morgan, A., Ukoumunne, O. C., Ttofari Eecen, K., Wake, M., & Reilly, S. (2015). Speech sound disorder at 4 years: Prevalence, comorbidities, and predictors in a community cohort of children. Developmental Medicine and Child Neurology, 57(6), 578-584.
49
Ehrler, D. J., & McGhee, R. L. (2008). Primary Test of Nonverbal I