http://wrap.warwick.ac.uk
Original citation:
Hadley, David (2014) Highlights from T2K. In: 2nd International Conference on New
Frontiers in Physics, Kolymbari, Crete, Greece, 28 Aug - 5 Sep 2013. Published in: EPJ
Web of Conferences, Volume 71
Permanent WRAP url:
http://wrap.warwick.ac.uk/62887
Copyright and reuse:
The Warwick Research Archive Portal (WRAP) makes this work of researchers of the
University of Warwick available open access under the following conditions.
This article is made available under the Creative Commons Attribution 2.0 Generic (CC
BY 2.0) license and may be reused according to the conditions of the license. For more
details see:
http://creativecommons.org/licenses/by/2.0/
A note on versions:
The version presented in WRAP is the published version, or, version of record, and may
be cited as it appears here.
Highlights from T2K
David Hadley1,a on behalf of the T2K collaboration
1University of Warwick, CV4 7AL, United Kingdom
Abstract.
T2K is a long baseline neutrino oscillation experiment. A high intensity proton beam at J-PARC produces a narrow-band muon-neutrino beam with a peak energy of 0.6 GeV at the far detector, Super-Kamiokande, 295km from the pro-duction point. The T2K experiment has observed electron neutrino appearance in a muon neutrino beam and measured sin22θ13=0.140−+00..038032(0.170+−00..045037) assum-ing the normal (inverted) hierarchy. In addition the latest measurements ofθ23 and Δm232 are reported, along with the latest T2K neutrino interaction cross section measurements of the inclusive CC, CCQE and NCE channels.
1 Introduction
In the standard 3 neutrino model, the flavour states are related to the mass states through the PMNS matrix [1][2]. This mixing matrix is conventionally parameterised by three real mixing angles (θ12, θ23, θ13) and one complex CP violating phase (δCP). The oscillation probability also depends on the neutrino mass splittings, Δm2i j =m2i −m2j. In the T2K experiment [3] a mostlyνμ beam with a peak energy of 0.6 GeV is directed towards the Super-Kamiokande detector at a distance of 295 km from the source. The appearance channel (νμ → νe) is sensitive toθ13. The disappearance channel (νμ→νμ) is sensitive toθ23 andΔm223. This note reports the observation of theνμ→νe channel and the consequent measurement ofθ13. The measurement of non-zeroθ13 opens the way to measurement of δCP. In addition, the latest results from the νμ → νμ channel and neutrino interaction cross section measurements are reported.
2 The T2K Experiment
A high intensity30GeV proton beam at J-PARC is directed towards a graphite target. The charged hadrons produced are focussed by magnetic horns to produce a mostlyνμbeam. The far detector is located2.5◦ degrees off-axis. This exposes the far detector to a narrow-band beam peaked at0.6GeV which is optimised to give the maximum appearance probability and the minimum background to theνe appearance analysis. The predicted flux at the ND280 near detector is shown in fig. 1. The beam prediction is based on simulations tuned to external
ae-mail: [email protected] DOI: 10.1051/
C
Owned by the authors, published by EDP Sciences, 2014
/2 01
hadron production data from the NA61/SHINE experiment [4][5] and in-situ measurements from muon monitors. A total of6.6×1020 POT was delivered up to 2013.
The near detector complex at 280m from the target consists of two main detectors, IN-GRID (on-axis) and ND280 (off-axis), providing a range of target materials and detector technologies. Their purpose is two-fold. First to directly measure the neutrino beam. Second to measure neutrino interaction cross sections.
INGRID [6] consists of an array of 16 iron/scintillator sandwich modules and a single fine grained pure scintillator detector. The modules cover a range ofx−ypositions allowing measurement of the profile of the neutrino beam. As well as monitoring the neutrino beam INGRID will also be used to measure neutrino cross sections.
The off-axis near detector, shown in fig. 2, is divided into a Tracker andπ0detector region. The Fine Grained Detector [7] (FGD1) consists of layers of plastic scintillator bars,10×10mm in cross section, read out with wavelength shifting fibers into Multi-Pixel Photon Counters (MPPCs). It provides target mass and track reconstruction near the interaction vertex. The Time Projection Chambers [8] (TPCs) provide PID based on dE/dxin the Argon based gas and momentum measurement from track curvature in the magnetic field.
Theπ0 detector [9] (P0D) consists of alternating layers of plastic scintillator bars1, water bags and brass/lead sheets surrounded by e. m. calorimeters. Its main goal is to measure interactions producingπ0 in the final state.
Charged currentνμinteractions are selected by requiring a reconstructed muon originating in the FGD fiducial volume. Final state charged pions are identified by late charge deposits from decay electrons or additional reconstructed tracks with dE/dxconsistent with a pion. The event sample is divided into three topologies based on the number of pions reconstructed in the final state: CC0π, CC1πand other. The reconstructed muon momentum is shown in fig. 3. The prior beam flux and neutrino interaction model is fitted to the observed muon p−cos(θ) distribution of these samples. This choice of topologies allows the data to con-strain the parameters of the interaction model governing quasi-elastic scattering and resonant pion production. The post-fit model with reduced total uncertainty is propogated to the far detector oscillation analyses.
The far detector, Super-Kamiokande (SK), shown in fig. 4, is a 50kt Water Cherenkov detector located 1km underground in the Mozumi Mine in Kamioka. The detector contains
∼13,000PMTs that image the neutrino interactions. Analysis of the reconstructed Cherenkov rings allows determination of charged lepton flavour and hence the initial neutrino flavour.
3 Oscillation Analysis
3.1 νe Appearance
Fully contained, electron-like single ring events are selected. Events with late time signals or electron momentum less than100MeV are rejected to remove decay electrons fromμandπ. Events with reconstructed neutrino energyEreco>1250MeV are rejected as these are mostly intrinsic beam background.
A new PID algorithm improves theπ0 rejection compared to previous T2K analyses. For each PMT, the expected hit charge and time PDF for a given particle species, position and momentum is computed. A combined likelihood is formed from the product over all PMTs and all particles in the case of multiple particle final states such asπ→γγ. A maximum likelihood
1readout with the same MPPCs.
EPJ Web of Conferences
fit is performed for each particle hypothesis. The reconstructed position and momentum is taken from the best-fit parameters. The minimized likelihood value is used to determine the particle species. π0 background is rejected by cutting on the reconstrucedγγinvariant mass and the minimized log likelihood ratio ln(Lπ0/Le).
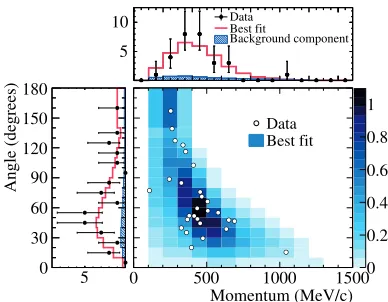
The selected events are shown in fig. 5. A total of 28 νe candidate events are selected. The expected background is4.92±0.55events. These results are based on6.6×1020 POT.
Oscillation parameters are extracted from a maximum likelihood fit to the observed lepton p−θdistribution. Assuming the normal (inverted) hierachy,sin22θ13 =0.140−+00..032038(0.170−+00..045037). The values of the other oscillation parameters are assumed to be |Δm232| = 2.4 ×10⁻³eV2,
sin2θ
23=0.5, andδCP=0. The 68% and 90% CL forsin2θ13 evaluated for different values of
δCP are shown in fig. 6. An alternative analysis based on the reconstucted neutrino energy
distribution, assuming quasi-elastic kinematics, gives consistent results. The case ofθ13 =0 is excluded at7.3σsignificance [10].
3.2 νμ Disappearance
A similar analysis is performed on the disappearance channel to measuresin2(θ23)and Δm232. Fully contained, muon-like single ring events with visible energy > 30 MeV, reconstructed muon momentum>200MeV and≤1 decay electron are selected.
The selected events are shown in fig. 7. 58 candidate νμ events are observed. With no oscillation205±17events are expected. These results are based on3.0×1020 POT.
A maximum likelihood fit to the reconstructed neutrino energy distribution assuming QE kinematics, gives sin2(θ23) = 0.514±0.082 and Δm232 =2.44+0−0..1715×10−3eV2/c4. The 90% CL contour is shown in fig. 8 along with results from other experiments. This result is consistent with maximal disappearance probability [11].
4 Cross Section Measurements
Neutrino interactions on nuclei form the signal in all current and planned future long-baseline neutrino oscillation experiments. Understanding these interactions in the energy regime cov-ered by the T2K beam flux is essential for the study of neutrino oscillations. The latest T2K cross section measurements in Charged Current (CC) Inclusive, CC quasi-elastic scattering (CCQE) and Neutral Currant Elastic (NCE) are shown in the following sections. These three measurements are based on the ND280 detector described in section 2.
4.1 CC Inclusive Cross Section Measurement
νμ CC interactions are selected by requiring events with a reconstructedμ− starting within
the FGD fiducial volume. Tracks are required to be negative, forward-going and have a muon-like TPC PID. This event selection achieves an efficiency of 50% and a purity of 87%. The dominant background is from out of fiducial volume interactions.
The cross section is extracted from the reconstructed pμ−cos(θμ) distribution. The NC background is subtracted and an efficiency correction is applied based on predictions from MC. An iterative Bayesian unfolding method is used to correct for reconstruction bias and unsmear distributions.
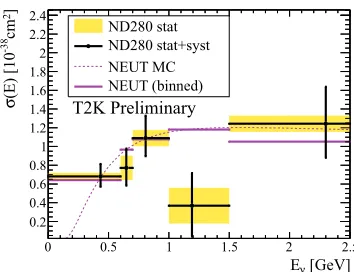
The measured double differential flux integrated cross section is shown in fig. 9 [12]. The flux-averaged total cross section is measured to be σCCφ = (6.91 ± 0.13(stat) ±
0.84(syst))×10−39cm2/nucleonand is consistent with the predictions from NEUT [15] (7.27×
4.2 CCQE Cross Section
The Charged-Current Quasi-Elastic (CCQE) interaction,ν+n → l−+p, is the main signal in the neutrino oscillation measurement. This two-body interaction is important because the initial neutrino energy can be inferred from final state lepton kinematics. Additional cuts are applied to the CC inclusive sample to select interactions containing a muon with no pions in the final state. This event selection achieves an efficiency of40% and purity72% for true CCQE events.
The CCQE cross section is extracted by fitting the NEUT MC model to the reconstructed pμ−cos(θμ) distribution. This is shown in Figure 10 [13]. Systematic uncertainties are
accounted for by varying bin contents with nuisance parameters. A maximum likelihood fit is used to find the best fit parameters. A χ2 test comparing the fitted result with the nominal NEUT model gives p-value of 17% indicating agreement between the data and the cross section model.
An alternative approach to fitting the cross-section normalisation, is to directly fit the model parameters. The axial mass parameter MQEA is varied to obtain the best fit to the observed data. The fit is performed once using both shape and normalisation and again using only shape information. The best fit values forMAQE-norm (MQEA -shape) with the RFG model is1.14+0−0..2720 GeV (1.38+0−0..3927 GeV). Large effective MQEA is believed to be due to unaccounted for nuclear effects. Note that the meaning of this effective parameter depends on the details of the QE model; comparison with results from other experiments should be done with care.
5 Neutral Current Elastic Cross Section Measurement
The Neutral Current Elastic channel isνμ+p(n)→νμ+p(n). The observable signal produced in the detector is a proton track. Note that cases where the target nucleon is a neutron can also produce protons due to final state interactions in the nucleus. In the T2K analysis the signal is defined as all NC interactions with only nucleons leaving the nucleus (no charged leptons or pions).
There are two main backgrounds to this channel. First, charged current interactions where theμ and p tracks are back-to-back and hence are reconstructed as the same track. This background is removed with PID based on dE/dx along the reconstructed track. Second, background from external interactions. This is measured in-situ from side-band samples.
3936 events are selected with an expect background of 2016. The flux integrated absolute cross section is calculated asσflux=2.24±0.07(stat)+0−0..5363(syst)×10−39cm2 [14]. This can be compared with MC predictions from NEUT (GENIE) ofσflux=2.02(1.79)×10−39cm2 This analysis is based on9.9×1019POT of water-in data. Future analyses will use water-out data to extract the cross-section on water.
6 Conclusion and Outlook
The T2K experiment has recorded6.6×1020 POT recorded to date. With only a fraction of the approved POT, the T2K experiment has discoveredνeappearance and is producing world leading measurements of theθ23 mixing angle. T2K will continue to improve the neutrino os-cillation measurements and produce further neutrino interaction cross section measurements. In 2014 T2K will run for the first time in anti-neutrino mode. The observation of non-zero
θ13 allows the measurement ofδCP. The T2K experiment will lead the search for leptonicCP
violation in the coming years.
EPJ Web of Conferences
References
[1] Z. Maki, M. Nakagawa, and S. Sakata, Prog. Theor. Phys. 28, 870 (1962). [2] B. Pontecorvo, Sov. Phys. JETP 26, 984 (1968).
[3] K. Abe et al. (T2K Collaboration), Nucl. Instrum. Meth. A659, 106 (2011). [4] N. Abgrall et al. (NA61/SHINE Collaboration), Phys.Rev. C84, 034604 (2011). [5] N. Abgrall et al. (NA61/SHINE Collaboration), Phys.Rev. C85, 035210 (2012). [6] K. Abe et al. (T2K Collaboration), Nucl. Instrum. Meth. A 694, 211 (2012).
[7] P.-A. Amaudruz et al. (T2K ND280 FGD Collaboration), Nucl. Instrum. Meth. A 696, 1 (2012).
[8] N. Abgrall et al. (T2K ND280 TPC Collaboration), Nucl. Instrum. Meth. A 637, 25 (2011). [9] S. Assylbekov et al. (T2K ND280 P0D Collaboration), Nucl. Instrum. Meth. A 686, 48
(2012).
[10] K. Abe et al. (T2K Collaboration), arxiv:1311.4750 (2013)
[11] K. Abe et al. (T2K Collaboration), Phys. Rev. Lett. 111, 211803 (2013). [12] K. Abe et al. (T2K Collaboration), Phys. Rev. D87, 092003 (2013). [13] D. Hadley, Proceedings of NuFact 2013 (to appear)
[14] D. Ruterbories, Proceedings of NuFact 2013 (to appear) [15] Y. Hayato, Acta Phys. Polon. B40, 2477 (2009).
Figure 1: Predicted neutrino flux at SK.
! "#
$ %
[image:7.482.54.433.295.571.2]&
Figure 2: The ND280 off axis near detector.
Muon momentum [MeV/c]
Number of events
0 500 1000 1500 2000 2500 3000
MC NEUT nominal
MC Post-fit
Data
Muon momentum [MeV/c]
0 500 1000 1500 2000 2500 3000 3500 4000 4500 5000
Data/MC
0.6
0.81
1.2
(a)CC0π
Muon momentum [MeV/c]
Number of events
0 50 100 150 200 250 300 350 400 450
MC NEUT nominal
MC Post-fit
Data
Muon momentum [MeV/c]
0 500 1000 1500 2000 2500 3000 3500 4000 4500 5000
Data/MC
0.5 1
(b)CC1π
Muon momentum [MeV/c]
Number of events
0 50 100 150 200 250 300 350 400
MC NEUT nominal
MC Post-fit
Data
Muon momentum [MeV/c]
0 1000 2000 3000 4000 5000 6000 7000 8000 9000 10000
Data/MC
0
0.51
1.52
(c)CCother
Figure 3: The reconstructed muon momentum distribution for the 3 ND280 samples (a)CC0π (b)CC1πand (c)CC other. The MC predictions are shown both before and after fitting.
Figure 4: The Super-K detector.
5 10
5 0 30 60 90 120 150 180
Angle (degrees)
Data Best fit
Background component
Momentum (MeV/c)
0 500 1000 15000
0.2 0.4 0.6 0.8 1 Data
Best fit
[image:8.482.143.337.270.421.2]13
θ
2
2
sin
0 0.2 0.4 0.6
CP δ -3 -2 -1 0 1 2 3 68% C.L. =0.4 23 θ 2 sin =0.5 23 θ 2 sin =0.6 23 θ 2 sin range σ Reactor 1
Run1-4 data (6.570e20 POT) Normal hierarchy 2 eV -3 10 × |=2.4 32 2 m Δ | 13 θ 2 2 sin
0 0.2 0.4 0.6
CP δ -3 -2 -1 0 1 2 3 68% C.L. =0.4 23 θ 2 sin =0.5 23 θ 2 sin =0.6 23 θ 2 sin range σ Reactor 1
[image:9.482.51.442.87.234.2]Run1-4 data (6.570e20 POT) Inverted hierarchy 2 eV -3 10 × |=2.4 32 2 m Δ |
Figure 6: The 68% CL contours onsin22θ13 evaluated for different values ofδCP and with different assumptions of the value ofθ23. The constraint from reactor experiments is overlaid.
(GeV)
reco
E
0 1 2 3 4 5 6
Events per bin
0 5 10 15 20 25 30
35 1 μ-like ring spectrum
Run1+2+3 dataset No oscillation expectation
best-fit 23 θ 2 "2+N" sin (GeV) reco E
0 1 2 3 4 5 6
Ratio
[image:9.482.62.224.306.427.2]-1 0 1 2
Figure 7: The reconstructed neutrino en-ergy of the candidateνμevents in SK.
) 23 θ (2 2 sin
0.82 0.84 0.86 0.88 0.9 0.92 0.94 0.96 0.98 1
) 4 /c 2 eV -3 | (10 2 32 m Δ | 2 2.5 3 3.5
4 T2K 3ν 90% C.L.
90% C.L.
ν
T2K 2011 2
90% C.L.
ν
MINOS 2013 2
90% C.L.
ν
SK zenith 2012 3 90% C.L.
ν
SK L/E 2012 2
Figure 8: 90% CL on sin22θ23 and |Δm232| Results from other experiments are shown for comparison. .
EPJ Web of Conferences
(MeV/c)
μ
p
0 500 1000 1500 2000
nucleon MeV/c 2 cm θ dp dcos σ 2 d 0 5 10 15 -42 10 × Data Systematic Error Statistical Error NEUT GENIE < 0.84 μ θ 0.00 < cos
(a)0.00<cos(θμ)<0.84
(MeV/c)
μ
p
0 500 1000 1500 2000
nucleon MeV/c 2 cm θ dp dcos σ 2 d 0 5 10 15 -42 10 × Data Systematic Error Statistical Error NEUT GENIE < 0.90 μ θ 0.84 < cos
(b)0.84<cos(θμ)<0.90
(MeV/c)
μ
p
0 500 1000 1500 2000
nucleon MeV/c 2 cm θ dp dcos σ 2 d 0 5 10 15 -42 10 × Data Systematic Error Statistical Error NEUT GENIE < 0.94 μ θ 0.90 < cos
(c)0.90<cos(θμ)<0.94
(MeV/c)
μ
p
0 500 1000 1500 2000
nucleon MeV/c 2 cm θ dp dcos σ 2 d 0 5 10 15 -42 10 × Data Systematic Error Statistical Error NEUT GENIE < 1.00 μ θ 0.94 < cos
[image:10.482.51.416.78.368.2](d)0.94<cos(θμ)<1.00
Figure 9: The measured CC inclusive cross section. Figures (a-d) show the μ− momentum distribution in each bin of cos(θμ). The ND280 result is shown along side the prediction from the NEUT and GENIE neutrino event generators.
ν σ !" #$%%& '()*$$%)
[image:10.482.157.334.438.574.2]