A Thesis Submitted for the Degree of PhD at the University of Warwick
http://go.warwick.ac.uk/wrap/77053
This thesis is made available online and is protected by original copyright.
Please scroll down to view the document itself.
Signal Processing Techniques to
Enhance BCI Paradigms
by
Simon R. H. Davies
A thesis submitted in fulfilment of the requirements for
the degree of Doctor of Philosophy in Engineering
University of Warwick, Warwick Manufacturing Group
Declaration ... I
Abstract ... II
Abbreviations ... V
List of Figures ... VIII
List of Tables ... XI
1 INTRODUCTION ... 1
1.1 MOTIVATION ... 1
1.2 BACKGROUND ... 2
1.3 AIMS AND OBJECTIVES ... 3
1.3.1 Development and Application of Novel Signal Processing Techniques .. 4
1.3.2 Development and Evaluation of Novel Stimulus of Evoked Potentials .. 6
1.4 THESIS STRUCTURE ... 7
1.5 PUBLICATIONS ... 7
2 ORIGINS AND PHYSIOLOGY BEHIND EEG AND BCI ... 9
2.1 THE BRAIN ... 9
2.1.1 Brain Disorders ... 11
2.2 ELECTROENCEPHALOGRAPHY ... 12
2.2.1 Electrode Locations for EEG Recording ... 16
2.3 BRAIN-COMPUTER INTERFACES ... 18
2.3.1 BCI Paradigms ... 20
A) Self-modulated ... 21
3.1 FILTERS ... 33
3.2 FOURIER TRANSFORMS ... 34
3.3 WAVELET TRANSFORM ... 35
3.4 BLIND SOURCE SEPARATION ... 38
3.4.1 Principal Component Analysis ... 39
3.4.2 Independent Component Analysis... 41
3.4.3 Common Spatial Patterns ... 43
3.4.4 Empirical Mode Decomposition... 45
3.5 CLASSIFIERS ... 48
3.5.1 Linear Discriminant Analysis ... 49
3.5.2 Support Vector Machines ... 50
3.5.3 Artificial Neural Networks ... 51
3.6 MEASURING BCI PERFORMANCE ... 53
3.6.1 Sensitivity and Specificity ... 54
3.6.2 Information Throughput ... 55
3.7 SUMMARY ... 56
4 NOVEL APPLICATIONS OF EMPIRICAL MODE DECOMPOSITION IN BCI ... 58
4.1 PROOF-OF-CONCEPT ... 58
4.1.1 Dataset 1 ... 59
4.1.2 Analysis ... 63
4.1.3 Dataset 2 ... 64
4.1.4 Analysis ... 66
4.2 MULTI-VARIATE EMPIRICAL MODE DECOMPOSITION ... 67
4.3 MEMD PERFORMANCE ... 68
4.3.1 Dataset 1 ... 68
4.3.4 Analysis ... 71
4.4 TEMPORAL MULTI-VARIATE EMPIRICAL MODE DECOMPOSITION ... 72
4.5 T-MEMD PERFORMANCE ... 74
4.5.1 Dataset 1 ... 75
4.5.2 Analysis ... 77
4.6 SPATIO-TEMPORAL MULTI-VARIATE EMPIRICAL MODE DECOMPOSITION... 82
4.7 ST-MEMD PERFORMANCE ... 84
4.7.1 Dataset 1 ... 84
4.7.2 Analysis ... 85
4.8 SUMMARY ... 90
5 A NOVEL FORM OF STIMULATION IN BCI ... 92
5.1 TACTILE STIMULATION ... 92
5.2 STEADY-STATE SOMATOSENSORY EVOKED POTENTIALS ... 95
5.2.1 SSSEP Performance ... 97
5.3 NOVEL SSSEP STIMULUS ... 101
5.3.1 Effects of Variable Change on Stimulus Response ... 102
5.3.2 Proposed Novel Stimulus ... 103
5.4 EXPERIMENTAL PROTOCOL ... 104
5.4.1 Characterisation of Stimulus ... 106
5.4.2 Validating the Stimulus Generator ... 108
5.4.3 Equipment ... 115
5.5 ANALYSIS ... 117
5.5.1 Signal Contamination ... 117
5.5.2 Results ... 125
5.6 SUMMARY ... 129
6.1.1 Novel Signal Processing Technique ... 134
6.1.2 Novel Stimulus Paradigm ... 135
6.2 FUTURE WORK ... 137
REFERENCES ... 139
APPENDIX A) ETHICAL APPROVAL FOR SSSEP BCI PARADIGM STUDY ... 156
APPENDIX B) ETHICAL APPROVAL FOR SSSEP BCI PARADIGM STUDY ... 157
APPENDIX C) ETHICAL APPROVAL FOR SSSEP BCI PARADIGM STUDY ... 165
APPENDIX D) ETHICAL APPROVAL FOR SSSEP BCI PARADIGM STUDY ... 169
APPENDIX E) PROGRAMMING CODE FOR SSSEP BCI PARADIGMS ... 171
E.1 STANDARD SSSEP PARADIGM ... 171
E.2 NOVEL SSSEP PARADIGM ... 173
E.3 NEUTRAL SSSEP PARADIGM ... 174
I, Simon R. H. Davies
declare that this thesis and the work presented in it are my own and has been generated by me as the result of my own original research.
I confirm that:
1. This work was done wholly or mainly while in candidature for a research degree at this University;
2. Where any part of this thesis has previously been submitted for a degree or any other qualification at this University or any other institution, this has been clearly stated;
3. Where I have consulted the published work of others, this is always clearly attributed;
4. Where I have quoted from the work of others, the source is always given. With the exception of such quotations, this thesis is entirely my own work;
5. I have acknowledged all main sources of help;
6. Where the thesis is based on work done by myself jointly with others, I have made clear exactly what was done by others and what I have contributed myself;
7. Parts of this thesis have been published by the author: Davies and James 2013a [98], Davies and James 2013b [101], Davies and James 2014a [106], Davies and James 2014b [110], and Davies and James 2014c [137].
Signed:……….
A Brain-Computer Interface (BCI) is a device that uses the brain activity of a person as an
input to select desired outputs on a computer. BCIs that use surface electroencephalogram
(EEG) recordings as their input are the least invasive but also suffer from a very low
signal-to-noise ratio (SNR) due to the very low amplitude of the person’s brain activity and the
presence of many signal artefacts and background noise. This can be compensated for by
subjecting the signals to extensive signal processing, and by using stimuli to trigger a large
but consistent change in the signal – these changes are called evoked potentials. The
method used to stimulate the evoked potential, and introduce an element of conscious
selection in order to allow the user’s intent to modify the evoked potential produced, is
called the BCI paradigm. However, even with these additions the performance of BCIs used
for assistive communication and control is still significantly below that of other assistive
solutions, such as keypads or eye-tracking devices.
This thesis examines the paradigm and signal processing components of BCIs and puts
forward several methods meant to enhance BCIs’ performance and efficiency. Firstly, two
novel signal processing methods based on Empirical Mode Decomposition (EMD) were
developed and evaluated. EMD is a technique that divides any oscillating signal into groups
of frequency harmonics, called Intrinsic Mode Functions (IMFs). Furthermore, by using
Takens’ theorem, a single channel of EEG can be converted into a multi-temporal channel
signal by transforming the channel into multiple snapshots of its signal content in time
using a series of delay vectors. This signal can then be decomposed into IMFs using a
multi-channel variation of EMD, called Multi-variate EMD (MEMD), which uses the spatial
information from the signal’s neighbouring channels to inform its decomposition. In the
processing method based on EMD decomposed both the spatial and temporal channels
simultaneously, allowing both spatial and temporal dynamics to be incorporated into the
resulting IMFs. This is called Spatio-temporal MEMD (ST-MEMD). Both methods were
applied to a large pre-recorded Motor Imagery BCI dataset along with EMD and MEMD for
comparison. These results were also compared to those from other studies in the literature
that had used the same dataset.
T-MEMD performed with an average classification accuracy of 70.2%, performing on a par
with EMD that had an average classification accuracy of 68.9%. Both ST-MEMD and MEMD
outperformed them with ST-MEMD having an average classification accuracy of 73.6%, and
MEMD having an average classification accuracy of 75.3%. The methods containing spatial
dynamics, i.e. MEMD and ST-MEMD, outperformed those with only temporal dynamics, i.e.
EMD and T-MEMD. The two methods with temporal dynamics each performed on a par
with the non-temporal method that had the same level of spatial dynamics. This shows that
only the presence of spatial dynamics resulted in a performance increase. This was
concluded to be because the differences between the classes of motor-imagery are
inherently spatial in nature, not temporal.
Next a novel BCI paradigm was developed based on the standard Steady-state
Somatosensory Evoked Potential (SSSEP) BCI paradigm. This paradigm uses a tactile
stimulus applied to the skin at a certain frequency, generating a resonance signal in the
brain’s activity. If two stimuli of different frequency are applied, two resonance signals will
be present. However, if the user attends one stimulus over the other, its corresponding
SSSEP will increase in amplitude. Unfortunately these changes in amplitude can be very
minute. To counter this, a stimulus generator was constructed that could alter the
of perception and the other was above it, the changes in the SSSEP between classes would
be the same as those between an SSSEP being generated and neutral EEG, with differences
in α activity between the low-amplitude SSSEP and neutral activity due to the differences in
the user’s level of concentration from attending the low-amplitude stimulus.
The novel SSSEP BCI paradigm performed on a par with the standard paradigm with an
average 61.8% classification accuracy over 16 participants, compared to an average 63.3%
classification accuracy respectively, indicating that the hypothesis was false. However, the
large presence of electro-magnetic interference (EMI) in the EEG recordings may have
compromised the data. Many different noise suppression methods were applied to the
stimulus device and the data, and whilst the EMI artefacts were reduced in magnitude they
were not eliminated completely. Even with the noise the standard SSSEP stimulus paradigm
performed on a par with studies that used the same paradigm, indicating that the results
may not have been invalidated by the EMI.
Overall the thesis shows that motor-imagery signals are inherently spatial in difference, and
that the novel methods of T-MEMD and ST-MEMD may yet out-perform the existing
methods of EMD and MEMD if applied to signals that are temporal in nature, such as
functional Magnetic Resonance Imaging (fMRI). Whilst the novel SSSEP paradigm did not
result in an increase in performance, it highlighted the impact of EMI from stimulus
equipment on EEG recordings and potentially confirmed that the amplitude of SSEP stimuli
AAR Adaptive Auto-regressive
AR Auto-regressive
ALS Amyotrophic Lateral Sclerosis
ANN Artificial Neural Network
ATT Absolute Tactile Threshold
BAER Brainstem Auditory Evoked Response
BCI Brain-Computer Interface
BMI Brain-Machine Interface
BOLD Blood-oxygen-level Dependent
BSREC Biomedical and Scientific Research Ethics Sub-Committee
BSS Blind Source Separation
C Central
CSP Common Spatial Pattern
CWT Continuous Wavelet Transform
DHWT Discrete Harmonic Wavelet Transform
ECG Electrocardiogram
ECoG Electrocortiogram
EEG Electroencephalogram
EMD Empirical Mode Decomposition
EMG Electromyogram
EMI Electromagnetic Interference
ERD Event-related Desynchronisation
ERS Event-related Synchronisation
FT Fourier Transform
fMRI functional Magnetic Resonance Imaging
HCA Hierarchical Clustering Analysis
ICA Independent Component Analysis
IMF Intrinsic Mode Function
IMT Intrinsic Mode Type
ITR Information Transfer Rate
LAS Lock-in Analyser System
LDA Linear Discriminant Analysis
LOO Leave One Out
MEMD Multi-variate Empirical Mode Decomposition
MI Motor Imagery
NLMS Normalised Least Mean Squares
O Occipital
P Parietal
PCA Principal Component Analysis
PLS Primary Lateral Sclerosis
PPDA Pre-processing Discriminant Analysis
PSD Power Spectral Density
SCP Slow Cortical Potential
SNR Signal-to-Noise Ratio
SSEP Steady-State Evoked Potential
SSSEP Steady-State Somatosensory Evoked Potential
SSVEP Steady-State Visual Evoked Potential
STFT Short-time Fourier Transform
SWT Synchrosqueezed Wavelet Transform
T-MEMD Temporal Multi-variate Empirical Mode Decomposition
USAF United States Air Force
2.1: A diagram of a neuron. ... 10
2.2: The four lobes of the human brain. ... 11
2.3: An EEG cap fitted with electrodes. ... 14
2.4: An EEG amplifier. ... 14
2.5: A side-view of a person’s head with the 10-20 coordinates overlaid. ... 17
2.6: A top-down view of a person’s head with the 10-10 coordinates overlaid. ... 18
2.7: A plot of the ERD/ERS waveform. ... 21
2.8: Plots of negative and positive SCPs. ... 23
2.9: A plot of the P300 signal overlaid with a plot of neutral EEG. ... 24
2.10: A plot of two different SSEPs. ... 26
2.11: Plots of the N200 signal in response to congruous and incongruous stimuli. ... 28
2.12: Plots of various N400 signals in response to stimuli of varying semantic incongruity. . 29 3.1: The fundamental components of a BCI. ... 32
3.2: An example of axis selection using PCA. ... 40
3.3: An example of the IMFs of a signal decomposed by EMD. ... 46
3.4: A diagram of a neural network. ... 52
4.1: The timing of the MI paradigm used in BCI Competition II, Dataset III. ... 60
4.2: Raw EEG data from an example trial ... 61
4.3: The IMFs produced from the example trial in Figure 4.2 ... 62
4.4: The FFTs calculated from the IMFs in Figure 4.3. ... 62
4.5: The difference between the calculated power of the processed data from channels C3 and C4. ... 64
4.6: The timing of the MI paradigm used in BCI Competition III, Dataset IIIa. ... 65
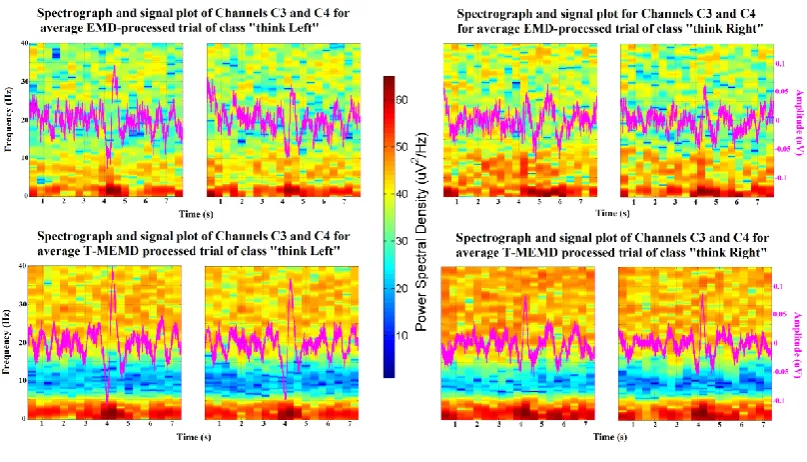
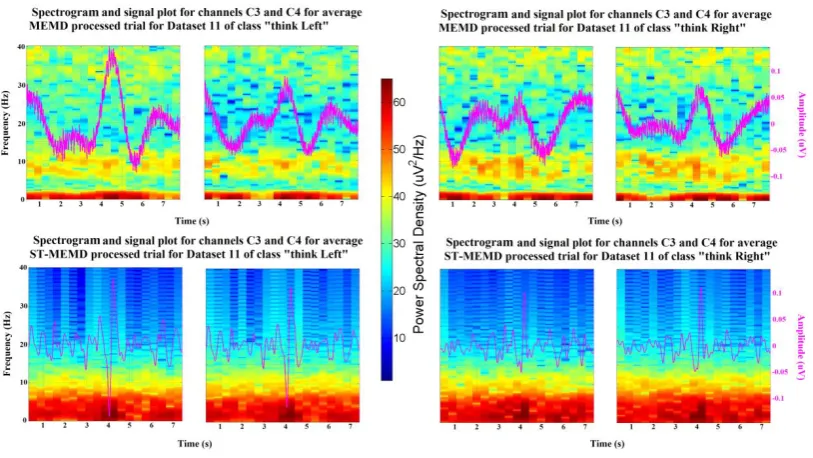
4.9: Spectrograms of the average of the different MI classes processed using MEMD and
ST-MEMD. ... 87
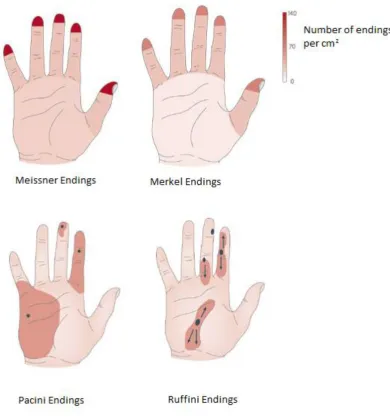
5.1: The relative densities and locations of the different types of nerve endings on the hand. ... 94
5.2: A diagram showing how a modulated wave was created in [118]. ... 96
5.3: The timing of the MI paradigm used in [42]. ... 98
5.4: A plot of how frequency and surface area of the stimulus affected the ATT. ... 103
5.5: The timing of the MI paradigm used in this thesis. ... 104
5.6: A 10mm motor secured to a person’s fingertip using a hook-and-loop cable tie. ... 107
5.7: The circuit diagram of the Arduino board used in the stimulus generator. ... 108
5.8: The modulation wave and its corresponding FFT produced by the stimulus generator. ... 109
5.9: The accelerometer used to record the vibrations by the motors from the stimulus generator. ... 109
5.10: A plot of the vibrations of a single motor at different software settings. ... 110
5.11: FFTs of the plots in Figure 5.10. ... 110
5.12: A plot of the vibration of a single motor at a low software setting and its corresponding FFT. ... 111
5.13: A plot of the motor’s software setting versus the frequency of its vibration. ... 112
5.14: A plot of the motor’s software setting versus the PSD of its vibration. ... 113
5.15: The electrode layout used in this thesis’s experiment according to the 10-10 system. ... 116
5.16: Photograph of the experimental set-up used in this thesis’s study. ... 116
5.17: Plot of a single trial from the experiment with EMI contamination present. ... 118
5.18: IMFs derived from the plot in Figure 5.17. ... 119
5.19: Plot of a single trial from a user wearing a grounding strap with EMI contamination present. ... 119
5.23: IMFs derived from the plot in Figure 5.22. ... 122
5.24: Plot of a single trial from a user wearing a grounding strap after suppressive
capacitors were added to the stimulus generator. ... 123
5.25: IMFs derived from the plot in Figure 5.24. ... 124
5.26: A bar chart showing the classification accuracies of each stimulus method for each participant. ... 126
5.27: A scatter plot of each participants classification accuracies plotted in the order the tests were administered. ... 128
5.28: A bar chart showing the variation in the PSD of the SSSEP for the trials for each hand from a randomly-selected dataset. ... 129
4.1: A comparison of the minimum error rates submitted by different groups from the literature for the data from BCI Competition II, Dataset III. ... 63
4.2: A comparison of the classification rates between MEMD and other signal processing methods for BCI Competition IV, Dataset I. ... 69
4.3: A comparison of the classification rates between MEMD and other signal processing methods for the PhysioNet dataset. ... 71
4.4: A comparison of the performance between EMD and T-MEMD signal processing
methods for the PhysioNet dataset. ... 77
4.5: A comparison of the performance between EMD and T-MEMD signal processing
methods for the PhysioNet dataset using only a single channel. ... 79
4.6: A comparison of the performance between MEMD and ST-MEMD signal processing methods for the PhysioNet dataset. ... 85
4.7 A comparison of the performance between different methods in the literature and the performance in this study for the PhysioNet dataset. ... 88
5.1: The offline classification rates of SSSEPs and the classifier’s optimum time point for the study in [40]. ... 100
5.2: The offline classification rates of SSSEPs and the classifier’s optimum time point for the study in [103]. ... 101
5.3: The software settings’ corresponding vibrational frequency and its PSD for each motor. ... 111
5.4: The recorded details of the participants for the novel study. ... 114
5.5: The results of the novel study for all participants. ... 125
5.6: The results of the novel study averaged with those that share the same noise
suppression methods. ... 127
5.7: Average results of the novel study in comparison to studies that used the same
CHAPTER 1
Introduction
1.1 Motivation
The human body is controlled by the brain, a large interconnected structure primarily made
up of cells called neurons. These neurons can communicate with each other and send
commands to other parts of the body using electrical excitation, either in response to an
external stimulus or consciously generated actions [1]. Brain activity is the combined result
of these electrical excitations and it can be measured using several different devices, such
as an electroencephalogram (EEG) [2]. However damage to the brain, either through
physical trauma or disease, can result in a person being unable to control parts or all of
their body [3]. In the most serious cases they suffer total paralysis and are left with no
means of communication. Using EEG recordings to identify a person’s intent from their
brain activity can offer a limited but vital form of communication in the form of a
Brain-Computer Interface (BCI) that results in an increased quality of life.
A BCI is a device that uses the brain activity of a person as an input to select desired
outputs on a computer [4]. Due to their current low information-throughput and
requirement of specialist technology, BCIs are predominantly only used by patients with
severe paralysis who are unable to operate muscle-based communication devices. This PhD
examines the current state of the field of non-invasive BCIs and puts forward several novel
methods applied to key components of BCIs in order to try and enhance them. Different
of their brain activity, are examined individually and changes to them are proposed and
evaluated.
1.2 Background
Damage to the brain may never be fully healed, depending on the nature and location of
the damage, and a person can find certain bodily functions permanently stripped away
from them. Damage to the spinal cord can also result in a fully functioning brain with the
inability to transmit its commands to the rest of the body. In order to observe a person’s
brain activity the EEG was developed [2]. Using electrodes to detect the brain’s electrical
emissions resulting from mental actions, it could represent them in the form of a signal
recording. Conscious changes in a person’s brain activity that result in a consistent,
identifiable change in their EEG recording can also be used to bridge the gap between
mental command and physical action. This is called a BCI, also known as a Brain-Machine
Interface (BMI).
There are three types of BCI: invasive, partially invasive, and non-invasive. Invasive BCIs
involve implanting electrodes inside the blood-brain barrier [5]. Partially invasive BCIs
require electrodes to be placed inside the skull, but outside the blood-brain barrier [5].
Non-invasive BCIs rely on electrodes placed on the surface of the scalp [5]. Whilst invasive
and partially invasive BCIs receive a much clearer signal due to being closer the signal
source and are less prone to signal contamination, their use requires undergoing surgery.
With non-invasive BCIs, brain activity is obtained as an input using an EEG amplifier
connected to surface electrodes. EEG signals have a very low signal-to-noise ratio as brain
activity is measured in microvolts and is distorted by dense bone, cerebrospinal fluid and
the skull [6] before being measured by the electrodes. As a result many BCIs rely on the
Evoked potentials are significant changes in amplitude or frequency induced as a result of a
stimulus. Stimuli can be visual, auditory, or tactile, or any combination thereof so long as it
results in providing a stimulus to the brain. That nature of the stimuli dictates what area or
combination of areas of the brain will be stimulated, e.g. the source of an evoked potential
in response to receiving visual stimuli would be located in the brain’s vision centre, known
to be in the occipital cortex, under the rear of the scalp. The “paradigm” behind a BCI is the
method it uses to map information onto an evoked potential. Some evoked potentials can
be self-generated, i.e. the brain activity is consciously modulated by the user. These have
the advantage of the BCI needing a very simple paradigm to ascribe intent, e.g. the user
consciously generates an evoked potential every time they want to select an option
highlighted on a computer screen. In contrast reflexive evoked potentials often need
complex paradigms to convey the intent of the evoked potential, e.g. a P300 word grid
using sequences of flashing letters to generate an evoked potential when the desired letter
appears [8].
1.3 Aims and Objectives
The goal of this PhD was to improve the performance of BCI systems, primarily through the
increase of classification accuracy, by examining the components of BCIs and developing
novel variations of them in order to make them more practical as assistive communications
devices, and thereby raise their users’ quality of life. The components in question were the
signal processing component and the BCI paradigm component that is responsible for
generating evoked potentials, and are detailed in the next subsections. Due to the highly
limited access to patients with sub-dermal implants in the UK and at the University of
Warwick specifically, this work focuses exclusively on non-invasive BCIs when it comes to
1.3.1 Development and Application of Novel Signal Processing
Techniques
Even after an evoked potential is generated it still requires processing before it can be
accurately classified. There are many signal and pattern processing techniques that are
applicable to EEG, such as filtering, the Wavelet Transform (WT), Independent Component
Analysis (ICA), etc., each with their own advantages and disadvantages. Once processed, the signals can be submitted to a classifier, an algorithm that will separate the signals into a
pre-selected number of groups based on their properties. Insufficient processing can lead
to a classifier being unable to correctly sort the inputted signals into their respective
groups, causing false positives and negatives. If a BCI is being used for real-time
communication then being able to complete the signal processing and classifying
techniques within a short amount of time becomes an important factor.
The work presented here, covered in Chapter 4, focuses on a method called Empirical
Mode Decomposition (EMD) as it is a purely data-driven method and adapts itself to the
data rather than the user tailoring the process to the signal. Like many signal processing
methods, such as the WT, it divides a signal into time-frequency components but it also
preserves the morphology of the underlying signals masked by other sources and external
noise. EMD is an iterative sifting process that splits a signal into statistically important
frequency bands and residual noise called Intrinsic Mode Functions (IMFs). Novel variations
of EMD were researched and evaluated in this work. As it can be applied to any non-linear
and non-stationary signal, and as frequency is a key component of many evoked potentials,
it is readily applicable to EEG which can be viewed as non-stationary due to its frequency
content changing over time periods usually longer than 0.25 seconds [9]. In this case it was
has a strict left-right divide for limbs depending on their lateral location, i.e. the right
hemisphere of the brain controls the limbs on the left side of the body and vice versa,
giving a clear spatial distribution for evoked potentials. The most significant component of
MI evoked potentials is the suppression of a rhythmic wave, called the µ-rhythm, localised in the 8-13 Hz band in the hemisphere controlling the limb. This frequency-centric evoked
potential made MI ideal for the application of techniques such as EMD.
After evaluating the performance of EMD, novel versions were developed with the goal of
improving its performance. An enhanced version of EMD called Multi-variate EMD (MEMD)
was obtained from the literature that can decompose all channels simultaneously [11]. This
allows each channel to produce the same number of IMFs and for each order of IMF to
occupy the same frequency bands, allowing direct comparisons of each channel’s IMFs for
signal processing. This method was then used to modify single-channel EMD to incorporate
temporal dynamics into the decomposition process - information on how aspects of the
signal such as variance and frequency content change over time. This method was called
Temporal Multi-variate EMD (T-MEMD).
A further enhanced version of T-MEMD, called Spatio-temporal Multi-variate EMD
(ST-MEMD), was also devised. This method was very similar to T-MEMD except that MEMD was
applied to all dynamically embedded channels simultaneously, allowing the process to
incorporate both spatial and temporal information.
The contribution to knowledge from this work was the development of the novel signal
processing method T-MEMD, the development of the novel ST-MEMD signal processing
method, and the discovery of further evidence that the key differences between different
classes of MI are inherently spatial during the evaluation of the aforementioned signal
1.3.2 Development and Evaluation of Novel Stimulus of Evoked
Potentials
In Chapter 5, after the extensive novel work on signal processing through the use of EMD,
focus moved to development of the paradigm side of the BCI field. BCIs using tactile stimuli
were investigated due to them being more practical as they leave the visual and auditory
channels clear, and because it is a promising area of research compared to the other types
of stimuli. Conventional tactile BCIs use a vibrotactile transducer on each hand, operating
at different frequencies. Both stimuli produce resonance frequencies visible in the user’s
brain activity. When the user attends to one transducer over the other, its resonant
frequency comes to dominate over the other one in terms of amplitude.
The novel tactile BCI devised here worked similarly, except that the transducers operated
at the same frequency but significantly different vibrational amplitudes in an attempt to
have one transducer vibrate at such low amplitude that it was similar to no stimulus being
applied at all, but still distinctive compared to neutral EEG recordings. This was so as to try
and produce evoked potentials from each hand that had same ease of differentiation as a
single evoked potential from one hand and no evoked potential from the other, rather than
differentiating between two similar evoked potentials.
The contribution to knowledge from this work was the strong indication that the
hypothesised changes to the BCI paradigm did not result in an increase in performance. The
study is not conclusive due to the potential compromising of the data by an
electromagnetic artefact. Several counters to this artefact were implemented with varying
degrees of success, indicating that other tactile BCI studies in the literature could
potentially have been affected by the same artefact unknowingly as it occupies the same
1.4 Thesis Structure
Following this introductory chapter a review of the literature is carried out, beginning in
Chapter 2 with a background on brain activity, the recording of these biosignals, and the
development of BCIs and their associative paradigms. In Chapter 3 an overview of the most
prominent signal processing techniques used in BCI and their respective performances is
provided. Next the development of the novel signal processing methods T-MEMD and
ST-MEMD is detailed and the methods are evaluated alongside existing forms of EMD in
Chapter 4. Chapter 5 covers the design and implementation of a novel tactile BCI paradigm
and its resulting performance in comparison with the standard tactile BCI paradigm.
Chapter 6 deals with the conclusions drawn from the work in this thesis and how well its
objectives were met. Following that are the references and relevant appendices.
1.5 Publications
S.R.H. Davies, and C.J. James, “Multi-Channel Empirical Mode Decomposition in Brain-Computer Interfaces,” 7th IEEE EMBS UK and RI Postgraduate Conference in Biomedical Engineering and Medical Physics, pp. 21, July 2013.
S.R.H. Davies, and C.J. James, “Novel use of empirical mode decomposition in single-trial classification of motor imagery for use in Brain-Computer Interfaces,” 35th Annual International Conference of the IEEE EMBS, pp. 5610-5613, July 2013.
S.R.H. Davies, and C.J. James, “Using Empirical Mode Decomposition with Spatio-Temporal Dynamics to Classify Single-Trial Motor Imagery in BCI,” 36th Annual International
Conference of the IEEE EMBS, pp. 4631-4634, September 2014.
CHAPTER 2
Origins and Physiology behind EEG and
BCI
This chapter will cover the origins and physiology behind EEG signals, such as the basic
components and functions of the brain and the more common signals it generates. EEG is
an accessible technology that allows the recording of these brain signals. The accurate
interpretation of consistently occurring changes in brain activity allows us to successfully
classify mental states and tasks. These could then be mapped to assistive control systems,
be used to help diagnose the conscious state of a person suffering trauma to the brain, or
used to provide feedback to a patient going through physical rehabilitation.
2.1 The Brain
The brain is the most complex organ in the human body. The primary component of the
brain is the neuron, depicted in Figure 2.1, with 100 billion of them present and each
connected up to 1000 of its neighbours. They are made up of three parts:
Soma – the main cell body responsible for keeping the neuron alive.
Axon – a long thread capable of transmitting an electrical excitation.
Dendrites – small branches of nerve endings that allow the neuron to communicate
Fig. 2.1: A neuron consists of a cell body or “soma”, dendrites and an axon that ends at a terminal [1].
Neurons can transmit information through electrical excitation. It is this transmission of
information that allows the brain to carry out functions such as storing memories or
controlling limbs. There are specialised types of neurons such as sensory neurons for
receiving stimuli and motor neurons that activate muscles in response to a command from
the brain. Neurotransmission occurs when the neuron’s electrical membrane potential
rapidly changes [1]. Membrane potential is the difference between the electric potentials
outside the cell and inside it. A sudden inflow of Sodium ions causes this change, resulting
in the emission of Potassium ions afterwards to equalise the membrane potential. This
neuronal firing results in the sending of neurotransmitters to other neurons.
Like all vertebrate brains, it is divided into a forebrain, midbrain and hindbrain. The
forebrain makes up the majority of the brain and consists of the cerebrum, which itself can
be divided into several lobes. Figure 2.2 shows how the cerebrum is split into two
Fig. 2.2: The human brain divided into four lobes, each with unique functions [12].
the Frontal lobe, which is associated with activities such as planning and reasoning.
At the rear of the Frontal lobe lies the sensorimotor area that controls conscious
limb movement.
the Parietal lobe, which is used to process many sensory inputs such as touch, taste
and heat.
the Occipital lobe, which is responsible for processing visual input.
the Temporal lobe, which is associated with memory and emotion. At the top of
the Temporal lobe lies an area responsible for processing auditory input.
2.1.1 Brain Disorders
Damage to the brain can result in various neurological disorders; these can arise due to
disease or trauma. There are many types of neurological disorders, with epilepsy being the
most common, including Alzheimer’s, Cerebral Palsy, Huntington’s, Multiple Sclerosis,
Narcolepsy, and Tourette’s, all with a wide array of symptoms and causes. Some disorders
result in semantic and motor impairments, despite the appropriate biological apparatus
Apraxia – the inability to execute conscious movements despite the appropriate
muscles being intact.
Dysarthria – the inability to properly execute movements specifically involving the
muscles used in speech despite them being intact.
Dysgraphia – the inability to express language in its written form.
There are also disorders that specifically affect motor neurons, which can lead to several
forms of paralysis:
Amyotrophic lateral sclerosis (ALS) – the degeneration of upper and lower motor
neurons leading to the loss of all control over voluntary movements.
Primary lateral sclerosis (PLS) – the degeneration of lower motor neurons leading
to the loss of all control over voluntary movements.
In the case of initiating movement, upper motor neurons in the cerebrum transmit
information to lower motor neurons in the brain stem and spinal cord. All of the above
disorders would result in impairment in the patient’s ability to communicate, and for the
more extreme cases even specialist communication equipment such as eye-gaze detection
[13], a device that tracks where a person’s pupils are pointing in relation to a screen for the
purposes of selecting control inputs, would be unusable. Brain disorders are an issue that
can seriously impact the quality of life of those who suffer from them. For the detection
and diagnosis of brain functions, tools are needed that are able to detect brain activity.
2.2 Electroencephalography
The EEG is the recording of the brain’s electrical activity at the scalp and was first achieved
by Hans Berger in 1924 [2]. The energy of the ions resulting from groups of pyramidal
the most common. EEG measured from the cortical surface but outside the blood-brain
barrier is called an electrocortiogram (ECoG) [14]; whilst EEG measured from within the
brain using depth electrodes is called an electrogram [15]. Both of the latter forms of EEG
require removal of a section of the skull and invasive surgery, and are therefore tightly
regulated to protect the patients’ health, despite the improved signal quality that comes
from being closer to the source and having fewer obstructions. Modern EEGs tend to use
chlorided silver electrodes placed on the scalp to record the changes. Surface EEGs can use
passive or active electrodes, with active electrodes having an amplifier placed within the
electrode to eliminate noise from skin impedance, and cable and connector movements
[16].
EEGs measure the changes in voltage potential in respect to a reference channel. The
reference channel should ideally be affected by voltage changes that impact all other
channels, but not impacted by any localised changes. It should also not be affected by
external noise from non-neurological sources. This allows it to act as a baseline that
highlights localised changes in the other channels. Early EEGs produced an analogue output
by tracing the signal on paper. Modern EEGs tend to produce a digital output that needs a
set sampling frequency, Fs, which refers to how many samples per second the EEG is recording. Typically the sampling frequency should be at least twice the highest frequency
of interest to prevent aliasing [17]. An example of an EEG cap and an EEG amplifier can be
Fig. 2.3: gtec g.GAMMAcap for fitting electrodes on a person’s scalp with g.LADYbird electrodes applied [18].
[image:31.595.156.476.489.691.2]Berger [2] discovered a rhythmic wave in the 8 – 13 Hz frequency band that he named the
α wave. This is regarded as the brain’s “idle” signal, present when no significant action is taking place, and is strongest around the occipital lobe. There is also a variant centred on
the motor cortex called the μ-rhythm. This rhythm is also strongest when no motor actions are being performed.
A large proportion of the brain’s activity is made up of several rhythmic waves centred on
specific frequency bands. Overall these are:
α/Alpha waves lie within the 8 – 13 Hz range and occur during relaxation when no significant activity is occurring.
β/Beta waves occur between 13 – 40 Hz, are produced during concentration and heightened alertness.
θ/Theta waves are produced during light sleep and dreaming, they occur between 4 – 7 Hz.
δ/Delta waves are the slowest of the brain waves occurring between 0.5 – 4 Hz during deep sleep or unconsciousness.
Due to the sensitivity of EEG, many non-neuronal signals can be detected. These are called
artefacts and can range from electrocardiographic (ECG) activity from the user’s heart to
large electrical devices operating nearby. Artefacts make up a large proportion of EEG
readings. Muscle movements can easily generate ten times the amplitude of any neural
activity. Small actions such as blinking, frowning or clenching one’s jaw can cause large
spikes of electromyographic (EMG) activity to occur in EEG readings, obscuring the brain
activity it is meant to detect. Small movements from unsecured electrodes will also cause
large artefacts in EEG readings. The combination of being placed outside the skull, neural
activity’s low amplitude and the amount of artefact contamination means that EEG
2.2.1 Electrode Locations for EEG Recording
Herbert Jasper was appointed by the First International EEG Congress in 1947 to develop a
standardised way of placing electrodes [20]. The criteria for such a method were as follows:
1. Electrode locations must be proportional to the size of the person’s head.
2. The possible electrode locations should adequately cover all areas of the head.
3. Location names must use biological references instead of purely arbitrary labels.
4. Electrode locations should try to be over a single cortical area of the brain.
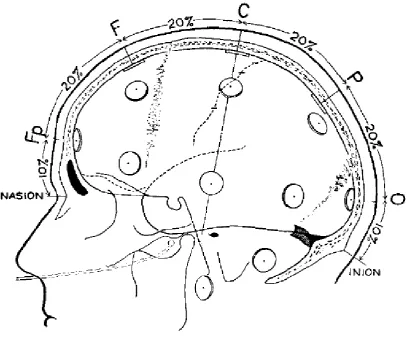
In 1949 Jasper proposed the 10-20 system to the Second International EEG Congress. This
system used the distance between the subject’s nasion and inion as a reference for
longitudinal measurements, and the distance between the subject’s Central coronal plane
for lateral measurements, as shown in Figure 2.5. Along the nasion-inion line, five points
were identified that marked out the position of imaginary lines that divided the brain into
lateral segments. These were called the Frontal Pole (Fp), the Frontal (F), the Central (C),
the Parietal (P), and the Occipital (O). Crucially, these positions were spaced out 20% of the
nasion-inion distance from their neighbour. The lateral co-ordinates increased numerically
Fig. 2.5: A side-view of a person’s head with the 10-20 coordinates overlaid, demonstrating how electrode sites are spaced
using percentage values of the length of the person’s scalp [20].
For example, the position Cz is exactly 50% of the nasion-inion distance, making it
equidistant from the nasion and inion. The ‘z’ indicates that it is offset laterally 0% of the Central coronal line, making Cz the exact centre-point of the scalp.
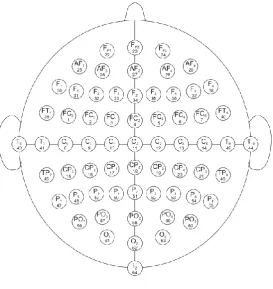
In 1985, as EEG amplifiers advanced and studies were using more electrodes for greater
spatial resolution, a 10-10 system was proposed [21], shown in Figure 2.6. It functioned
much in the same way as the 10-20 system except it used 10% increases in distance,
creating four new points along both the nasion-inion and Central coronal lines, allowing for
Fig. 2.6: A top-down view of a person’s head with the 10-10 coordinates overlaid. This allows for up to 64 electrodes to be
placed on a person’s scalp [22].
With surface EEGs becoming more practical and being shown to be able to robustly detect
identifiable brain activity it was considered if they might be able to bridge the gap between
thought and action for those suffering motor neuron damage [23].
2.3 Brain-Computer Interfaces
A BCI, also called a Brain-Machine Interface, is a device that uses the brain-activity of a
person as an input to select desired outputs on a computer [4]. The concept of a BCI was
first proposed in 1973 by Vidal [23] who suggested that consistent responses to stimuli in
brain activity, called evoked potentials, could be used to convey information or intent that
could then be used to control other devices.
An evoked potential, also called an evoked response or event-related response, can be
neurological conditions that result in the demyelination of neural pathways, such as
Multiple Sclerosis [24]. Evoked potentials still have very small potentials, but their
consistent morphology and time of appearance allow them to be isolated. Vidal’s pilot
study used a stimulus that could provoke a consistent evoked potential that was distinctive
in EEG readings regardless of the brain’s current state, and had a voluntary attention
component so that the user could select which evoked potential to generate at will.
Vidal suggested complementary images for a stimulus. These images consist of two distinct
features that could be combined to form a new image and viewed individually. In this case
he suggested using a grid comprised of vertical and horizontal lines. The user would focus
on either the vertical or horizontal lines, perceptually bringing the lines into their
foreground and pushing the other into the background. He also noted that the local origin
of the evoked potential in the brain would need to be identified for the purposes of
electrode placement. Fortunately neurophysiology has helped map the areas of the brain
primarily responsible for processing the different forms of external stimuli. If a stimulus is
visual, it will generate an evoked potentialover the Occipital lobe, where the O band on the
10-20 system is located. If it is auditory the evoked potential will be centred on the
auditory cortex on the sides of the head, located at T7 and T8. A tactile stimulus will
generate an evoked potential that can be best detected over the sensorimotor cortex,
located at the central C and CP band on the 10-20 system. Vidal also noted the low SNR of
EEG due to artefacts and background noise and the need for intensive signal processing
before attempting to classify the signal.
Since then all BCIs have had the same basic structure of triggering an evoked potential in
the user, either with an external stimulus or self-modulation, recording these evoked
potentials using an EEG, signal processing to extract a set of features representing the
is done the possible classification groups can be mapped to any arbitrary set of controls
that have the same class of choice.
2.3.1 BCI Paradigms
There are several paradigms used in BCIs to ascribe intent to an evoked potential. These
can be divided into a) Self-modulated evoked potentials, and b) Reflexive evoked potentials
[25]. Self-modulated evoked potentials are those that are generated by the conscious
mental actions of the user. It is much easier to ascribe intent as they are only meant to
appear when the user wants them to, e.g. when their desired selection option is
highlighted on a computer screen. They are much less prone to causing false positives as
they will not be accidentally triggered by external stimuli. However they require a much
longer training period so that users can consistently cause the change on demand. They are
also slower as a user may need up to several seconds lead time before the change in brain
activity is fully realised. A BCI that uses self-modulated evoked potentials is also known as
an asynchronous BCI, as the inputs are not spaced regularly by the arbitrary display time of
a stimulus [25].
By contrast a BCI that uses reflexive evoked potentials needs little to no training as the
changes are automatic. There has to be some method that allows the changes to be
associated with an intent, such as having an option presented with an accompanying visual
stimulus that triggers an evoked potential when the user looks directly at it. They typically
have a much lower specificity rating as they can be unintentionally triggered by external
stimuli. A BCI that uses reflexive evoked potentials is also known as a synchronous BCI, as
A. Self-modulated
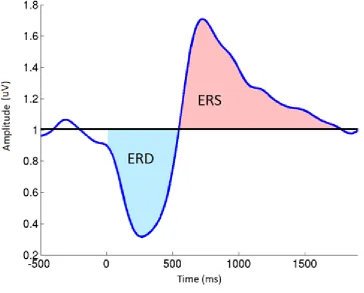
Motor Imagery (MI): this paradigm exploits the left-right divide of the brain and
limb control. Imagining moving a limb and physically moving a limb produces the
same brain activity. When a person imagines moving a limb on the left side of their
body there is heavily localised activity on the right side of their sensorimotor cortex
and vice-versa [26]. This activity also occurs within specific frequency bands. A
rhythmic signal in the 8-13 Hz band called the µ-rhythm will be suppressed on the contralateral side of the motor cortex. This may also result in resonance activity in
the 20 Hz band. At the onset of MI there will be a large event-related
desynchronisation (ERD) and event-related synchronisation (ERS) of brain activity
[image:38.595.162.527.399.692.2]that takes approximately one second as depicted in Figure 2.7 [27].
Fig. 2.7: A plot showing the distinctive waveform caused by ERD/ERS just after the user consciously initiates MI at time 0
MI was first used as the basis of a BCI paradigm by Wolpaw et al. [29] in 1990. To show that people could modulate their own µ-rhythms reliably and rapidly enough to be used to give commands to a computer, they constructed an experiment
where a mouse cursor on a screen moved up in response to an increase in
amplitude in the µ-rhythm and down in response to a decrease. Five participants were recruited and told to guide the cursor to a target on a screen. They used the
strategies of relaxation to make the cursor move upwards, and imagined physical
activities to make the cursor move downwards, corresponding to the knowledge
that the µ-rhythm is suppressed during imagined movements. One participant was unable to master the concept and dropped out, but the remaining four achieved an
average of 89.5% accuracy.
In 1996 the Graz BCI group expanded the idea to make use of multiple parts of the
body [30]. Instead of choosing between imagined movement and no imagined
movements, they created a three-class paradigm that differentiated between the
imagined movement of the left index finger, the imagined movement of the right
index finger, and the imagined movement of the right foot. Their four participants
only achieved an average accuracy of 60%, highlighting the difficulty of
distinguishing between the different µ-rhythm responses to imagined movements, as well as the decrease in accuracy that comes from the classifier having more
states to choose from.
Pfurtscheller and Neuper 2001 [25] improved on their work at Graz with a new MI
BCI that used algorithms to objectively select the statistically most relevant
frequencies and electrode channels, as well as reducing the imagined movement
movements. This BCI was used by a tetraplegic patient for four months, who
achieved 60% accuracy at the outset before progressing to an average of 90%.
Slow Cortical Potentials (SCPs): this paradigm is based on detecting an overall
decrease or increase in the voltage of the EEG due to a decrease or increase
respectively in the excitability thresholds of large groups of neurons [31], shown in
Figure 2.8. Users can train themselves to focus their attention to trigger a negative
SCP or train themselves to relax in order to trigger a positive SCP. This can take
several months of training and SCPs can take up to 3 seconds to present in EEG
readings, making them slow in comparison to other evoked potentials. As SCPs are
an overall change in the brain’s state it can be detected universally throughout the
scalp.
Fig. 2.8: Plots showing negative and positive SCPs, distinguished by the overall negative or positive change in amplitude of the
EEG activity [32].
SCPs were pioneered by Birbaumer’s group in 2000 [33] as an assistive
communications device for ALS patients with the detection of an SCP being used to
select letters from within groups. Of the five patients, three achieved reliable
average it took 28 trials to select a single letter, with one letter being selected
every two minutes. The inefficiency of the paradigm has led to very little follow-up
research.
B. Reflexive
P300: The P300 is a positive change in amplitude that peaks on average around
300ms after the stimulus that triggered it was received, as shown in Figure 2.9, and
is associated with recognition and categorisation [8]. It is triggered upon the
reception of a rare but expected stimulus, e.g. a low pitched tone played during a
group of high-pitched tones, and can be detected along the central-parietal area of
the brain. Intent can be ascribed to its occurrence using a P300 Speller. A word grid
is displayed on a computer screen with each row and column flashing individually
in a random order. The user focuses on the letter they would like to select. When
the row or column containing that letter flashes it triggers a P300 response.
Knowing what row and column was flashing at the time of the P300 waves allows
one to identify the letter the user was focusing on.
expected stimulus. It is characterised by a large positive change in amplitude that peaks approximately 300 ms
after the stimulus occurred at time point 0 seconds. The blue represents neutral EEG.
The P300 Speller was first proposed by Donchin’s research group [34] in 1988. Four
volunteers were tested to see how long on average the Speller had to cycle
through its 6 x 6 word grid for the participants to achieve 85% accuracy. These
times varied between 15 and 36 seconds. This work was continued by Donchin’s
group with a larger-scale test involving ALS patients [35]. Beforehand it was
concluded that the word grid needed to be reduced in size, to 4 x 4, to improve
accuracy by reducing the number of classes that the classifier had to distinguish
between. Nine of the fifteen patients were able to achieve accuracy rates of 75% or
greater.
There is a large amount of research on P300 Spellers due to the BCIs’ immediate
practical applications in assistive communication. Its performance is also highly
dependent on the structure of the paradigm. Decreases in the inter-stimulus time
means the Speller can cycle through all the possible options faster, but may result
in a weaker P300 being elicited. A smaller word grid means a decrease in the
amount of options to choose from but also a smaller number of groups to be
correctly classified. Letters adjacent to the letter being attended to can generate
weak P300s when they are highlighted, leading to false positives. Townsend et al.
2010 [36] tested a paradigm where instead of flashing rows and columns, an
algorithm selected six squares on an 8 x 9 word grid in such a way that it ensured
no two adjacent sqaures would flash at the same time. After testing both a
standard and their novel P300 Spellers, they found their novel method resulted in a
marked increase in classification accuracy, from 77% up to 92%, and the amount of
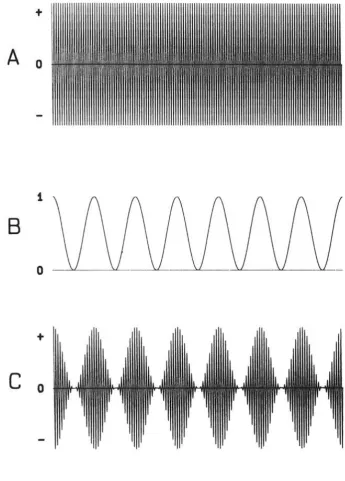
Steady-State Evoked Potential (SSEP): An SSEP is a resonance-based signal
generated in response to a frequency-based stimulus [37], e.g. staring at a light
flashing at 10 Hz will induce a resonance signal at 10 Hz and 20 Hz, as shown in
Figure 2.10. Its location in the brain is predicated on what type of stimulus is being
used. A visual based stimulus means the SSEP will be detected over the occipital
lobe, whilst a tactile based stimulus means it will occur over the sensorimotor
cortex. Intent can be ascribed by mapping specific frequencies to specific actions,
such as making a button flash at 15 Hz and executing the function mapped to it
when a 15 Hz SSEP is detected, as that means the user must be looking at the
button.
Fig.2.10: A plot showing SSEPs of two different frequencies and their accompanying resonance frequencies.
Attending to different stimuli will result in SSEPs of different frequencies allowing the user’s current area of focus to
SSEPs were first used as a diagnostic tool. For example, new-born infants are
unable to give vocal feedback on auditory tests, so a Brainstem Auditory Evoked
Response (BAER) test can be performed to test the function of their nervous
system [39]. If a tone is played and its corresponding SSEP is present in the infant’s
EEG recordings, then it can be concluded that the pathways from the ear to the
auditory cortex are functioning.
Using them as a method of control in the form of a BCI was first proposed as part of
the United States Air Force’s (USAF) Alternative Control Technology research
programme in 1995 [40]. Lights behind the screen of a flight simulator flashed at a
rate of 13.25 Hz. If the resulting Steady-State Visual Evoked Potential (SSVEP)
increased in magnitude the simulator would bank to the right, if it decreased it
banked to the left. Participants were able to achieve over 80% accuracy.
The USAF’s research continued with an SSVEP BCI being developed in 2000 [41].
This BCI paradigm made use of two virtual buttons on the left and right sides of a
computer screen flashing at different frequencies with participants required to
fixate on the button indicated. Out of 200 trials participants achieved an average of
92% accuracy.
As mentioned beforehand, SSEPs can be generated by any form of constant stimuli.
Pfurtscheller’s group evaluated an SSEP BCI that relied on a tactile stimulus to
generate Steady-State Somatosensory Evoked Potentials (SSSEPs) [42]. Vibrotactile
stimulators applying vibrations of different frequencies to each hand produced two
SSSEPs of different frequency in the EEG recordings. By focusing on one hand over
vibrations being applied to the hand they were focusing on, with eight participants
achieving an average of 70% accuracy.
N200: The N200 is related to cognitive processing and is a negative change in
amplitude that on average peaks 200ms post-stimulus, as shown in Figure 2.11.
The most common stimulus that triggers it is incongruent groupings as shown in
the Eriksen flanker task [43]. The Eriksen flanker task is when a target stimulus is
flanked by either matching or mismatching stimuli. For example, with “<<<<<”, the
centre target stimuli of “<” is flanked by matching stimuli, but in “>><>>” it is
flanked by mismatching stimuli. This incongruent grouping triggers an N200
response around the central anterior area of the scalp. Intent can be ascribed by
N400: The N400 is similar to the N200 in that it is triggered by incongruent stimuli,
however the key difference is that the stimuli must be semantically incongruent,
e.g. “I take coffee with cream and dog” instead of “I take coffee with cream and
sugar” [45]. The dissimilarity of the word from the rest of the sentence, both in
phonics and in context, will increase the change in amplitude of the N400 response.
The N400 peaks around 400ms post-stimulus. The N400 evoked potentials’ and the
above N200 evoked potentials’ lack of distinctness compared to other “oddball
paradigm” responses such as the P300 means that few BCIs used them as the basis
of their paradigm.
Fig.2.12: A plot showing several different N400 waves occurring approximately 400 ms after different semantic
These paradigms show how evoked potentials can be triggered at will via conscious effort
by the user. However, EEG’s low SNR mean that they are still difficult to detect in raw EEG
readings.
2.4 Summary
The brain is a complex organ that is still not entirely understood. Repairing damage can be
beyond the abilities of the body and medicine. This can lead to deficiencies in the brain’s
processes, resulting in the loss of certain bodily functions such as speech or muscle control.
EEG can be a tool to diagnose a person’s brain functions and act as a bridge between
mental commands and their corresponding actions if the recorded brain activity can be
correctly interpreted with a BCI.
BCI research is still in its infancy, hampered by the technology and the resulting noisy
signals. Ingenuity has to be employed in order to exploit changes in brain activity to convey
information from mental actions to the outside world. Reflexive evoked potentials have the
advantage in that there is no uncertainty over whether the user is performing the task
correctly, as the mechanism of generating the evoked potential is not within their control,
only the choice of when to experience the stimulus that triggers the evoked potential is.
However, even the most distinct evoked potential is still relatively weak and masked by a
multitude of a noise and other signal sources. Intensive processing of the EEG recordings is
CHAPTER 3
Signal Processing in EEG for BCI
Signal processing, in the context of digital signals, is the application of mathematical
functions and operations on vectors of data points recorded electronically from a source.
This can include transforming the signal from its amplitude-time domain to a new domain
to better represent its properties, or the identification of thresholds which can be used to
separate desirable data from undesirable data. This chapter covers a multitude of
prominent signal processing techniques in the literature that are usually applied to EEG in
this context.
EEG recordings are the combined result of multiple underlying sources and artefacts. As
mentioned in Chapter 2, artefacts are signals produced by non-neurological sources. There
are physiological artefacts that are generated within the body, such as energy from muscle
movements, and there are extra-physiological artefacts that come from external sources,
such as the electrical mains powering the EEG amplifier. The beating of the heart, the
person’s pulse, eye blinks, poor electrode contact, electrode lead movement, and electrical
devices in the vicinity of the electrodes can all be sources of artefacts [47]. These artefacts’
comparatively high amplitude relative to EEG is the reason why EEG has a very low SNR.
This mix of signals is referred to as the “cocktail party problem” [48], the analogy being that
identifying one neurological signal out of the mixed signals found in EEG is similar to
identifying one speaker over the background conversation of a party. Applications of signal
processing techniques in EEG encompass a range of methods that can be used to suppress
generating evoked potentials is in part because it results in the EEG containing a consistent,
distinct signal. Once a set of features representing these evoked potentials has been
extracted using signal processing, they can then be classified to form the final output in a
BCI control system, shown in Figure 3.1. These classifiers sort the trials from BCI systems
into pre-designated groups. A BCI system with adequate signal processing should perform
with a high degree of classification accuracy.
Fig 3.1: The fundamental components of a BCI. The recorded EEG data must be processed in order to highlight the unique
features of the evoked potential and then classified.
There are two approaches to signal processing: removing or extracting signal data based on
known quantities, and removing or extracting signal data based on unknown quantities.
The former relies on knowing the properties unique to the signal you wish to extract, such
as frequency or morphology. The latter is based on maximising statistical differences
between each class of signal. This is called Blind Source Separation (BSS) and has the
advantage of forgoing any a priori knowledge of the signals recorded. Due to EEG’s non-stationary manner and it being the result of multiple unknown underlying sources, BSS is a
field of signal processing that is highly applicable in processing EEG.
Depending on the EEG’s sampling frequency, signals of frequencies in the hundreds of Hz
can be recorded. However the vast majority of neurological signals are below 50 Hz in
terms of frequency. Filters make a good starting point for removing large quantities of
3.1 Filters
With the multitude of signals that make up a person’s brain activity, such as the
ever-present α rhythms, muscle artefacts, etc., it makes sense to initially apply a filter to excise data not immediately at the frequency domain the desired evoked potential is located in,
though there is the danger of accidentally discarding subtle signals relevant to the evoked
potential [49]. Filters can be applied to signals in several ways:
High Pass filter – Frequencies below a specified level are attenuated and
frequencies above a certain level are passed over.
Low Pass filter – Frequencies above a specified level are attenuated and
frequencies below a certain level are passed over.
Band Pass filter – Frequencies within a specified, contiguous range are passed and
frequencies above or below that range are attenuated.
Band Stop filter – Frequencies within a specified, contiguous range are attenuated
and frequencies above or below that range are passed over. A Notch filter is a Band
Stop filter with a very narrow specified frequency band.
The cut-off point of the frequencies is not instantaneous. The slope of the frequency plot
determines how fast the transition is and is influenced by the order of the filter [49]. The
order of the filter refers to the order of polynomial the filter can be written as. Having too
high an order filter will warp the phase of the original signal. However, filtering by itself is
usually insufficient to prepare a signal for classification as even a narrow frequency range
will contain a multitude of signals. Frequency content needs a more detailed
representation for the signal to be properly analysed along this variable, which leads to the
3.2 Fourier Transforms
An FT converts a signal from the time domain to its frequency domain, so instead of a
standard signal plot of time versus amplitude it produces a frequency versus power plot.
Squaring the magnitude of the FT obtains the signal’s Power Spectral Density (PSD),
providing an estimation of the power per Hz for each frequency component of the signal
[50]. This is extremely useful for seeing which frequencies are most prominent in the signal
epoch the FT was calculated from. For example, to confirm the presence of an SSVEP you
would expect to see a peak in the FT at the same frequency as the stimulus.
There are different types of FT, with the FFT finding much use in signal processing due to
how much faster it is to calculate than the original FT. The FFT’s assumption that the signal
is periodic allows the calculation of the FT to be factorised, resulting in a decrease in the
number of operations by several orders of magnitude [51]. Short-time Fourier Transforms
(STFTs) can be used when an increased temporal resolution is required. It is similar to an FT
except that it is applied to individual parts of a signal after it has been divided into
segments small enough that they can be treated as stationary signals [52].However the
length of the segments can limit the STFT’s frequency resolution if they are too short, and
limit the STFT’s temporal resolution if they are too long.
STFTs are a key component of spectrograms, a useful tool for analysing EEG signals.
Spectrograms are a 3D plot of time vs PSD vs frequency. This can be useful in BCI paradigms
that rely on a stimulus as we can see the change in power of rhythmic waves over time,
such as how we would see the power in the µ-rhythm decreasing in certain channels after the onset of MI [26]. However, spectrograms and FTs in general are still limited by their low
temporal resolution. A method that could have a high temporal resolution without
![Fig. 2.3: gtec g.GAMMAcap for fitting electrodes on a person’s scalp with g.LADYbird electrodes applied [18]](https://thumb-us.123doks.com/thumbv2/123dok_us/9522462.457612/31.595.156.476.489.691/gammacap-fitting-electrodes-person-scalp-ladybird-electrodes-applied.webp)