warwick.ac.uk/lib-publications
Original citation:
Zhang, Hongxia, Wang, Shu, Gong, Yuhan, Liu, Tiegen, Xu, Tianhua, Jia, Dagong and Zhang, Yimo. (2013) A quantitative robustness evaluation model for optical fiber sensor networks. Journal of Lightwave Technology, 31 (8). pp. 1240-1246.
Permanent WRAP URL:
http://wrap.warwick.ac.uk/93879
Copyright and reuse:
The Warwick Research Archive Portal (WRAP) makes this work by researchers of the University of Warwick available open access under the following conditions. Copyright © and all moral rights to the version of the paper presented here belong to the individual author(s) and/or other copyright owners. To the extent reasonable and practicable the material made available in WRAP has been checked for eligibility before being made available.
Copies of full items can be used for personal research or study, educational, or not-for profit purposes without prior permission or charge. Provided that the authors, title and full bibliographic details are credited, a hyperlink and/or URL is given for the original metadata page and the content is not changed in any way.
Publisher’s statement:
“© 2013 IEEE. Personal use of this material is permitted. Permission from IEEE must be obtained for all other uses, in any current or future media, including reprinting
/republishing this material for advertising or promotional purposes, creating new collective works, for resale or redistribution to servers or lists, or reuse of any copyrighted component of this work in other works.”
A note on versions:
The version presented here may differ from the published version or, version of record, if you wish to cite this item you are advised to consult the publisher’s version. Please see the ‘permanent WRAP URL’ above for details on accessing the published version and note that access may require a subscription.
Abstract—Optical fiber sensor networks (OFSNs) are facing
the problem of a lack of systematic evaluation criteria to assess network performance. In this paper, a universal quantitative robustness evaluation model for OFSNs is proposed. The model defines robustness as the mathematical expectation of the monitoring coverage ratio, which has taken into account the performance under all possible network states and the probability of each state. This model is applied to four basic network topologies including line, ring, star and bus topologies, and their mathematical expressions of robustness are derived by analyzing all possible states in detail. Further simulation gives a quantitative comparison among these topologies, proving that the ring and star topologies are optimal for the monitoring of strip-shaped and square regions, respectively. Finally, two influencing factors, the attenuation coefficient and the threshold, are investigated for their impact on the robustness of the network.
Index Terms—Network topologies, optical fiber sensor
networks, robustness, robustness evaluation models.
I. INTRODUCTION
PTICAL fiber sensor networks (OFSNs) have attracted increasing attention with the development of optical fiber sensing technology [1], especially in applications such as security and structural health monitoring [2]. In an OFSN, a number of optical fiber sensors share the same terminal devices, which reduces the cost in hardware as well as other aspects including installation and maintenance. On the other hand, service will be lost when a transmission path is accidentally or maliciously destroyed.
In order to guarantee steady and reliable sensing service, large-scale sensor networks require high “robustness”, which is the ability to maintain system functionality against external and internal interference. Extensive research on the reliability and robustness of OFSNs has been done. Peng et al. propose several large-scale optical sensor networks with self-healing
Manuscript received October 17, 2012. This work was supported by the National Basic Research Program of China under Grant NO. 2010CB327806 and the National Natural Sciences Foundation under Grant NO. 61205085.
H. Zhang, S. Wang, Y. Gong, T. Liu, D. Jia, and Y. Zhang are with College of Precision Instrument and Opto-electronics Engineering, Tianjin University, Tianjin, 300072 China and Key Laboratory of Opto-electronics Information and Technical Science, Ministry of Education, Tianjin, 300072 China (phone&fax: 86-22-27403147; e-mail: [email protected]).
T. Xu was with Tianjin University, Tianjin, 300072 China. He is now with Royal Institute of Technology, Stockholm, SE 16440, Sweden.
function. The network robustness is enhanced by adding
optical switches to novel topologies [3]–[6]. Lopez-Amo and his research team presented a novel optical fiber bus network for the wavelength multiplexing of sensors, which can re-establish service after one or more point failures in the fiber by “dedicated line” or “dedicated path” protection [7-9]. They also reported an amplified optical fiber double-ring network to multiplex optical fiber sensors [10]. The network is designed to be inherently resilient to fiber failures because it enables simultaneous interrogation of all sensors using both rings. Besides, there are many other studies on topologies and architectures which can achieve high robustness for OFSNs [11-13].
Although many studies of quantitative robustness evaluation for wireless sensor networks have been reported [14-16], there are relatively few for OFSNs. Research on robustness for OFSNs thus far is merely focused on designing architectures that have high robustness. No universal method for quantitative robustness evaluation has been proposed. Thus it is difficult to tell how much one topology is superior to another in terms of robustness. It is crucial to establish a model to accurately evaluate these OFSNs. With this robustness evaluation model, we are able to compare the robustness of different OFSNs quantitatively and decide the optimum parameter in the designing of OFSNs for specific applications. Therefore, we believe the topic will become more and more important as the use of OFSNs grows, especially for safety and security applications.
This paper explores into the metric of robustness evaluation for OFSNs. A universal quantitative robustness evaluation model for OFSNs is established. We have applied this model to several basic network topologies, including line, ring, star and bus topologies, respectively, to get more details about the robustness calculation. Simulations are performed to see how environmental settings and influencing factors impact network robustness.
II.EVALUATION MODEL
In reality, sensor detections show increasing uncertainty as the target-to-sensor distance increases. The detection model needs to be expressed in probabilistic terms [17]. In this work, we assume the model given by Eq. (1).
r rsf r e (1)
A Quantitative Robustness Evaluation Model for
Optical Fiber Sensor Networks
Hongxia Zhang, Shu Wang, Yuhan Gong, Tiegen Liu, Tianhua Xu, Dagong Jia, and Yimo Zhang
whererandrsare the locations of the target point Q and the sensor respectively, α is the attenuation coefficient which shows the sensing ability of the sensor under the specific monitoring scenario. Larger α means the monitoring ability decays faster with distance.
Consider an OFSN consisting of n sensors (S1, S2, …, Sn), which is named W. Each sensor has two possible states: working or failed according to whether there is a link failure in its information transmission path. (We ignore the sensor self-fault because the probability is very low.) It can be expressed as:
if the sensor works
if the sensor fails
1,
= , =1,2,...,
0,
i
S i n
(2)
So the state of W can be described by the combination of states of all the sensors: Wk
S Sn, n-1,..., S S2, 1
, k is the ID of each state. For convenience, we regard (Sn, Sn-1, …, S1) as a n-bitbinary number and convert it into decimal format:
1
1
1 2
n i i i
k S
(3)where k is the converted number plus one to make it start from 1 rather than 0. k can be any integer from 1 to 2n and each k corresponds to only one state of W and vice versa.
In network W, a target point Q in the monitoring region is monitored by n sensors simultaneously. The monitoring ability of W at Q can be expressed as:
1 1
i
n n
r r
k i i i
i i
C r f r S e S
(4)which shows the cooperative work of multiple sensors. (In reality the cooperative work of multiple sensors can be realized with algorithms such as Support Vector Machine or Neural Network)
We also define the threshold function Hk
r as:
1
=
0 <
k k
k
C r
H r
C r
(5)
k
H r indicates that when the value of Ck
r at Q is belowthe threshold, we believe the monitoring ability is too low to monitor accurately and the result is regarded as invalid. We call Q a “blind point” of W. In contrary, if the value is above, we think Q can be effectively monitored, point Q is covered by
W.
We use functionA rk
to quantify the performance of W atthe entire monitoring region under state Wk:
( ) /k k
R R
A r
H r d r
d r (6)where R is the monitoring region, namely the complete set of all r. The physical significance of A rk
is the coverage ratioof the sensor network at the monitoring region, that is the area ratio of effectively monitored region to the whole monitoring region, under state Wk.
The probability of occurrence of Wkis denoted byP W
k .We define “Robustness” as the mathematical expectation of the coverage ratio, so it has taken into account the overall performance of W under all states and it can be expressed as:
2
1
n
k k
k
U A r P W
(7)As seen from above, the values of robustness vary in the range of 0 to 1. The coverage ratio A rk
is dependent on themonitoring area, the models and locations of the sensors that
are working under state k.P W
k is related to the topology ofthe network and the broken probability of link fibers. This evaluation model can be used as a quantitative criterion to judge whether an OFSN is robust enough before it is deployed. Conversely, this model can also assist with finding out the optimal sensor densities, network topology and installation scheme with a definite robustness.
III. ROBUSTNESS EVALUATION MODELS FOR BASIC TOPOLOGIES
A.Line topology
The line topology with n sensors requires (n+1) link fibers as shown in Fig. 1. All these sensors are assumed to be backward-reflected and other factors such as power non-equalization of sensors, network capacity limit are not considered. The n sensors are numbered S1, S2, S3, …, Sn sequentially from the one closest to the light source to the other end. Fibers are also numbered with the same rule as F0,
F1, F2, …, Fn, and F0 connects the light source to the coupler.
Suppose the intact probability of Fj
j0,1, 2,...,n
ispjandit can be expressed by the length of Fj : (1 )Lj
j
p p (8)
[image:3.612.317.564.331.428.2]where Lj is the length of Fj , p is the broken probability of an unit length of fiber. Due to the property of line topology, there are only (n+1) possible states for the network, which are numbered Wl , l=0,1,2, …,n. Wl denotes the state of exactly l sensors, including S1, S2, …, Sl working in the network. One could easily get the probability of occurrence of Wl is:
0 1 1 0 0 1 0(1 ) 1, 2,..., 1
l
l l j
j n
j j
p p l
W p p
P l n
p l n
(9)Referring to (3), the relation between k and l
is 1
1
1 1 2 2
l
i l
i
k
. Therefore, the robustness of n-sensorline topology network is:
2 0 l l n Line lU A P W
(10)B.Ring topology
The ring topology with n sensors requires (n+2) link fibers as shown in Fig. 2. Compared to line topology, an additional fiber Fn+1 connects Sn to the coupler to form a loop, leading to transmission path redundancy. The state W2n , in which all
sensors are working, can be achieved either with all link fibers intact, or only one arbitrary fiber other than F0 broken. The
probability of this state is:
1 11 2 0 1 1 n n n t j
t t j
p P p p W
(11)If two sensors Sh and Sl fail, those sensors between Sh and Sl must also fail. The state is denoted by Wh,l , 1≤h≤l≤n, which means sensors Sh, Sh+1, Sh+2, …, Sl fail while others work properly. The probability is:
1 1 1 0 2, 0 0 1 1
1 1
0
1 1 1
1 1 1 1,
1 1 1
h n
h l j j
j j l
h l n
h
h n j
j
p p p p h l n
P W p p p p h l n
p p p h l n
(12)According to the numbering of Wk as mentioned earlier,
Wh,l is equated with , 2 2 1 2 2 1 2
l
n i n h l
k
i h
W k
. Therefore, the robustness of the n-sensor network with ring topology is:
1 1 , 1 1 12 2 2 2 2
1
2
2 2 2
1
0
,
1 1
n n n h l
n
n h l
Loop
h l n
h l n n t j t
h l n
j t
h l
U A W A
A
P P W
A p p p P W
(13)C.Star topology
The star topology with n sensors requires (n+1) link fibers as shown in Fig.3. The sensors are named S1, S2, S3, …, Sn, respectively. F0 connects the light source to the star coupler
while Fi connects the star coupler to Si (i=1,2,3, …, n). Unlike those with line and ring topologies, starlike networks have a network state set including all possible2n states noted in previous general discussion. The probability of occurrence ofWkis:
0 0 1 1 0 11 1 1
1 i 2 2
i n i i n S S n i i i k W
p p p k
P
p p p k
(14)where the values of Si can be extracted from the value of k. Write the value of k-1 in n-bit (if less than n bits then fill with zeros on the left side) binary format, then from right to left, each bit is the value of S1, S2, S3, …, Sn, respectively.
So the robustness of n-sensor network with ring topology is:
2 1 n ar k St k k P W U A
(15)D.Bus topology
The bus topology with n sensors requires (2n+1) link fibers as shown in Fig. 4. For simplicity, we only draw up the first coupler and omit the rest. The n sensors are numbered S1, S2,
[image:4.612.50.513.48.338.2]S3, …, Sn from the sensor with the branch node closest to the
Fig. 4. Bus topology for optical fiber sensors. S1-Sn are optical fiber sensors; F0-F2n are link fibers.
Fig. 2. Ring topology for optical fiber sensors. S1-Sn are optical fiber sensors; F0-Fn+1 are link fibers.
[image:4.612.317.564.494.651.2]light source to the one with the furthest branch node. F0
connects the light source to the first coupler. The branch link fiber between Si (i=1,2,3, …,n) and the bus is named F2i while the bus link fiber connecting the branch nodes of Si-1 and Si is
numbered F2i-1. Similar to the star network, all
possible 2n
states may occur in the bus topology. The probability is:
10 0
0 2 1 2 2
i=1
(1 ) (1) 1
1 Si 1 Si 2,3, 4,..., 2n
i m k
i i
p p f k
P W
p p
f h p p k
(16)wheremmax(i S i),i1, 2,3,...,n, which means m is the maximum sensor number of all working sensors. The way of acquiring the values of Si is the same with the star topology. The function f(l) that appeared in (16) expresses the probability that those (n-l+1) sensors, including Sl, Sl+1,
Sl+2,…,Sn, all fail while other sensors are still available. The recursive formula of f(l) is as:
22 11
22 11
22
1 1 ( 1) 1, 2,3,..., 1
( )
1 1
l l l
n n n
p p p f l l n
f l
p p p l n
(17)
Or the general formula of f(l) can also be given as:
2 1 2 1 2
1
2 1 2 1 2
1
2 1 2 1 2
1 1
1, 2, 3,..., 1 ( )
1 1
1 1 =
n
l j j
j l i n
i j j
i l j l
n n n
p p p
l n
f l
p p p
p p p l n
(18)Therefore, by substituting (18) into (16), we get:
0 01 2 1 2
1 1
2 1 2 1 2
2
0 2 1
i=1
2 1 2
1 1 2 2 h 1 1 2 1 2
2 1 2
2 (1 ) 1 1 =1 1 1 1 1 = 1 1 1 2 2 i i S S n j j j i n
i j j
i j l
m i
n
h j j
k j
i n
i j j
i h j l i i
n
p p
p p p
k
p p p
p p
p p p
p
P
p
p p p
k W
2 1 2 1 2
n 1
0 2 1
i=1 0 2 2 1 1 2 2 1 1 2 2 2 1 i=1 2 2 ( 1) 1
2 1 2
1 1 ( 1 ) i i i i
n n n
i n n n S S i i i i n n S S i k h n p p k p p h
p p p
p p n p p (19)
The robustness of n-sensor network with bus topology is:
2 1 n k Bus k kU A P W
(20)So far, we have presented the robustness evaluation models of several basic topologies. Through the superposition or expansion of these models, we can establish comprehensive evaluation model for complex OFSNs.
IV. PERFORMANCE EVALUATION A.Impact of environmental settings
As has been demonstrated in Part 3, network topology has
an impact on the occurrence probability of Wk thus
significantly affects the robustness. Fig. 5 shows a comparison of these four topologies with N (1~20) sensors in terms of robustness under a strip-shaped area monitoring situation. The monitoring area consists of N 20×20cm2 square areas aligned
in a row, each with a sensor installed in the square center. The attenuation coefficient α is 1/9 cm-1 and the threshold γ is 0.5.
We suppose the intact probability of a fiber of 1cm length is 0.999. The value of coverage ratio A rk
can not becalculated by analytic method generally, we use Monte-Carlo method to obtain its estimated value. The Monte-Carlo simulation experiment is carried out with 100 sampling points in each small square. In star topology, the star coupler is always located in the center of monitoring region. All these sensors are assumed to be backward-reflected and other factors such as power non-equalization of sensors and network capability limit are not considered in simulations.
Simulation results show that the ring topology has the highest robustness under this circumstance while the star topology has the lowest. This outcome is easily understood because the redundancy of ring topology has improved the reliability of the network. The bus topology has very similar, although slightly lower, robustness compared to the line topology. This is expected because every branch fiber of bus topology is set to be very short (5cm) while the bus fiber has the same length as line topology. However, this is true only if we ignore the possibility of sensor self-fault. Unlike line topology, failure of one sensor does not affect others in bus topology. So bus topology will perform better than line topology in terms of robustness if the possibility of sensor self-fault is taken into account. For each topology, the robustness initially increases with increasing number of sensors but then declines gently. The reason is that cooperative work of sensors has obviously improved the coverage ratio initially but as the scale of the network grows, the monitoring
[image:5.612.45.299.266.598.2]area increases while the probability of Sn in working state is too low due to the increasing total fiber length. The robustness of star topology decreases most rapidly, which illustrates that star topology is not a wise option for large scale strip-shaped area monitoring.
Another simulation is carried out to investigate the performance of the four topologies under a square-region
monitoring situation. The monitoring region is a fixed 100×
100cm2 square area, within which N sensors are randomly
located and connected in four basic topologies. Robustness values are calculated for γ = 0.5 and α = 1/16. The intact probability of fiber of 1cm length is supposed to be 0.999. The star coupler of star topology is located at the center of the square, and the bus fiber of bus topology stretches straight along the midline of the square. We take 2500 Monte-Carlo sampling points in the monitoring area for each N value to obtain the coverage ratio under each network state. The procedure is repeated 100 times and the mean value is adopted to reduce the uncertainty caused by random sensor deployment.
Results are shown as Fig. 6. For each topology, robustness increases quickly with increasing sensor numbers when only a few sensors are installed, because more sensors result in a higher coverage ratio, which contributes to high robustness. As more sensors are included in the network, the robustness reaches a plateau. This is because as sensors get more crowded, the overlapping between one sensor’s effective monitoring region and another’s becomes more serious. Therefore, as the number of sensors increases, additional sensors have decreasing effective contributions to the coverage ratio and network robustness. Among the four topologies, the star topology has the best robustness but with only a slight advantage over bus and ring topology. The robustness of the line topology is significantly lower in contrast with other topologies due to the relatively high impact of a link failure on network. Although the star topology shows the best performance in the simulation, it suffers from limited multiplexing ability of star coupler in practice. Therefore, a comprehensive analysis of the advantages and disadvantages of different network designs should be conducted when
designing a practical network.
B.Impact of γ and α
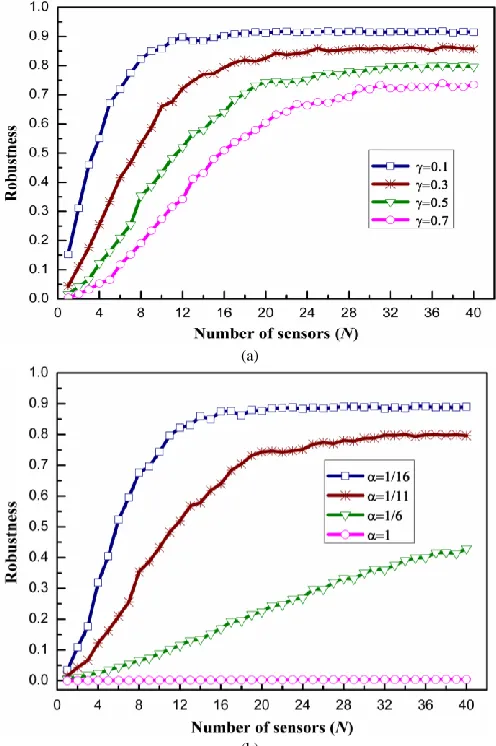
The attenuation coefficient as well as the threshold has an influence on the coverage ratio and thus the robustness. We focus on the ring topology to study the two parameters. The simulation procedure is basically the same as the work on square area monitoring in section 4.1, except that different threshold γ = 0.1, 0.3, 0.5, 0.7, and attenuation coefficient α = 1/16, 1/11, 1/6, 1 cm-1 are used when calculating robustness.
Fig. 7(a) shows the change in network robustness with respect to the number of sensors (N) with different γ values when α = 1/11 cm-1. Fig. 7(b) shows the same relation but with
different α values when γ = 0.5. It can be observed in both figures that each curve has a trend that is similar with those shown in Fig. 6. Moreover, it is obvious that decreasing values of γ and α improve the network robustness. This can be understood because a low γ value means that a wider area is effectively monitored and a low α value refers to an increased monitoring ability at every location and therefore more area is effectively monitored. In both cases, the coverage ratio is increased. From Fig. 7, note that if α is too high, the robustness
(a)
(b)
[image:6.612.316.564.170.543.2]Fig. 7. Robustness vs. number of sensors of ring topology network. (a) α= 1/11 cm-1, γ = 0.1, 0.3, 0.5, 0.7 respectively. (b) γ = 0.5, α = 1/16, 1/11, 1/6, 1 cm-1 respectively
[image:6.612.48.296.300.469.2]remains very low and hardly increases even if the number of sensors becomes very large. This shows that if the monitoring ability of sensors decays too fast with distance, increasing the number of sensors cannot improve the robustness effectively.
V.CONCLUSION
We have built a universal robustness evaluation model for OFSNs, which defines robustness quantitatively as the mathematical expectation of the network coverage ratio under all possible network states. Then we demonstrated the mathematical expressions of robustness of four basic topologies. Although we simulated only two simple but typical monitoring circumstances, this model is applicable to situations with more general environmental settings, larger scale network and more complex topologies. We can use this
model to evaluate robustness of highly-resilient,
multi-parameter and multi-layer OFSNs. Moreover, we expect this evaluation model could effectively assist optimization schemes of OFSNs in various applications.
APPENDIX
REFERENCES
[1] B. Lee, “Review of the present status of optical fiber sensors,” Opt. Fiber Technol., vol. 9, no. 2, pp. 57–59, Apr. 2003.
[2] H. N. Li, D. S. Li, and G. B. Song, “Recent application of fiber optic sensors to health monitoring in civil engineering,” Eng. Struct., vol. 26, no. 11, pp. 1647–1657, Aug. 2004.
[3] P. C. Peng, H. Y. Tseng, and S. Chi, “A novel fiber-laser-based sensor network with self-healing function,” IEEE, Photonic. Tech. L., vol. 15, no. 2, pp. 275–277, Feb. 2003.
[4] P. C. Peng, W. P. Lin, and S. Chi, “A self-healing architecture for fiber Bragg grating sensor network,” IEEE,Sens. J., vol. 1, pp. 60–63, Oct. 2004.
[5] S. T. Kuo, P. C. Peng, J. W. Sun, and M. S. Kao, “A delta-star-based multipoint fiber bragg grating sensor network,” IEEE, Sens. J., vol. 11, no. 4, pp. 875–881, Apr. 2011.
[6] C. Y. Wu, K. M. Feng, P. C. Peng, and C. Y. Lin, “Three-dimensional mesh-based multipoint sensing system with self-healing functionality,”
IEEE, Photonic. Tech. L., vol. 22, no. 8, pp. 565–567, Apr. 2010.
[7] P. Urquhart, H. Palezi, and P. Jardin, “Optical fiber bus protection network to multiplex sensors: Self-diagnostic operation,” J. Lightwave
Technol., vol. 29, no. 10, pp. 1427–1436, May. 2011.
[8] M. Schluter, P. Urquhart, “Optical fiber bus protection network to multiplex sensors: Dedicated line and dedicated path operation,” J.
Lightwave Technol., vol. 29, no. 15, pp. 2204–2215, Aug. 2011.
[9] O. Garcia. Lopez, K. Schires, P. Urquhart, N. Gueyne, and B. Duhamel, “Optical fiber bus protection network to multiplex sensors: Amplification by remotely pumped EDFAs,” IEEE Trans. Instrum.
Meas., vol. 58, no. 9, pp. 2845–2851, Sep. 2009.
[10] M. F. Vallejo, R. A. Perez-Herrera, C. Elosua, S. Diaz, P. Urquhart, C. Bariain, and M. Lopez-Amo, “Resilient amplified double-ring optical networks to multiplex optical fiber sensors,” J. Lightwave Technol., vol. 27, no. 10, pp. 1301–1306, May. 2009.
[11] L. M. Peng, X. W. Li, W. H. Yang, and Y. C. Kim, “Investigation on reliability and scalability of an FBG-based hierarchical AOFSN,” IEEE Sens. J., vol. 10, no. 4, pp. 2901–2918, Mar. 2010.
[12] L. B. Yuan, and J. Yang, “Two-loop-based low-coherence multiplexing fiber-optic sensor network with a Michelson optical path demodulator,”
Opt. Lett., vol. 30, no. 9, pp. 601–603, Mar. 2005.
[13] A. M. Gillooly, L. Zhang, and I. Bennion, “High survivability fiber sensor network for smart structures,” in Proc. of SPIE, vol. 5579, 2004, pp. 99–106.
[14] F. Ye, G. Zhong, S. W. Lu, and L. X. Zhang, “GRAdient broadcast: A robust data delivery protocol for large scale sensor networks,” Wirel.
Netw., vol. 11, no. 3, pp. 285–298, May. 2005.
[15] X. P. Li, and D. F. Yang, “A quantitative survivability evaluation model for wireless sensor networks,” in IEEE Networking, Sensing and Control.
ICNSC, 2006, pp. 727–732.
[16]I. Chatzigiannakis, T. Dimitriou, S. Nikoletseas, and P. Spirakis, “A probabilistic algorithm for efficient and robust data propagation in wireless sensor networks,” Ad Hoc Netw., vol. 4, no. 5, pp. 621–635, Aug. 2005.
[17]Y. Zou, K. Chakrabarty, “Sensor deployment and target localization in distributed sensor networks,” ACM T. Embed. Comput. S., vol. 3, no. 1, pp. 61–69, Feb. 2004.
Hongxia Zhang received her MEng and PHD degrees in Optical engineering from Tianjin University, China, in 2002 and 2005, respectively, where she is currently an associate professor with the college of Precision Instrument and Optoelectronics Engineering, Tianjin University. Her research interests include fiber optic sensing and photoelectric detection. Dr. Zhang has published more than 40 papers in scientific and technology journals and proceeding.
TABLEI
DEFINITIONS OF THE SYMBOLS IN THE TEXT Symbol Definition
f r Detection model of a sensor
Q Any point in monitoring region
r Location of Q
s
r Location of a sensor α Attenuation coefficient in f r
W An OFSN
Si Sensor
k
W Network state
k ID of network state
k
C r Monitoring ability of W
k
H r Threshold function γ Threshold in Hk r
k
A r Coverage ratio
R Monitoring region
kP W Probability of occurrence of Wk
U Robustness
Fj Fiber
Lj Length of Fj
p Broken probability of an unit length of
fiber
pj Intact probability of Fj
m The maximum sensor number of all
working sensors in bus topology