Integration of responses within and across
Arabidopsis
natural accessions uncovers loci controlling root
systems architecture
Ulises Rosasa,1, Angelica Cibrian-Jaramilloa,b,1, Daniela Ristovaa,1, Joshua A. Bantaa,c, Miriam L. Gifforda,d,
Angela Huihui Fana, Royce W. Zhoua, Grace Jaeyoon Kima, Gabriel Krouka,e, Kenneth D. Birnbauma, Michael D. Purugganana, and Gloria M. Coruzzia,2
aCenter for Genomics and Systems Biology, Department of Biology, New York University, New York, NY 10003;bLaboratorio Nacional de Genómica para la
Biodiversidad, Centro de Investigación y de Estudios Avanzados del Instituto Politécnico Nacional, Guanajuato, 36821, México;cDepartment of Biology, The
University of Texas at Tyler, Tyler, TX 75799;dSchool of Life Sciences, Warwick Systems Biology, Warwick University, Wellesbourne, Warwickshire CV35 9EF,
United Kingdom; andeInstitut de Biologie Intégrative des Plantes-Claude Grignon, Unité Mixte de Recherche 5004, Biochimie et Physiologie Moléculaire des
Plantes, Agro-M/Centre National de la Recherche Scientifique/Institut National de la Recherche Agronomique/SupAgro/Université Montpellier 2, 34060 Montpellier, France
Edited by Philip N. Benfey, Duke University, Durham, NC, and approved August 2, 2013 (received for review March 29, 2013)
Phenotypic plasticity is presumed to be involved in adaptive change toward species diversification. We thus examined how candidate genes underlying natural variation across populations might also mediate plasticity within an individual. Our implemen-tation of an integrative“plasticity space”approach revealed that the root plasticity of a singleArabidopsis accession exposed to distinct environments broadly recapitulates the natural variation
“space.”Genome-wide association mapping identified the known genePHOSPHATE 1(PHO1) and other genes such asRoot System Architecture 1(RSA1) associated with differences in root allome-try, a highly plastic trait capturing the distribution of lateral roots along the primary axis. The response of mutants in the Columbia-0 background suggests their involvement in signaling key modu-lators of root development including auxin, abscisic acid, and ni-trate. Moreover, genotype-by-environment interactions for the PHO1andRSA1genes in Columbia-0 phenocopy the root allometry of other natural variants. Thisfinding supports a role for plasticity responses in phenotypic evolution in natural environments.
GWAS
|
morphometrics|
GxE interaction|
QTL|
RootScapeA
long-standing debate in evolutionary biology is the rele-vance of phenotypic plasticity as a mechanism leading to species diversity (1). It has been argued that selection on plas-ticity responses to environment pressures could underlie fixed phenotypic changes between natural variants (2), providing a potentially rapid mechanism of evolutionary change (3). Thus, we tested the hypothesis that genes that enable a functional response to the environment within a population also underlie adaptive changes across natural variants.Arabidopsis thalianaoffers ample opportunity to study genes involved in phenotypic plasticity in response to experimental laboratory perturbations, whereas its natural variants offer the opportunity to study the genetic basis for developmental variation observed in nature. We took a unique approach to integrating results from these two perspectives to uncover the molecular basis underlying individual plasticity and variation among natural variants. We focused on the root architectural system because it shows a high degree of plasticity under diverse environmental conditions (4–9). We used a quantitative phenotyping model to capture and integrate plastic changes in root system architecture in response to a range of experimental treatments within the laboratory reference ac-cession Columbia-0 (Col-0). We next cross-referenced this plas-ticity space derived for an individual accession (Col-0) to the range of phenotypic differences in root architecture observed acrossArabidopsisaccessions that represent the extent of natural variation under one condition. This allowed us to identify can-didate genes underlying root systems architecture using
genome-wide association mapping and to test their role in individual plasticity using mutants.
Results
Integrative Characterization of Phenotypic Plasticity and Natural Variation in Root Architecture.To characterize the root plasticity “space”within an accession, we grew theA. thalianalaboratory strain Col-0 under a set of treatments using nutrients and hor-mones known to mediate different aspects of root development. This uncovered a range of plasticity within a single genotype across multiple treatments: control (KCl), auxin [Indol acetic acid (IAA)], cytokinin (CK), abscisic acid (ABA), nitrate (KNO3), and ammonium chloride (NH4Cl) (10) (Fig. 1A). Next, we char-acterized natural variation of root system architecture in 69 gen-otypedArabidopsisaccessions (12) grown in a single environment (KNO3) under which they exhibit a large breadth of natural phenotypic root variation (Fig. 1B). Root systems architecture was quantified holistically with a method (RootScape) that uses landmark-based morphometrics and has the advantage of being blind to the relevance of conventional morphological characters (11, 13). This method uses a 20-point landmark template that consists of a set of reference pointsfixed to developmental land-marks such as the base of the primary root and to points that capture plasticity to a greater degree, such as the end of the
Significance
Species display a range of plastic phenotypes that presumably have evolved as a result of adaptation to heterogeneous environments. We asked whether the genetic mechanisms that underlie adaptation across populations also determine the re-sponse of an individual plant to environmental cues in Arabi-dopsis. Using an integrative root phenotyping approach, genes that underlie natural variation in root architecture across populations were shown to control plasticity responses within an individual. Together, our results uncover a genetic mecha-nism underlying the phenotypic plasticity of an individual and phenotypic diversity across natural variants.
Author contributions: U.R., A.C.-J., D.R., G.K., K.D.B., M.D.P., and G.M.C. designed re-search; U.R., A.C.-J., D.R., J.A.B., M.L.G., A.H.F., R.W.Z., and G.J.K. performed rere-search; M.D.P. and G.M.C. contributed new reagents/analytic tools; U.R., A.C.-J., D.R., J.A.B., A.H.F., R.W.Z., G.K., and G.M.C. analyzed data; and U.R., A.C.-J., and G.M.C. wrote the paper. The authors declare no conflict of interest.
This article is a PNAS Direct Submission.
Freely available online through the PNAS open access option.
1U.R., A.C.-J., and D.R. contributed equally to this work.
2To whom correspondence should be addressed. E-mail: [email protected].
This article contains supporting information online atwww.pnas.org/lookup/suppl/doi:10.
1073/pnas.1305883110/-/DCSupplemental.
PLANT
BIOLO
primary root, the widest lateral roots, and the end of the lat-eral roots. Intermediate points are added evenly between the
fixed landmarks. In this way the template captures the main features of root architecture as an integrated system (11) (Fig. 1C).
To create a framework to compare natural variation and plas-ticity responses, we used data from the landmark-based morpho-logical root models and ran Principal Component Analyses (PCA). The resulting PCs uncovered the main trends of phenotypic plasticity in roots of the laboratory reference accession Col-0 (PCACOL) and among theA. thaliananatural VARiants (PCAVAR). In both root models (PCCOLand PCVAR), PC1 and PC2 covered more than 75% of the variation in root systems architecture (Fig. 1D). PC1COLcaptures a size effect; PC2COLis an orthogonal axis to PC1COLand therefore captures a type of variation unrelated to size. Thus, PC2COLseems to capture the proportion of the pri-mary root that contains visible lateral roots, in other words, the distribution of lateral roots in the proximal–distal axis regardless or root size (Fig. 1D). Similarly, a PCA of the VAR space across 69 naturalArabidopsisaccessions captures a size-effect trend of the variation (PC1VAR) and the lateral root allometry effect (PC2VAR). Overall, the PC analyses suggest that the variation captured within an individual accession (PCCOL) is similar to the range of variation observed in natural accessions (PCVAR) under our growth conditions (Fig. 1D). This suggests a shared genetic mechanism controlling both phenotypic plasticity and natural variation, which would imply an important role of plasticity in adaptive change.
The similarity of variation in root systems architecture ob-served between the plasticity space of Col-0 and across the natural accessions—(PC1COL ∼ PC1VAR) and (PC2COL ∼ PC2VAR)— allowed us to use these PC axes as phenotypic metrics to perform quantitative comparisons. We projected the PC values for both datasets COL and VAR into the PC1COLand PC2COLaxes (erence plasticity space) (Fig. 2). Surprisingly, the laboratory ref-erence accession Col-0 (Fig. 2AandB, blue bar), which has been historically selected for other purposes, localized roughly to the middle of the phenotypic axes of both PCs, corresponding in root phenotype to a“mean accession”relative to the other natural
variants (Fig. 2AandB, gray and blue bars). However, the treat-ments (Fig. 2AandB, red bars) expanded the phenotypic breadth of Col-0, pushing its plasticity mainly toward the higher ends of the PCCOLaxes, relative to the mean. This distribution suggests underlying developmental constraints for the plasticity to explore the lower end of the PCCOLspace. We tested this using other
Arabidopsisaccessions and found that their plasticity is mostly directed toward the higher end of the PC axis (i.e., PC2COL) (Fig. S1). PC2COLcaptures the distribution of the lateral roots on the primary roots. The lower end shows a narrower distribution on a range of accessions (i.e., Tamm-27) and Col-0 plasticity phe-notypes (i.e., CK). The absence of phephe-notypes with lower PC2COL might reflect a bias of our selected treatments.
The projection onto the PC1COL and PC2COL phenotypic spaces (Fig. 2 A and B) also allowed us to establish that the distribution of Col-0 phenotypes resulting from experimental treatments (Fig. 2Aand B, red bars) covers ∼50% of the dis-tribution of phenotypes exhibited by the natural accessions along PC1COLand∼65% of the distribution in PC2COL(Fig. 2AandB, gray and blue bars). We performed the reciprocal analysis and projected the same datasets into the PC1VARand PC2VARaxes (“natural variation space”) obtaining similar results (Fig. S2). A pair-wise comparison of the phenotype projections showed that PC1COL and PC2COL are highly correlated to PC1VAR and PC2VAR, respectively (Fig. 1D). Thus, the plasticity space of in-dividualArabidopsisaccessions recapitulates natural variation in root architecture when exposed to distinct laboratory-induced physiological environments.
[image:2.585.41.366.50.328.2]Identification of Candidate Genes Underlying Natural Variation in Root Architecture. The projections of the PC values from the natural variants into the PC1COLand PC2COLphenotypic space were next used to map genes underlying both natural variation and phenotypic plasticity. To do this, we looked for associations between the PC1COL or PC2COL phenotypes exhibited in the natural accessions and the 214,000 SNP dataset of poly-morphisms in Arabidopsis (14). No significant genome-wide association study (GWAS) associations were identified for the PC1COL trait (overall root size), suggesting that size might be Fig. 1. Root architecture plasticity within an ac-cession (Col-0) broadly recapitulates natural varia-tion quantified across 69 accessions. (A) Root phenotypes of Col-0 plants were grown underfive conditions: IAA, CK, ABA, KNO3, and NH4Cl plus
a control (KCl); roots of three treatment conditions are shown. (B) Root variation between 69 accessions grown under one condition (KNO3). (C) Landmark
template to capture the root system architecture (11). Primary landmarks (black circles) are defined according to corresponding features in all roots; secondary landmarks (white circles) are evenly spaced between primary landmarks (11). (D) Two PCs capture more than 75% of the variation both within Col-0 (PCCOL) and between accessions (PCVAR).
PC1COLand PC2COLhave high correlation to PC1VAR
and PC2VAR, respectively. PC1COLis mainly a size
ef-fect, whereas PC2COLcaptures mainly root allometry,
controlled by many loci of small effect. However, the PC2COL trait (allometry of lateral roots) revealed 12 significant GWAS associations at the false-discovery rate (FDR) level ofq<0.05 or 19 associations atq< 0.1. Most of these SNPs mapped to two genomic regions in chromosomes III and IV (Fig. 2C), partially overlapping regions with previously identified root morphology quantitative trait loci (QTL) (4–6, 15–18). We assumed a 5-kb window before the first and after the last significant SNPs, given that linkage disequilibrium decays more than 50% in
Arabidopsisin that range (19). Thus, the region in chromosome (Chr) III hadfive SNP associations in a 212-kb interval (Chr III:
8181817–8393525 bp) containing 49 genes (Table S1, Chromo-some III region). The region in chromoChromo-some IV had 18 significant SNPs in a 112-kb interval (Chr IV: 13988547–14100946 bp) con-taining 39 genes (Table S1, Chromosome IV region). We focused on a subset of 11 genes that each contain highly significant SNP associations (FDR:q<0.05) (Table S2). Among these candidate genes isPHOSPHATE 1orPHO1(At3g23430) shown previously to play a role in inorganic phosphate loading into the xylem and aspects of root development (20, 21). Several other uncharac-terized genes were also identified.
To test whether the corresponding mutant alleles show phe-notypic effects for PC2COL, we characterized the root pheno-types in mutants of six candidate genes in the chromosome III and IV regions (Fig. 3A). pho1-2 (22) showed a significantly lower PC2COLphenotype than wild-type Col-0 (Fig. 3A), sup-porting the hypothesis thatPHO1is one of the underlying QTL in chromosome III. A second gene that showed a significant phenotype in PC2COLis At4g28410 orRoot System Architecture 1
(RSA1).RSA1, a gene identified in this screen, encodes a protein that belongs to the tyrosine transaminase family, with similarity toSUPERROOT 1(SUR1; At2g20610) (23), a gene involved in glucosinolate biosynthesis from tryptophan derivatives (24).
Among other defects, the sur1 mutant overproduces auxin because the conversion to glucosinolates is blocked, which canalizes tryptophan derivates toward auxin production, thus exhibiting extensive proliferation of lateral roots (25). We thus postulate that the SUR1-like gene, RSA1, has a redundant function to SUR1, and loss-of-function mutations (rsa1-2 =
At4g28410-KO) are unlikely to show strong phenotypic effects; however, overexpression alleles (rsa1-1=Atg428410-OX) would be expected to have an auxin deficiency-like phenotype, consistent with the phenotype of thersa1-1gain-of-function mutant (Fig. 3
AandB).rsa1-1is a tDNA insertion mutant mapping to the 5′
UTR of A4g28410, whereasrsa1-2is a tDNA insertion map-ping to 969 bp from the start codon, producing a predicted truncated protein of 327 amino acids (full length is 447 amino acids). To test the possible role ofRSA1in auxin homeostasis, we obtained the genome-wide expression profile of thersa1-1
overexpression mutant. We found that 104 (P<0.001) genes or 492 (P < 0.01) genes are more than 1.5-fold differentially expressed compared with the sibling wild type (Table S3). We compared the list of misregulated genes in thersa1-1mutant to a list of 3,186 genes regulated by the synthetic auxin naphtha-lene-1-acetic acid in the root (26). We found significant over-representations of the intersections of auxin-regulated genes with genes misregulated in the rsa1-1 mutant for both of our datasets (P<0.001), compared with random generated gene lists of the same size (27, 28), further suggesting arsa1-1role in auxin homeostasis. To further test whether expression ofRSA1mRNA is causative to changes in root allometry, we tested whether natural variation in RSA1activity is correlated with changes in PC2COL. To do this, we obtained normalizedRSA1expression in 10Arabidopsisaccessions (Fig. S3) and compared them to their respective PC2COLphenotypes. Consistent with the result on the
rsa1-1overexpression allele, we found a negative correlation be-tweenRSA1mRNA levels and the PC2COLphenotype (Pearson correlation:−0.55). This correlation of gene activity and pheno-typic changes in PC2COLin thersa1-1mutant, and the correlation betweenRSA1expression and PC2COLphenotypes in the natural accessions also supports the notion thatRSA1(At4g28410) under-lies the QTL for PC2COLthat maps to chromosome IV.
Using theArabidopsis1,001 Genomes browser (1001genomes. org), we identified SNP positions in the RSA1and PHO1loci. ForRSA1, the SNP at position 14051900 in chromosome IV is 348 bp upstream of the 5′UTR. This opens the possibility that
[image:3.585.52.271.51.512.2]cis-regulatory variation atRSA1 is driving variation in root al-lometry that is supported by our studies ofRSA1expression in thersa1-1mutant (Fig. 3AandB) and in natural variants (Fig. S3). For PHO1, we found that the SNP at position 8388425 in chromosome III (TAIR 8 annotation) is within an exon of the coding region. Furthermore, the SNP is nonsynonymous; a cytosine Fig. 2. Root plasticity variation within an accession (Col-0) spans a range of
plasticity exhibited byArabidopsisnatural variants and maps to regions in chromosome III and IV. (AandB) Bars indicate SE. Red bars, Col-0 in thefive treatments IAA, CK, ABA, KNO3, and NH4Cl and a KCl control (n=20); gray
bars, phenotypes of 69Arabidopsisaccessions grown under a single (KNO3)
condition (n= 3–4); blue bars, reference Col-0 accession. Morphometrics modeled root systems architecture phenotypes; those corresponding to ex-treme root PC1COLand PC2COLphenotypes are shown. (C) Manhattan plot
illustrating the GWAS mapping of the PC2COLphenotype.
PLANT
BIOLO
at that position codes for histidine, whereas a thymine at that position codes for tyrosine. Histidine is a basic amino acid and tyrosine is an aromatic amino acid, however, the physiological ramifications of this nonsynonymous change are not clear.
Two Candidate Genes Underlying Natural Variation in Root Architecture Have Phenotypic Plasticity Responses.Genes involved in phenotypic plasticity exert environmental control over other genes that affect the phenotypic response (29). Thus, impaired activities of these genes are predicted to exhibit atypical phenotypic responses to their respective environment. To test our initial hypothesis that genes underlying natural variation can also be responsible for phenotypic plasticity, we investigated the root phenotypic response ofrsa1andpho1mutant alleles to stimuli affecting the plant physi-ological“environment.”Genotype-by-Environment interactions (G×E) in thersa1andpho1mutants would suggest a role of
RSA1/At4g28410 andPHO1in plasticity responses, as well as its associated role in natural variation. To test this, we exposed thersa1
mutants and the pho1-2 mutant allele to the five experimental treatments (IAA, CK, ABA, KNO3, and NH4Cl) and the control (KCl) and evaluated the resulting phenotypes along the PC2COL phenotypic axis. A two-way analysis of variance (ANOVA) for PC2COLgave a significant G×E interaction term (P<0.0001) for the several treatments. ForRSA1, significant G×E interaction effects were determined for KNO3(P=0.0031, standardized-β= −0.203) (Fig. 3C) and IAA (P=0.0093, standardized-β=−0.177) (Fig. 3E) in thersa1-1overexpression mutant. ABA gave significant interactions in thersa1-2(P<0.0001, standardized-β=−0.310) (Fig. 3D). This is illustrated by the reaction norms where rsa1-1has a lower PC2COLphenotype, compared with Col-0, and the KNO3 treatment increases the difference in the PC2COLphenotype of Col-0 vs.rsa1-1, relative to controls (e.g., KCl; Fig. 3D). The
rsa1-2 mutant had a lower PC2COL phenotype in the ABA condition compared with Col-0 (Fig. 3D). Thersa1-2mutant was not as responsive to the IAA treatment as Col-0 (Fig. 3E), consistent with its predictedSUR1-like function.
The pho1-2 mutant showed a significant interaction in the ABA treatment (P=0.0228, standardized-β=0.144) (Fig. 3D), illustrated by the higher PC2COLphenotype of thepho1-2mutant compared with Col-0, specifically in our control environment (e.g., KCl). Thepho1-2phenotype was enhanced in the presence of ABA, supporting the activity dependency betweenPHO1and ABA recently shown in stomatal responses (30). To further study the interaction of ABA and phosphate availability in thepho1-2
mutant, we performed a combinatorial experiment in the pres-ence or abspres-ence of ABA and phosphate. However, no significant interactions or additional phenotypes were revealed under the conditions that we tested (Fig. S4). Together, these results sug-gest that the role ofRSA1andPHO1in mediating lateral root plasticity acts through its interplay with KNO3, ABA, and IAA signaling. Moreover, these results show that RSA1 andPHO1,
candidate genes identified to be associated with natural variation in root architecture, also play roles in mediating plasticity responses within an accessionArabidopsis.
Finally, we tested the possibility thatRSA1andPHO1natural alleles might be associated with changes in the environment using a“Landscape Genetics”approach (31), described in more detail inMethodsandTable S4. Using environmental variables that are related to temperature and humidity (32–34), we found that none of the evaluated environmental factors (Table S4) were significantly associated with the SNP near RSA1 in the tested accessions (Table S5). ForPHO1, we discovered that “wet day frequency” was significantly associated with the SNP inPHO1
(P= 0.0027). Specifically, the SNP allele inPHO1 marked by a cytosine was predicted to be much less frequent in environ-ments with fewer than 10 wet days per month compared with environments with higher wet day frequencies, whereas the SNP allele marked by a thymine was predicted to be the most frequent in environments with fewer than 10 wet days per month com-pared with environments with higher wet day frequencies (Fig. S5). Thefindings associating specific SNPs withinPHO1with response to the environment in thefield suggest future experiments to better understand this phenomenon.
Discussion
In this paper, we provide a comprehensive framework to dissect how the extent of the phenotypic response of an individual Ara-bidopsislaboratory accession relates to phenotypic plasticity in-trinsic to its natural variants. Our results show that a phenotypic plasticity trait quantified in the laboratory strain Col-0 (PC2COL) broadly recapitulates that found in natural acces-sions and can be used to quantify and map variation in natural
Arabidopsisaccessions (Fig. 4A). This intersection of individual plasticity and natural variation spaces enabled us to identify can-didate genes (i.e.,RSA1andPHO1) controlling variation of root allometry. Previous genome-wide studies have identified QTL for root architecture (4, 6, 15–18), some of them overlapping with our identified regions in chromosomes III and IV; but only one locus on chromosome I, BREVIS RADIX, has been characterized as controlling natural variation (5, 7). We now provide evidence of two more candidate genes controlling natural variation in root system architecture inArabidopsis(RSA1andPHO1) and provide evidence suggesting that the environment (wet day frequency) has driven allelic variation inPHO1(Fig. S5).
In addition, we found that the phenotypic effects ofRSA1and
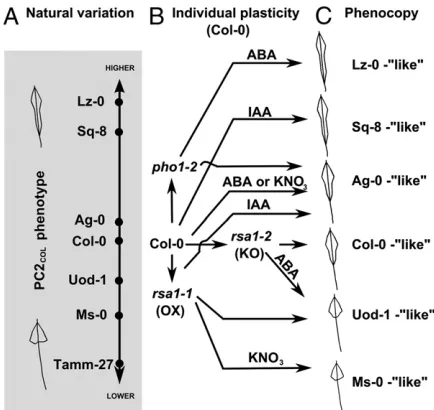
[image:4.585.43.367.52.221.2]PHO1 activities on root allometry as captured by PC2COLare conditional to specific environments, e.g., KNO3, ABA, or IAA (Fig. 4B). Thus, a genotype-by-environment interaction medi-ated through theRSA1andPHO1genes determines whether the root response to ABA, IAA, and KNO3increases, reduces, or maintains the distribution of lateral root allometry. Moreover, these genetic and environmentally induced changes in root Fig. 3. Candidate genes have PC2COLmutant
pheno-types;PHO1/At3g23430 andRSA1/At4g28410 show G×E interaction for KNO3, ABA, and IAA conditions.
(A) PC2COLvalues of mutant alleles for six candidate
genes (n=22–31) grown in KNO3media plates,
com-pared with wild-type Col-0 (n=36). (B) Quantitative PCR on thersa1-1gain-of-function mutant allele (n=3). (C–E) Reaction norms testing G×E inter-actions for IAA, ABA, CK, KNO3, and NH4Cl inpho1-2,
rsa1-1gain-, andrsa1-2loss- of function mutants, re-spectively (n ≥ 11). Only significant interactions (KNO3, ABA, and IAA) are shown: *P<0.05, **P<
allometry in the Col-0 accession in turn phenocopies the root allometry trait of a range of natural accessions (Fig. 4C). This suggests that the mechanisms controlling phenotypic plasticity of root allometry Col-0 are similar to the ones controlling natural variation inArabidopsisaccessions. Moreover, the accessibility of the phenotypic plasticity space of an individual accession depends on the activity of genes controlling natural variation, as repre-sented byRSA1 and PHO1. These findings reopen the discus-sion of the relevance of phenotypic plasticity genes in natural variation and adaptive evolution (1–3, 29).
Our study also highlights a strategy for intersecting experi-mentally perturbed phenotypes within a laboratory strain with those observed across a panel of natural variants to uncover genetic mechanisms underlying plasticity and natural variation for any evolved trait of interest. Contextualizing root plasticity within laboratory variants and natural variation in accessions under laboratory conditions is a powerful strategy to dissect the influence of factors on plasticity typically composed of complex multigene traits, such as the impact of hormones on root system architecture. In developing a method to cross-reference the genes involved in phenotypic plasticity and natural variation, we open a window to understanding the possible mechanisms that characterize adaptive change inArabidopsis.
Methods
Growth Conditions and Phenotyping.Seeds were disinfected with a solution of
ethanol, bleach, and water 4:1:3 and three rinses of sterilized water. Seeds were sown on square plates of custom-made MS media (−sucrose/−nitrogen) supplemented with sucrose 0.1%, nitrogen (as indicated below), MES so-dium salts 0.05% (Gibco BRL), and agar 1% (Bacto Agar BD). Plates were kept at 4 °C for 4 d in the dark and then placed vertically in a growth chamber under 22 °C, long-day 16h/8h condition at 125μmol·m−2s−1light
intensity (Percival Scientific). For the phenotypic characterization of acces-sions and mutants, the custom MS media was supplemented with 5 mM of KNO3and 1% of sucrose as carbon source, grown at 50 mol·m−2s−1light
intensity; roots were imaged 16 d after sowing. For the IAA, CK, ABA, KNO3,
NH4Cl, and control (KCl) treatments in Col-0 and mutants, the seeds were
sown on media containing 1 mM of KCl, and seedlings were transferred to the fresh plates containing 500 nM of IAA, 500 nM of kinetin (CK), 1μM of ABA, 1 mM of KNO3, 1 mM of NH4Cl, or 1 mM KCl (control), and roots were
imaged 14 d after germination (4 d after transfer to treatment plates).
Plate images were obtained at 300-dpi resolution using a scanner. Landmark data and morphometric analysis were obtained using the software “Shape Model Toolbox”(12) in Matlab as described (13). Before analyzing the root variation, procrustes for translation and rotation were applied to the datasets (11, 13). This was done by aligning the datasets according to their centroid and then rotating them about the centroid to minimize the distance between corresponding landmarks; no scaling was applied. PCA was carried out on the covariance matrix to obtain the main trends of the variation (PCs), which were used as traits. Projections of other datasets were used to quantify phenotypes according to the corresponding PCCOL. For
details on the PCA methods and projections, see refs. 13 and 35. Landmark datasets to generate the models are provided inDataset S1.
Sampling and Statistical Tests. The phenotypic plasticity space PCCOL was
created by growing Col-0 in the treatments described above with 20 plants per treatment. The accession data were obtained by growing three to four plants of each of the 96 Nordborg lines. Only 69 were phenotyped with the RootScapemethod (11), as the rest did not outgrow visible lateral roots under our conditions. To characterize the mutant phenotypes of candidate genes, homozygote tDNA insertion mutants and wild-type siblings were identified using primers obtained using default settings on the iSect tool (http://signal.salk.edu/tdnaprimers.2.html). Plates were sown side by side with the mutant and wild-type siblings to account for background and plate effects. The dataset consisted ofn=239 plants of Col-0; 36 ofpho1-2; 23 of GABI_297C02; 25 of GABI_764B10; 24 of SAIL_47_B10; 27 of SALK_094117; 22 of GABI_288A12; 31 of WiscDsLoxHs186_11; 22 of SALK_011695C; and 22 of SALK_094441C. The projected PC2COLdata were analyzed according to
the following REML mixed model: PC2COL=βgenotype+βplate+e(Fig. 3A). To
characterize the plasticity response of theRSA1/At4g28410 mutants, a min-imum of 11 plants per treatment per genotype were analyzed, for a total of 291 plants. This dataset was analyzed together with the data to generate the PCCOLspace (above). G×E interactions were tested according to the
following two-way ANOVA model: PC2COL = βgenotype + βtreatment +
βgenotype*treatment+e(Fig. 3C–E). To further testpho1-2plasticity in a
phos-phate-depleted environment, we custom-made MS media following the manufacturer’s recipe, but also substituted the moles of–PO4in KH2PO4for
KOH and imaged the roots 4 d after transfer to phosphate-depleted media.
Genome-Wide Association Study.After standardizing each PCCOLroot trait to
a mean of zero and a SD of 1, we performed genome-wide association mapping using the SNP database from Atwell et al. (14), which documents over 214,000 SNPs (an average of 1 SNP/500 bp) in 69 different inbred lines from the wild. Wefiltered the database to include only SNPs with a minor allele frequency greater than 0.10, which left 177,623 SNPs for mapping.
To account for genome-wide patterns of relatedness that can confound the results of GWAS studies (36), we used all 214,000 SNPs to construct a similarity matrix representing the proportion of loci that is identical in state between any pair of lines (K; 36). For each trait, we then separatelyfit the modely=Xα+Zu+e, whereyis a vector of phenotypes,Xis a matrix of single-locus genotypes,αis a vector of allele effects to be estimated,Zis an identity matrix,uis a matrix of random deviates due to genome-wide re-latedness (as inferred from K), andeis a vector of residual errors. The analysis was conducted using the EMMA approach (37) in R version 3.0.1 (R Development Core Team 2013). To account for multiple simultaneous tests (becauseαis modeled separately for each SNP), we calculatedPvalues that were adjusted for the genome-wide FDR (q-values) using theq-value pack-age (38) in R (R Core Team 2013) (39).
Gene Expression Analysis.For expression analysis using quantitative PCR, the
RNA extraction were carried out on roots collected from arsa1-2mutant and sibling wild type at day 12, grown side by side on vertical agar plates, 5 mM of KNO3, and 1% of sucrose at 50 mol·m−2s−1light intensity. For each of the
three replicates, we pooled tissue from three roots. For assays in accessions, plants were grown in liquid media in phytatrays, and total RNA was extracted using RNeasy minikit (Qiagen). Double-stranded cDNA was syn-thesized by the SuperScript RT-PCR system (Invitrogen). PCR were performed using the LightCyclerFastStart DNA masterPLUS SYBR Green I (Roche) in
a LightCycler 480 (Roche). Expression level of At4g28410 was quantified using the oligos 5′-GTGGTGATAATGAATCCTCACAAC-3′and 5′ -CCATCGGG-ACAAATTTATTCTCT-3′. Five standard reference genes were used to quantify relative expression:Clathrin/At4g24550 (5′-AGCATACACTGCGTGCAAAG-3′
[image:5.585.52.269.51.256.2]and 5′-TCGCCTGTGTCACATATCTC-3′),ACT2,8/At3g18780,At1g49240 (5′ -GGTA-ACATTGTGCTCAGRGGTGG-3′and 5′-AACGACCTTAATCTTCATGCTGC-3′),SIP1A/ At3g04090 (5′-TCCTTGTCATTGTTTAGATCCACAC-3′ and 5′ -TAAATGTTTCTAA-ACCGGAAGAGAGTC-3′),ATJ3/A3g44110 (5′-TCCAACCAATTTGTCTCTTGCT-3′
Fig. 4. ThePHO1-RSA1-dependent G× E interaction expands the root plasticity space of Col-0 to phenocopy a range of natural accessions. (A) Axis representing natural variation on PC2COLphenotype with examples of
acces-sion’s positions and root allometry phenotypes. (B) Treatments with KNO3ABA,
or IAA inrsa1-1gain-of-function (OX) andrsa1-2loss-of-function (KO) mutants have contrasting effects to Col-0. (C) Col-0 andrsa1mutant alleles treated with
KNO3, ABA, or IAA phenocopy the root architecture of natural variants. PLANT
BIOLO
and 5′-AACAAGTTTCGATGTTCCACC-3′), andUBI10/At4g0532 (5′ -GGCCTTG-TATAATCCCTGATGAATAAG-3′and 5′ -AAAGAGATAACAGGAACGGAAACA-TAGT-3′). All PCRs were performed with annealing of 60 °C. PCR efficiency of At4g28410 was tested with a standard curve in each plate, using four serial dilutions of a wild-type sample: 1/1, 1/10, 1/100, and 1/1000. For genome-wide expression in thersa1-1mutant allele (n=3) and the sibling wild type (n=3), we used standard protocols from Affymetrics to amplify, label, and hybridize RNA samples to the ATH1 Affymetrics chip. Raw data were pro-cessed in MASv5.0 and two-tailedttest was performed in R (R Core Team 2013) (40).
Landscape Genetic Analysis.We took the significant SNP inPHO1(At3g23430)
and the significant SNP nearRSA1(At4g28410) and examined how they were structured on the landscape as a function of several environmental factors. We used a list of accessions and geographic coordinates of their origins (41). We intersected this list with lists of genes for which SNP ge-notype information is available at the two SNP loci of interest (14). We limited this list to accessions falling within the native range ofA. thalianain Europe and Asia (−11° to 86° E and 35° to 71° N), as estimated based on ref. 42. We thenfiltered this list by the“red list”and the“yellow list”of pu-tative misidentified accessions previously flagged (41). A total of 726 accessions remained after intersecting andfiltering (Fig. S5AandTable S5). Separately for each SNP, we examined how the SNP was structured on the landscape as a function of temperature and humidity variables used in previous studies (Table S4). All environmental factors were at a 10 arc-minute (∼13 km) scale worldwide. We extracted the values of the environ-mental factors at the locations origin of the accessions using ArcMap version
9.3 (Esri Inc.). We then thinned the list of environmental factors to those with correlation coefficients less thanj0.6jamong the locations of the accessions (Table S4).
The logistic regression model was based on the logistic functiony=1/(1+e−z), whereyis a binary dependent variable (one SNP allele or the other); andz=β0+ β1S1+. . .+βxSx+βx+1E1+. . .+βx+yEz+e, whereβ0is the intercept,S1−Sxare the covariates to account for spatial autocorrelation (Table S4),E1−Ezare the environmental variables,eis the residual error, and theβterms are the corre-sponding regression coefficients. The analysis was performed using the lrm function of the rms package (39) in R (R Development Core Team 2013) (40).
ACKNOWLEDGMENTS. Thepho1-2 was line was kindly provided by Ives Poirier (Faculté de Biologie et de Médicine, Université de Lausanne). Rongchen Wang (Division of Biological Sciences, University of California San Diego) provided mutant lines for candidate genes. We thank Tara Moran and Nancy Francoeur for their help on Affy chips ofrsa1-1. We thank Joan Doidy for his advice on custom media preparation. We acknowledge the feedback of Dennis Shasha and Daniel Tranchina on statistical analysis. This work was sup-ported by National Science Foundation (NSF) Grant MCB-0929338 (to G.M.C. and K.D.B.); NSF Grant DEB-0917489 (to M.D.P.); National Institutes of Health (NIH) Grant R01 GM032877 (to G.M.C.); NIH Grant R01 GM078279 (to K.D.B.); a Human Frontier Postdoctoral Fellowship (to U.R.); a Fulbright Science and Technology award (to D.R.); a Marie Curie postdoctoral fellowship, Agence Nationale de Recherches (ANR) (NitroNet: ANR 11 PDOC 020 01); Centre National de la Recherche Scientifique (Projets Exploratoires Pluridisciplinaires Bio math Info 2012–2013: SuperRegNet) grants (to G.K.); European Molecular Biology Organi-zation postdoctoral“A Long Term Fellowship”107-2005; and Biotechnology and Biological Sciences Research Council Grant BB/H109502/1 (to M.L.G.).
1. Pigliucci M, Murren CJ, Schlichting CD (2006) Phenotypic plasticity and evolution by genetic assimilation.J Exp Biol209(Pt 12):2362–2367.
2. Waddington CH (1953) Genetic assimilation for an acquired character.Evolution7(2): 118–126.
3. Pigliucci M, Murren CJ (2003) Perspective: Genetic assimilation and a possible evolu-tionary paradox: Can macroevolution sometimes be so fast as to pass us by?Evolution
57(7):1455–1464.
4. Rauh L, Basten CB, Buckler S IV (2002) Quantitative trait loci analysis of growth re-sponse to varying nitrogen sources inArabidopsisthaliana.Theor Appl Genet104(5): 743–750.
5. Mouchel CF, Briggs GC, Hardtke CS (2004) Natural genetic variation inArabidopsis
identifies BREVIS RADIX, a novel regulator of cell proliferation and elongation in the root.Genes Dev18(6):700–714.
6. Reymond M, Svistoonoff S, Loudet O, Nussaume L, Desnos T (2006) Identification of QTL controlling root growth response to phosphate starvation inArabidopsis thali-ana.Plant Cell Environ29(1):115–125.
7. Beuchat J, et al. (2010) A hyperactive quantitative trait locus allele ofArabidopsisBRX contributes to natural variation in root growth vigor.Proc Natl Acad Sci USA107(18): 8475–8480.
8. Ikram S, Bedu M, Daniel-Vedele F, Chaillou S, Chardon F (2012) Natural variation of
Arabidopsisresponse to nitrogen availability.J Exp Bot63(1):91–105.
9. Gruber BD, Giehl RFH, Friedel S, von Wirén N (2013) Plasticity of the Arabidopsis root system under nutrient deficiencies.Plant Physiol, 10.1104/pp.113.218453. 10. Krouk G, et al. (2011) A framework integrating plant growth with hormones and
nutrients.Trends Plant Sci16(4):178–182.
11. Ristova D, et al. (2013) RootScape: A landmark-based system for high-throughput screening of root architecture inArabidopsisthaliana.Plant Physiol161(3):1086–1096. 12. Nordborg M, et al. (2005) The pattern of polymorphism inArabidopsisthaliana.PLoS
Biol3(7):e196.
13. Langlade NB, et al. (2005) Evolution through genetically controlled allometry space.
Proc Natl Acad Sci USA102(29):10221–10226.
14. Atwell S, et al. (2010) Genome-wide association study of 107 phenotypes in Arabi-dopsisthaliana inbred lines.Nature465(7298):627–631.
15. Kobayashi Y, Koyama H (2002) QTL analysis of Al tolerance in recombinant inbred lines ofArabidopsisthaliana.Plant Cell Physiol43(12):1526–1533.
16. Loudet O, Gaudon V, Trubuil A, Daniel-Vedele F (2005) Quantitative trait loci con-trolling root growth and architecture in Arabidopsis thaliana confirmed by hetero-geneous inbred family.Theor Appl Genet110(4):742–753.
17. Fitz Gerald JN, et al. (2006) Identification of quantitative trait loci that regulate
Arabidopsisroot system size and plasticity.Genetics172(1):485–498.
18. El-Lithy ME, Reymond M, Stich B, Koornneef M, Vreugdenhil D (2010) Relation among plant growth, carbohydrates andflowering time in the Arabidopsis Landsberg erecta×
Kondara recombinant inbred line population.Plant Cell Environ33(8):1369–1382. 19. Kim S, et al. (2007) Recombination and linkage disequilibrium inArabidopsisthaliana.
Nat Genet39(9):1151–1155.
20. Poirier Y, Thoma S, Somerville C, Schiefelbein J (1991) Mutant ofArabidopsisdeficient in xylem loading of phosphate.Plant Physiol97(3):1087–1093.
21. Hamburger D, Rezzonico E, MacDonald-Comber Petétot J, Somerville C, Poirier Y (2002) Identification and characterization of the Arabidopsis PHO1 gene involved in phosphate loading to the xylem.Plant Cell14(4):889–902.
22. Delhaize E, Randall PJ (1995) Characterization of a phosphate accumulator mutant of
Arabidopsisthaliana.Plant Physiol107(1):207–213.
23. Boerjan W, et al. (1995) Superroot, a recessive mutation in Arabidopsis, confers auxin overproduction.Plant Cell7(9):1405–1419.
24. Mikkelsen MD, Naur P, Halkier BA (2004) Arabidopsis mutants in the C-S lyase of glucosinolate biosynthesis establish a critical role for indole-3-acetaldoxime in auxin homeostasis.Plant J37(5):770–777.
25. Seo M, et al. (1998) Higher activity of an aldehyde oxidase in the auxin-overproducing superroot1 mutant ofArabidopsisthaliana.Plant Physiol116(2):687–693. 26. Vanneste S, et al. (2005) Cell cycle progression in the pericycle is not sufficient for
SOLITARY ROOT/IAA14-mediated lateral root initiation inArabidopsisthaliana.Plant Cell17(11):3035–3050.
27. Katari MS, et al. (2010) VirtualPlant: A software platform to support systems biology research.Plant Physiol152(2):500–515.
28. Krouk G, Mirowski P, LeCun Y, Shasha DE, Coruzzi GM (2010) Predictive network modeling of the high-resolution dynamic plant transcriptome in response to nitrate.
Genome Biol11(12):R123.
29. Schlichting CD, Pigliucci M (1993) Control of phenotypic plasticity via regulatory genes.Am Nat142(2):366–370.
30. Zimmerli C, et al. (2012)PHO1expression in guard cells mediates the stomatal re-sponse to abscisic acid inArabidopsis.Plant J72(2):199–211.
31. Banta JA, et al. (2012) Climate envelope modelling reveals intraspecific relationships amongflowering phenology, niche breadth and potential range size inArabidopsis
thaliana.Ecol Lett15(8):769–777.
32. New M, Lister D, Hulme M, Makin I (2002) A high-resolution data set of surface cli-mate over global land areas.Clim Res21:1–25.
33. Hijmans RJ, Cameron SE, Parra JL, Jones PG, Jarvis A (2005) Very high resolution in-terpolated climate surfaces for global land areas.Int J Climatol25(15):1965–1978. 34. Fournier-Level A, et al. (2011) A map of local adaptation inArabidopsisthaliana.
Science334(6052):86–89.
35. Bensmihen S, et al. (2008) Mutational spaces for leaf shape and size.HFSP J2(2): 110–120.
36. Yu J, et al. (2006) A unified mixed-model method for association mapping that ac-counts for multiple levels of relatedness.Nat Genet38(2):203–208.
37. Kang HM, et al. (2008) Efficient control of population structure in model organism association mapping.Genetics178(3):1709–1723.
38. Dabney A, Storey JD (2010)qvalue: Q-Value Estimation for False Discovery Rate Control. (Princeton University, Princeton), R package version 1.22.0. Available at www.bioconductor.org/packages/release/bioc/html/qvalue.html. Accessed August 16, 2013.
39. Harrell FE, Jr. (2013) rms: Regression Modelling Strategies. (Vanderbilt University, Nashville), R package version 3.6-3. Available at http://CRAN.R-project.org/package=rms. Accessed August 15, 2013..
40. Team RC (2013)R: A Language and Environment for Statistical Computing(R Foun-dation, Vienna).
41. Anastasio AE, et al. (2011) Source verification of mis-identifiedArabidopsisthaliana accessions.Plant J67(3):554–566.