warwick.ac.uk/lib-publications
Original citation:Reddy, G. N. Manjunatha, Malon, Michal, Marsh, Andrew, Nishiyama, Yusuke and Brown, Steven P.. (2016) A fast magic-angle spinning three-dimensional NMR experiment for simultaneously probing H-H and N-H proximities in solids. Analytical Chemistry, 88 (23). pp. 11412-11419.
Permanent WRAP URL:
http://wrap.warwick.ac.uk/83305
Copyright and reuse:
The Warwick Research Archive Portal (WRAP) makes this work of researchers of the University of Warwick available open access under the following conditions. Copyright © and all moral rights to the version of the paper presented here belong to the individual author(s) and/or other copyright owners. To the extent reasonable and practicable the material made available in WRAP has been checked for eligibility before being made available.
Copies of full items can be used for personal research or study, educational, or not-for-profit purposes without prior permission or charge. Provided that the authors, title and full bibliographic details are credited, a hyperlink and/or URL is given for the original metadata page and the content is not changed in any way.
Publisher’s statement:
ACS AuthorChoice - This is an open access article published under an ACS AuthorChoice
License, which permits copying and redistribution of the article or any adaptations for non-commercial purposes.
The version presented here may differ from the published version or, version of record, if you wish to cite this item you are advised to consult the publisher’s version. Please see the ‘permanent WRAP URL’ above for details on accessing the published version and note that access may require a subscription.
Fast Magic-Angle Spinning Three-Dimensional NMR Experiment for
Simultaneously Probing H
H and N
H Proximities in Solids
G. N. Manjunatha Reddy,
†Michal Malon,
‡,§Andrew Marsh,
∥Yusuke Nishiyama,
‡,§and Steven P. Brown
*
,††Department of Physics and ∥Department of Chemistry, University of Warwick, Coventry, CV4 7AL, United Kingdom
‡JEOL RESONANCE Inc., Musashino, Akishima, Tokyo 196-8558, Japan
§RIKEN CLST-JEOL Collaboration Centre, Yokohama, Kanagawa 230-0045, Japan
*
S Supporting InformationABSTRACT: A fast magic-angle spinning (MAS, 70 kHz) solid-state NMR experiment is presented that combines 1H Double-Quantum (DQ) and 14N1H HMQC
(Heteronu-clear Multiple-Quantum Coherence) pulse-sequence elements, so as to simultaneously probe HH and NH proximities in molecular solids. The proposed experiment can be employed in both two-dimensional (2D) and three-dimensional (3D) versions: first, a 2D 14N HMQC-filtered 1H-DQ experiment provides specific DQ-SQ correlation peaks for proton pairs
that are in close proximities to the nitrogen sites, thereby achieving spectral filtration. Second, a proton-detected three-dimensional (3D)1H(DQ)-14N(SQ)-1H(SQ) experiment correlates1H(DQ)-1H(SQ) chemical shifts with14N shifts such that
longer range N···HH correlations are observed between protons and nitrogen atoms with internuclear NH distances exceeding 3 Å. Both 2D and 3D versions of the proposed experiment are demonstrated for an amino acid hydrochloride salt,L-histidine·
HCl·H2O, and a DNA nucleoside, guanosine·2H2O. In the latter case, the achieved spectralfiltration ensures that DQ cross peaks
are only observed for guanine NH and CH81H resonances and not ribose and water1H resonances, thus providing insight into
the changes in the solid-state structure of this hydrate that occur over time; significant changes are observed in the NH and NH2 1H chemical shifts as compared to the freshly recrystallized sample previously studied by Reddy et al.,Cryst. Growth Des.2015, 15, 5945.
■
INTRODUCTIONWithin the context of small and moderately sized organic molecules,1H solid-state NMR isfinding increasing application for the solid-state characterization of a range of samples including pharmaceuticals, supramolecular assemblies and polymers,1 primarily benefiting from its inherently high sensitivity even at submilligram quantities, for example, using fast magic-angle spinning (MAS) approaches.2,3 Notably, the
1H chemical shift is sensitive to intermolecular interactions such
as hydrogen bonding and aromatic π−π interactions, which govern molecular packing in the solid-state.4−12Moreover,1H
detection is becoming increasingly important in biological solid-state NMR.13−17
Solid-state1H MAS NMR spectra of organic molecules often exhibit markedly overlapped resonances; nevertheless, 2D homonuclear 1H Double-Quantum18
(for example recorded using BaBa19−21 recoupling), NOESY-like spin diffusion,22,23 and heteronuclear 1H13C and 15N/14N1H correlation
experiments significantly aid spectral interpretation. Specifically, NH proximities can be probed using a 14N1H HMQC
experiment3,24−27 (14N spin 1, 99.6% natural isotopic
abundance) capitalizing onJcouplings, dipolar couplings, and also recently on overtone 14N transitions.28−30
The 14N1H
HMQC experiment has been employed to characterize intermolecular NH···N, NH···O and OH···N hydrogen bonding interactions in pharmaceutical cocrystals31,32 and in the self-assembled structures adopted by modified DNA/RNA nucleosides.33−36
Here, a three-dimensional1H(DQ)-14N(SQ)-1H(SQ)
corre-lation experiment (Figure 1) is presented whereby, under fast MAS (70 kHz), 1H DQ-SQ and 1H14N HMQC pulse sequence elements are concatenated. This experiment sequen-tially utilizes both HH and NH dipolar interactions for probing N···HH proximities, and has the following advantages: first, incorporation of a 14N-HMQC filter in the 1H DQ experiment achieves spectralfiltration by retaining only
specific DQ correlation peaks for protons which are in a close proximity to nitrogen sites. This can be achieved simply by recording a 2D version of the experiment. It is to be noted that a similar approach has been proposed by Spiess and co-workers for achieving spectral simplification via15N-edited1H-DQ MAS NMR spectroscopy in keto and enol tautomers of15N-labeled
Received: May 13, 2016
Accepted: October 31, 2016
Published: October 31, 2016
Article
pubs.acs.org/ac License, which permits unrestricted use, distribution and reproduction in any medium,
N-butylaminocarbonyl-6-tridecyl isocytosine.37 Second, in a three-dimensional1H(DQ)-14N(SQ)-1H(SQ) experiment, pro-ton pairs that are remotely dipolar coupled with14N sites (in
which the interatomic distance between14N-sites and one of the protons in the HH pair exceeds 3 Å) are observed. Both 2D and 3D versions of the 1H(DQ)-14N(SQ)-1H(SQ) correlation experiment are demonstrated here for probing HH and NH proximities in an amino acid hydrochloride salt, L-histidine·HCl·H2O and a dihydrate of the nucleoside
guanosine, G·2H2O. Our aim here is, thus, to show the
applicability of the MAS NMR experiments to such small and moderately sized organic molecules.
■
EXPERIMENTAL AND COMPUTATIONAL DETAILSL-histidine·HCl·H2O and G·2H2O were purchased from
Sigma-Aldrich, Gillingham, U.K. Guanosine was recrystallized from water according to the procedure described in ref35and stored under standard laboratory conditions.
Powder X-ray Diffraction (PXRD).Data were collected at room temperature on a Bruker D8 Advance (Kα1λ= 1.5406 Å)
equipped with monochromatic Cu Kα1 radiation and a Ni-filtered VÅNTEC1 detector (L-Histidine·HCl·H2O), and
PANalytical X′Pert Pro MPD (Kα1 λ= 1.5406 Å) equipped
with monochromatic Cu Kα1 radiation and a PIXcel detector
(G·2H2O). It was verified that the samples corresponded to the
HISTCM0138 and GUANSH1039 crystal structuressee Figures S3 and S4in theSupporting Information(SI).
Thermogravimetric Analysis (TGA). TGA analysis was
performed using a TA Q5000 instrument. Approximately 6 mg of sample was placed in an aluminum sample holder and heated over the temperature range 25−200 °C at a constant heating rate of 10°C per minute. Helium gas was employed as a purge gas at aflow rate of 50 mL per minute.
Solid-State MAS NMR. All 1H solid-state NMR
experi-ments were performed on either a JEOL ECA700II (for L
-histidine.HCl.H2O) or a JEOL ECZ600R (for G·2H2O)
solid-state NMR spectrometer, equipped with a 1.0 mm double-resonance ultrafast MAS probe head (JEOL RESONANCE Inc., Tokyo, Japan). ∼0.8 mg of L-histidine·HCl·H2O and G·
2H2O were packed individually into JEOL 1 mm rotors. The 1H and 14N pulse lengths were experimentally optimized using
a one-dimensional version of the pulse sequence shown in Figure 1. The1Hπ/2 pulse duration was 0.92μs in the HMQC pulse sequence element, while a 1H (nominal) π/2 pulse duration of 0.5μs (with the same rf nutation frequency) was used in the BaBa-xy16 block. The14N pulse duration was 10μs.
1
H One-Pulse. Sixteen transients were coadded using a
recycle delay of 6 s (L-histidine·HCl·H2O) or 3 s (G·2H2O).
13C CPMAS. 1D13C CPMAS experiments were performed
on a Bruker Avance III 500 MHz (13C, 125 MHz) spectrometer equipped with a 4.0 mm triple resonance MAS probe (operating in double resonance mode). For the sample stored 1 year after recrystallization, 42 mg of G.2H2O was packed into
a 4 mm (outer diameter) rotor.1H and13Cπ/2 pulse lengths
were 2.5 and 3.5μs, respectively. The cross-polarization contact time was 1.5 ms. Heteronuclear decoupling using SPINAL6440 with a1H pulse duration of 5μs was applied for an acquisition time of 30 ms. 2048 transients were coadded using a relaxation delay of 3 s for a total experimental time of 2 h.
1H Double-Quantum (DQ) Spectroscopy.
Eight rotor periods (corresponding to 114 μs) of BaBa-xy16 recoupling was used for the excitation and reconversion of DQ coherencesthe BaBa-xy16 sequence consists of a train of 32
π/2 pulses synchronized to eight rotor periods.21 A 16-step phase cycle was used in order to select a change in coherence orderΔp=±2 on the DQ excitation pulses (4 steps) andΔp= −1 (4 steps) on thez-filter 90°pulse, wherepis the coherence order. For bothL-histidine·HCl·H2O and G·2H2O, 32t1FIDs,
each with 16 coadded transients, were acquired using the States-TPPI method to achieve sign discrimination in the F1
dimension with a rotor-synchronized t1increment of 14.3 μs.
The total experimental times was 1.7 h using a 6 s recycle delay for L-histidine·HCl·H2O and 45 min for G.2H2O using a 3 s
relaxation delay.
14
N(SQ)-1H(SQ) HMQC. SR4 recoupling41 was used to
reintroduce the heteronuclear 14N−1H dipolar couplings. On the first 1H π/2 pulse, a 4-step nested phase cycle [2(0),
2(180), 2(90), 2(270)] was applied to selectΔp= +1, while a 2-step [0, 180] phase cycle was applied on the last14N pulse in
order to selectΔp=±1, with the receiver phase [0, 2(180), 0, 270, 2(90), 270]. For each of 16t1FIDs (using the States-TPPI
method to achieve sign discrimination in F1 with a rotor synchronized increment of 14.3μs), forL-histidine·HCl·H2O, 4
transients were coadded with a recycle delay of 6 s corresponding to a total experimental time of 12 min, while for G·2H2O, 48 transients were coadded with a recycle delay of
3 s corresponding to a total experimental time of 2 h 35 min.
1H(DQ)-14N(SQ) HMQC-1H(SQ).
A BaBa-xy16 sequence21 is used for the excitation of DQ coherence and reconversion of DQ into SQ coherence, with the resulting DQ-filtered SQ coherence being the starting point for a subsequent 14N1H
HMQC pulse sequence element. The BaBa-xy16 part is phase cycled to observe DQ coherences and the HMQC part is phase cycled to select the SQ coherence pathways. In the HMQC part, the SR4 pulse sequence was applied during the excitation and reconversion periods to decouple the 1H homonuclear
[image:3.625.67.295.65.209.2]dipolar interactions and recouple the 1H14N heteronuclear dipolar interactions.41For the pulse sequence shown inFigure 1, the phase cycling is given as follows: (a) [2(0), 2(90), 2(180), 2(270)]; (b) [8(0), 8(90), 8(180), 8(270)]; (c) [0]; (d) [(0, 180), (0, 180)]; (e) [32(0), 32(120), 32(240)]; (f) [0] and (rec) [2(0, 180, 180, 0), 2(180, 0, 0, 180), 2(0, 180, 180, 0), 2(180, 0, 0, 180), 2(240, 60, 60, 240), 2(60, 240, 240, 60), 2(240, 60, 60, 240), 2(60, 240, 240, 60), 2(120, 300, 300, 120),
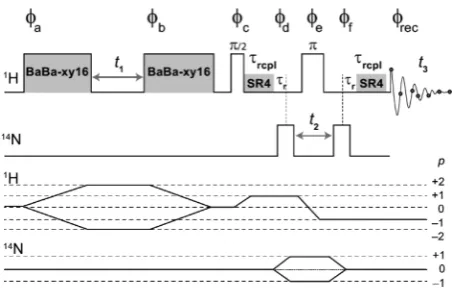
Figure 1. Pulse sequence for a three-dimensional 1H(DQ)-14
N-(SQ)-1H(SQ) correlation experiment that combines 1H(DQ) spec-troscopy using BaBa-xy16 recoupling and14N1H HMQC spectros-copy using SR4 recoupling pulse sequence elements. Both the1H-DQ evolution duringt1and the14N evolution period duringt2are rotor-synchronized with respect to the sample spinning. In the case of a 2D 1H14N HMQC-filtered1H DQ-SQ correlation experiment, only the
t1period is incremented andt2is set equal to one rotor period.
Analytical Chemistry Article
DOI:10.1021/acs.analchem.6b01869
Anal. Chem.2016, 88, 11412−11419
2(300, 120, 120, 300), 2(120, 300, 300, 120), and 2(300, 120, 120, 300)]. Both thet1duration for1H DQ evolution and thet2
duration for 14N evolution are rotor synchronized with the
sample spinning, i.e.,t1=mτrandt2=nτr, wheremandnare
integers.
In the case of the 2D version of the1H(DQ)-14N(SQ)-1 H-(SQ) experiment, only thet1period was incremented. A total of 24 t1 FIDs were acquired using the States-TPPI method to
achieve sign discrimination in F1 with a rotor synchronized increment of 14.3 μs. For L-histidine·HCl·H2O, 96 transients
were coadded with a recycle delay of 6 s corresponding to a total experimental time of 7.7 h, while for G·2H2O, 32
transients were coadded with a recycle delay of 3 s corresponding to a total experimental time of about 5.5 h.
In the case of 3D experiments, an array of 16t1×16t2FIDs were collected in the1H DQ and14N SQ dimensions using the States-TPPI method. For L-histidine·HCl·H2O, 32 transients
were coadded with a recycle delay of 5 s corresponding to a total experimental time of 45.5 h., while for G·2H2O, 96 transients were coadded with a recycle delay of 3 s corresponding to a total experimental time of 82 h.
All 1H chemical shifts are calibrated with respect to neat TMS using adamantane (1.85 ppm) as an external reference.42
14N chemical shifts were referenced to neat CH
3NO2 using
powdered NH4Cl at−341.2 as an external reference (see Table
2 of ref43). To convert to the chemical shift scale frequency used in protein NMR, where the alternative IUPAC (see Appendix 1 of ref44) reference is liquid NH3at −50°C, it is necessary to add 379.5 ppm to the given values.45
GIPAW DFT Calculations.All calculations were performed
using plane-wave based DFT implemented within the Cam-bridge Serial Total Energy Package (CASTEP) code, U.K. academic release version 8.0.46 Atomic coordinates were obtained from the crystal structure of L-histidine.HCl.H2O, as
previously solved by X-ray diffraction: CSID code HISTCM01,
Z= 4,Z′= 1, space group P21, 100 atoms/unit cell (including 1 HCl and 1 H2O).38In afirst stage, a geometry optimization is
performed: starting with the crystal structure, the positions of all atoms are allowed to move (with the unit cell parameters
fixed, and space group symmetry imposed as determined from the X-ray diffraction structure) until an energy-minimized structure is obtained. The distances stated in this paper correspond to this geometry-optimized crystal structure. NMR shielding calculations were performed using the Gauge-Including Projector-Augmented Wave (GIPAW) approach.47,48 Both geometry optimization and NMR chemical shift calculations used a plane-wave basis set and the PBE exchange correlation functional48,49 at a basis cutoff energy of 600 eV with integrals taken over the Brillouin zone by using a Monkhorst−Pack grid of minimum sample spacing 0.08×2π Å−1. A semiempirical dispersion correction was applied using the TS scheme50 for both geometry optimization and NMR shielding calculations with on-the-fly (OTF) ultrasoft pseudo-potentials.51 Forces, stress on the unit cell, energy and displacements were converged to better than 0.01 eV Å−1, 0.1 G Pa, 0.000 000 4 eV, and 0.001 Å, respectively.
■
RESULTS AND DISCUSSIONL-Histidine·HCl·H2O.A single-pulse1H (700 MHz, 70 kHz
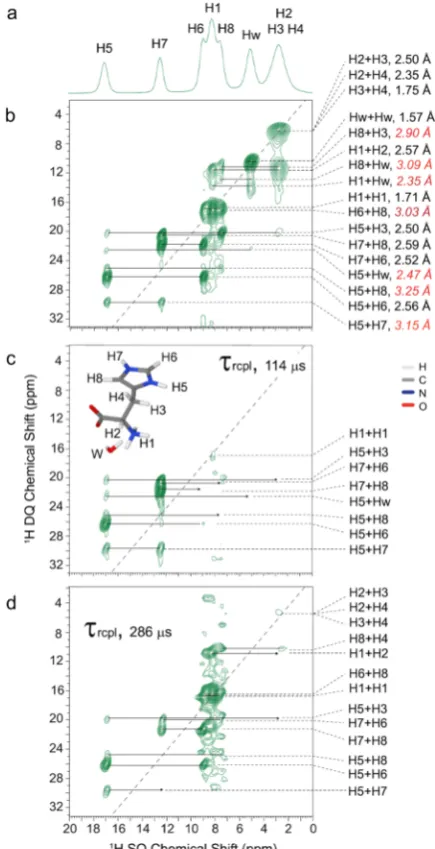
[image:4.625.334.552.68.493.2]MAS) spectrum is presented in Figure 2a: the higher ppm peaks assigned to H5 and H7 correspond to protons exhibiting intermolecular NH···O hydrogen bonding interactions. Figure 2 presents 1H DQ-SQ correlation spectra recorded
without (Figure 2b) and with a 14N-HMQC filter (Figure 2c,d): the DQ peaks in Figure 2b are labeled by the corresponding HH proximities (within 3.3 Å, as obtained from the DFT geometry optimized structure ofL-histidine·HCl·
H2O).1H SQ and DQ chemical shifts together with the HH
proximities are listed in Table S1, while GIPAW DFT calculated1H chemical shielding values are given in Table S2. Rows extracted from the regular 2D 1H DQ and the 14
N-HMQCfiltered1H DQ spectra are presented for the DQ peaks at 5.8, 10.3, 16.0, and 29.4 ppm inFigure S1.
In a 14N-HMQC filtered 1H DQ-SQ spectrum recorded using a short recoupling time (114 μs, Figure 2c), DQ-SQ peaks are only retained for proton pairs where one or both
Figure 2.Experimental1H NMR spectra recorded at 700 MHz using
70 kHz MAS are presented forL-histidine·HCl·H2O: (a) a1H single-pulse spectrum, (b) a 1H DQ-SQ correlation spectrum (recorded using 8τrof BaBa-xy16 recoupling21), (c, d)14N-HMQCfiltered1H DQ-SQ spectra recorded using (c) a short (τrcpl= 114μs) and (d) a long (τrcpl= 286μs) recoupling duration. In (b), interatomic HH distances are presented together with the 1H DQ peak assignments (values in red italics are intermolecular HH proximities). The base contour levels are at (b) 14%, (c) 25%, and (d) 30% of the maximum peak intensity.
protons are directly bonded to a14N site, i.e., for the ring NH
(H5 and H7) and NH3(H1) protons. Note that low intensity
for the NH3(H1) peak is attributed to the rotation of the NH3 protons reducing the magnitude of the 14N1H dipolar coupling by which magnetization transfer is achieved. In the
14N-filtered DQ spectrum recorded by using a longer
recoupling duration (286 μs, Figure 2d), 1H DQ-SQ peaks are recovered for the NH3(H1) peak and the imidazole ring protons (H6 and H8) for which the nearest N···H distances are between 2.15 and 2.17 Å. It is evident fromFigure 2c,d that the spectral complexity in the1H DQ spectra can be readily tuned by varying the recoupling duration, thus aiding spectral interpretation.
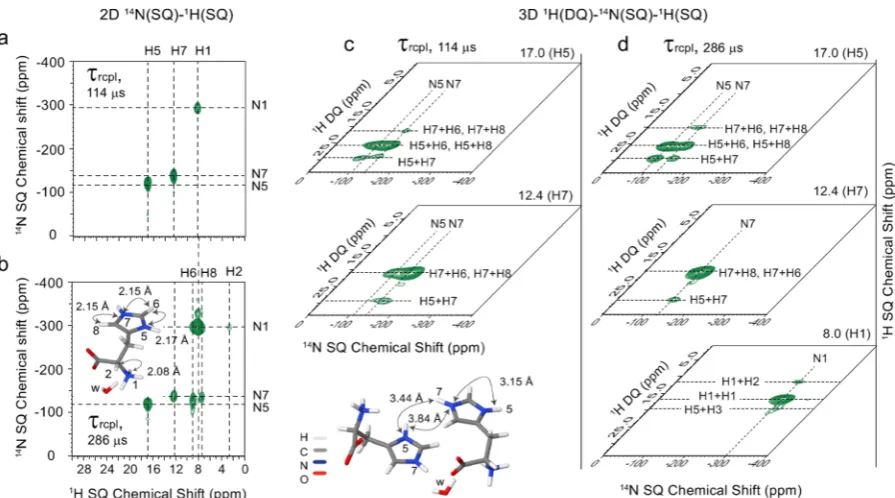
The left-hand side of Figure 3 presents 14N(SQ)-1H(SQ)
spectra recorded with the same recoupling durations as for the
14N-HMQC filtered 1H DQ-SQ spectra presented in Figure
[image:5.625.89.537.65.314.2]2c,d, namely a short 114μs (Figure 3a) and a longer 286μs (Figure 3b) recoupling duration. As was the case for the spectra in Figure 2, by changing the recoupling duration, the spectroscopist can select the number of correlation peaks that
Figure 3.(a, b) 2D14N(SQ)-1H(SQ) spectra and (c, d) 2D14N(SQ)-1H(DQ) planes extracted from 3D1H(DQ)-14N(SQ)-1H(SQ) spectra of
[image:5.625.327.562.373.602.2]L-histidine·HCl·H2O. Data were acquired at a1H Larmor frequency of 700 MHz and an MAS frequency of 70 kHz usingn= 2 rotary resonance recoupling for aτrcplduration of (a and c) 114μs and (b and d) 286μs. The base contour levels are at (a) 25%, (b) 31%, (c) 36%, and (d) 43% of the maximum peak intensity.
Table 1. NH Proximities inL-Histidine·HCl·H2O Corresponding to the NH Correlations Observed in
Figure 3c,d
L-histidine·HCl·H2O
chemical site N···H distance (Å)
N1···H2 2.08
N5···H6 2.17
N5···H7 3.19, 3.44a
N7···H5 3.15, 3.84a
N7···H6 2.15
N7···H8 2.15
aintermolecular H−H proximities.
Figure 4.(a, b) Comparison of 1H one-pulse and two-dimensional
DQ MAS NMR spectra of guanosine samples: (a) recorded directly after recrystallization from water (1H 850 MHz, 75 kHz MAS, DQ MAS spectrum recorded using 1 τr of BaBa recoupling, 13.3 μs, reproduced from Figures 3 and S2 of ref 35) and (b) a DQ MAS spectrum recorded after storage under standard laboratory conditions a year later at 600 MHz using 70 kHz MAS and 8τrof BaBa-xy16 recoupling, 114μs. (c) Thermogravimetric analysis of the guanosine samplenote that a 12.5% weight loss corresponds to a dihydrate form, G·2H2O. Black dashed line and green solid lines correspond to TGA analysis carried out directly after the recrystallization from water (reproduced from Figure 2 of ref35) and after a year being stored under laboratory conditions, respectively.
Analytical Chemistry Article
DOI:10.1021/acs.analchem.6b01869
Anal. Chem.2016, 88, 11412−11419
are observed. Specifically, only one-bond N7H7, N5H5, and N1H1 correlations are observed in Figure 3a, whereas longer range correlations are observed inFigure 3b for N5 H6, N7H6, and N7H8, corresponding to internuclear NH distances of 2.17, 2.15, and 2.15 Å, respectively. Thus, there is an evident analogy to the observation of1H DQ peaks
for the H6 and H8 resonances in Figure 2d (for the longer recoupling duration). Note that Table S3 lists calculated (GIPAW)14N chemical shieldings and quadrupolar parameters for L-histidine·HCl·H2O and compares the calculated and
experimental14N shifts.
Figure 3 also presents spectral planes extracted from two different1H(DQ)-14N(SQ)-1H(SQ) HMQC three-dimensional experimental data sets. Such a 3D experiment (see Figure 1) permits the sampling, in the first and second indirect dimensions (i.e., t1 and t2), of both 1H DQ and 14N(SQ)
coherences, while benefiting from the advantage of 1H detection52−55(i.e., during the acquisition period, t3). From the cuboid resulting from a three-dimensional Fourier trans-formation, it is possible to extract planes corresponding to two of the three spectral dimensions at afixed frequency in the third dimension. As shown inFigure 3c and3d, it is of most interest to consider 14N(SQ)-1H(DQ) planes extracted at the 1H SQ chemical shifts corresponding to the three directly bonded NH moieties for which cross peaks are observed inFigure 3a, i.e., at 17.0 ppm (H1, NH), 12.4 ppm (H7, NH) and 8.0 ppm (H1, NH3). The planes presented inFigure 3c and3d correspond to
two different 3D experiments using the two distinct recoupling times of 114 and 286μs, respectively.
The most intense peaks in the planes shown inFigure 3c,d are at the H5 + H6 1H DQ frequency for the H5 1H SQ
frequency (top); the H7 + H6 and H7 + H81H DQ frequency (H6 and H81H chemical shifts are too close to resolve in this
experiment) for the H71H SQ frequency (middle); and the H1 + H11H DQ frequency for the H11H SQ frequency (bottom).
Thus, these correspond to a correlation between a nitrogen SQ coherence and a DQ coherence involving the directly bonded hydrogen, i.e., (top) N5···H5, (middle) N7···H7 and (bottom) N1···H1, and a nearby second proton, i.e., (top) H5H6 (2.56 Å), (middle) H7H6 (2.52 Å), and H7H8 (2.59 Å) and (bottom) H1H1 (1.71 Å).
It is also important to observe that the 14N(SQ)-1H(DQ)
planes at the H5 (17 ppm) 1H chemical shift display a N5··· H5H7 correlation peak and likewise the 14N(SQ)-1H(DQ) planes at the H7 chemical shift (12.4 ppm) display a N7··· H5H7 correlation peak. Note that the closest HH proximity for this H5H7 DQ coherence is an intermolecular proximity of 3.19 Å, with the intramolecular proximity being 4.12 Å. In such a case, the contribution of multiple different HH distances is reflected in a root-sum squared dipolar coupling, with the intensity of a1H DQ peak depending, to a
first approximation, on the square of this root-sum squared dipolar coupling,56,57 i.e., the contribution of the closer intermolecular proximity compared to the intramolecular proximity to the H5H7 DQ can be estimated as 4.126/ 3.196∼5. As listed inTable 1and illustrated by the inset in the
bottom left ofFigure 3, the corresponding N5···H7 and N7··· H5 distances are 3.44 and 3.84 Å (intermolecular) and 3.19 and 3.15 Å (intramolecular), which is significantly longer than the under 2.2 Å longer-range nitrogen hydrogen distances for the cross peaks observed in the 2D14N(SQ)-1H(SQ) spectrum in
Figure 3b.
Guanosine·2H2O. Supramolecular assemblies generated
from guanosine (G) derivatives have a wide range of applications such as lyotropic mesophases, gelators, thin-films, and synthetic ion channels.58,59The formation of ribbon-like assemblies in the absence of cations, mainly driven by intermolecular NH···N and NH···O hydrogen bonding interactions, is well-known.34,35,39,60,61 A crystal structure of guanosine, G·2H2O, has been solved by X-ray diffraction; there is a ribbon-like assembly whereby two crystallographically independent molecules, namely A and B, self-organize in the form of -A-A-A-A- and -B-B-B-B-.39In this structure, there are two types of water molecules: interlayer water (W1 and W2 interconnect the sugar moieties of adjacent G-ribbons) and intralayer water (W3 and W4 interconnecting the two-dimensional sheets of guanine frames) that reinforce the three-dimensional stacking of ribbons by means of intermo-lecular O−H···O hydrogen bonds (Figure S4).35,39,62,63
Figure 4a reproduces from ref35(Figures 3 and S2) a 1D1H
and 2D 1H DQ-SQ MAS spectrum of G·2H2O as recorded
[image:6.625.73.284.60.372.2]directly after the recrystallization from water. As shown in Figure S4, it was verified by PXRD that this sample corresponds to the published crystal structure, GUANSH10.39 For this recrystallized sample, after storage for a year under laboratory conditions, 1D 1H and 2D 1H DQ-SQ MAS spectra were recorded again as shown in Figure 4b. There is an evident change in the spectra, with this being consistent with the PXRD pattern (see Figure S4) having also changed considerably. Notably, the1H chemical shifts of the NH1 and NH2protons
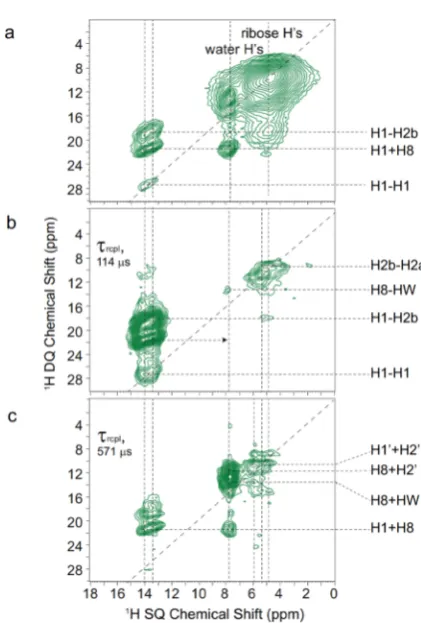
Figure 5.Experimental1H NMR spectra recorded at 600 MHz using
70 kHz MAS are presented for G.2H2O: (a−c)1H DQ-SQ correlation spectra (recorded using 8τrof BaBa-xy16 recoupling), (a) repeated fromFigure 4b, for (b and c) a14N1H HMQCfilter was employed using a (b) short (τrcpl= 114μs = 6τr) and a (c) long (τrcpl= 571μs = 20τr) recoupling time. The base contour levels are at (a) 4%, (b) 13%, and (c) 22% of the maximum peak intensity.
have changed and inFigure 4b, DQ auto peaks are observed for the NH1 protons atδDQ= 13.2 + 13.2 = 26.4 and 13.8 + 13.8 = 27.6 ppm, with no such peaks being observed inFigure 4a.
Sugawara and co-workers have observed changes in PXRD patterns for the solid-state structures of guanosine associated with changing moisture content; using molecular dynamics (MD), they have identified that the intralayer water molecules (W3 and W4) have a relatively weak affinity to the G-ribbons, hence offering an explanation for the humidity-induced changes in solid-state structure.62,63 Figure 4c compares thermogravi-metric analysis (TGA) of G·2H2O, carried out directly after the recrystallization from water (black dashed lines, also presented in Figure 2 of ref 35) and performed a year later after the sample had been stored at laboratory conditions (green solid line). Both samples showed 12.5% weight loss corresponding to the dihydrate form of guanosine, but minor changes are observed in the TGA curves in the temperature range 40°C to 120 °C, suggesting variations in affinity of water molecules within the crystal lattice that are in line with the experimental observations and MD simulations of Sugawara and co-workers.62,63We show here the structural insight that can be gained from the new solid-state NMR experiment described above for the case of this guanosine dihydrate sample (stored under laboratory conditions for a year after recrystallization) for which there is no crystal structure available. In addition, a comparison of13C cross-polarization (CP) MAS spectra of an as-received guanosine sample, the fresh recrystallized sample and the sample in this work is given in Figure S4; the corresponding13C chemical shifts are stated inTable S4, noting
that Sugawara et al. have presented 13C CPMAS spectra
reported in Figure 3 of ref62.
2D 14N-HMQC filtered 1H DQ-SQ correlation spectra
recorded by using a short (114 μs) and a long (571 μs) recoupling time are presented inFigure 5b,c, respectively; for comparison, a standard 1H DQ spectrum presented inFigure
5a is repeated from Figure 4b above. Specific rows extracted from the 2D 14N-HMQC filtered 1H DQ-SQ correlation
spectra are presented in Figure S5. The advantage of the spectralfiltration achieved in this case for the crowded spectral region forδSQ between 3 and 9 ppm is evident. Specific DQ
cross peaks become visible that are otherwise obscured by the broad ribose and water1H SQ resonances.
In order to assign the observed 1H DQ peaks in Figure 5,
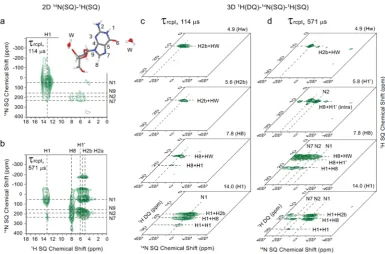
considerfirst the complementary insight that is provided by the two-dimensional 14N1H spectra in Figure 6a,b that were
recorded with the same short (114μs) and a long (571 μs) recoupling time. InFigure 6a, cross peaks corresponding to the one-bond NH connectivities in the NH (NH1) and NH2
(NH2a and NH2b) moieties are observed, while inFigure 6b, cross peaks corresponding to longer range N···H proximities involving the H8 and sugar protons (H1′) and the non-protonated nitrogen resonances (N7, N9) appear. Returning to Figure 5, it can then be identified that inFigure 5b (τrcpl= 114 μs), DQ-SQ peaks are largely only observed for the NH (H1) and NH2(NH2a and NH2b)1H SQ resonances, while for the
spectrum in Figure 5c (τrcpl = 571 μs), DQ peaks are
additionally seen for the CH81H SQ resonance that has a close (<2.2 Å) intramolecular NH proximity. Importantly, this allows the assignment of1H DQ cross peaks at 4.9 + 13.3 = 18.2 ppm between NH (H1) and the NH2b protons inFigure 5b and at 13.3 + 7.8 = 21.1 ppm between NH (H1) and the H8 protons in Figure 5c. As shown for other guanosine derivatives, the changes in SQ and DQ frequencies for such peaks can be structurally informative about different modes of self-assembly.33−35,64
As was the case with L-histidine·HCl·H2O above, further
insight is provided by considering Figure 6c,d which present
1H(DQ)-14N(SQ) planes extracted from 3D 1H(DQ)-14
N-(SQ)-1H(SQ) data sets at1H SQ chemical shifts of 4.9, 5.6, 7.8,
[image:7.625.119.505.65.319.2]and 14.0 ppm corresponding to the water (Hw), NH2b, H8
Figure 6.(a, b) 2D14N(SQ)-1H(SQ) spectra and (c, d) 2D14N(SQ)-1H(DQ) planes extracted from 3D1H(DQ)-14N(SQ)-1H(SQ) spectra are
presented for G·2H2O. Spectra were recorded at a1H Larmor frequency of 600 MHz and an MAS frequency of 70 kHz usingn= 2 rotary resonance recoupling for aτrcplduration of (a and c) 114μs and (b and d) 571μs. The base contour levels are at (a) 29%, (b) 36%, (c) 31%, and (d) 42% of the maximum peak intensity.
Analytical Chemistry Article
DOI:10.1021/acs.analchem.6b01869
Anal. Chem.2016, 88, 11412−11419
and NH (H1) protons, respectively. The planes in Figure 6c correspond to a short (114μs) duration of recoupling of the
14N1H dipolar interaction such that, as inFigure 6a, strongest
intensity is observed at the N114N shift for the plane at the NH
(H1) 1H SQ chemical shift. In this case, intense peaks are observed at the H1 + H8 and H1 + H2b1H DQ chemical shifts
as in Figure 5b, corresponding to N1···H8 and N1···H2b longer-range proximities. For the planes in Figure 6d corresponding to a long (571 μs) recoupling duration, peaks are also observed at the other nitrogen resonances: consider the plane at the H8 1H SQ chemical shift, strong intensity is observed for1H DQ peaks involving the H8 proton and the N7
and also the N1 nitrogen. Such information about specific longer-range nitrogen hydrogen distances could be useful for testing structural models for this guanosine dihydrate structure, e.g., those deriving from a MD simulation such as in ref63.
■
CONCLUSIONSThis study presents 2D and 3D versions of a 1H(DQ)-14 N-(SQ)-1H(SQ) NMR experiment for probing simultaneously
HH proximities and NH proximities under fast MAS conditions. Experimental results are demonstrated for an amino acid salt,L-histidine·HCl·H2O and a DNA base, G·2H2O. 2D 14N-edited 1H DQ-SQ spectra retain specific DQ peaks for
proton-pairs that are dipolar coupled with14N sites. This type
of spectralfiltration led to the observation of specific DQ peaks involving the H8 and NH2 protons in G·2H2O, which are
otherwise lost under DQ peaks due to ribose and water protons in a standard1H DQ-SQ correlation spectrum. Furthermore, a
3D 1H(DQ)-14N(SQ)-1H(SQ) correlation experiment allows the observing of long-range14N1H correlations, as shown for
N···H distances exceeding 3 Å forL-histidine·HCl·H2O.
The 1H(DQ)-14N(SQ)-1H(SQ) experiment is
complemen-tary to previously reported 15N-filtered 1H DQ-SQ37 (15N isotopic labeling was required) experiments as well as 1H
DQ-13C SQ or 14N-filtered 1H13C correlation experiments (larger sample quantities are required).65−67 The proposed experiment is particularly useful for obtaining specific structural information or monitoring temporal changes in the vicinity of NH sites. This approach could be further extended to probe HH proximities in the vicinity of other NMR active quadrupolar nuclei, e.g., chlorine68 which will also benefit from the use of higher magneticfield strength under fast MAS conditions.
■
ASSOCIATED CONTENT*
S Supporting InformationThe Supporting Information is available free of charge on the ACS Publications website at DOI: 10.1021/acs.anal-chem.6b01869.
Table of experimental DQ chemical shifts forL-histidine·
HCl·H2O, table of GIPAW calculated 1H NMR
shieldings and 14N quadrupolar parameters for L
-histidine·HCl·H2O together with comparison to
experi-ment, rows extracted from 2D 1H DQ spectra for L
-histidine·HCl·H2O and G·2H2O, comparison of
exper-imental PXRD patterns with simulated PXRD patterns for L-histidine·HCl·H2O and G·2H2O, 13C CP MAS
spectra of the different G.2H2O samples. The
exper-imental and calculated data for this study are provided as a supporting data set from WRAP, the Warwick Research
Archive Portal at http://wrap.warwick.ac.uk/http:// wrap.warwick.ac.uk/83295(PDF)
■
AUTHOR INFORMATIONCorresponding Author
*E-mail: [email protected].
Notes
The authors declare no competingfinancial interest.
■
ACKNOWLEDGMENTSWe acknowledge funding from EPSRC (EP/K003674/1). We thank Dr. Manoj Pandey for assistance with solid-state NMR experiments. GIPAW DFT calculations were performed on the University of Warwick Centre for Scientific Computing (CSC) cluster. Dr. Ben Douglas, Department of Chemistry is thanked for help with thermogravimetric analysis and Dr. David Walker (University of Warwick) is thanked for PXRD measurements. The PXRD, DSC-TGA and some computing facilities used in this research were obtained through Birmingham Science City: Innovative Uses for Advanced Materials in the Modern World with support from Advantage West Midlands (AWM) and part funded by the European Regional Development Fund (ERDF).
■
REFERENCES(1) Brown, S. P.Solid State Nucl. Magn. Reson.2012,41, 1. (2) Samoson, A.; Tuherm, T.; Gan, Z.Solid State Nucl. Magn. Reson.
2001,20, 130.
(3) Nishiyama, Y.; Endo, Y.; Nemoto, T.; Utsumi, H.; Yamauchi, K.; Hioka, K.; Asakura, T.J. Magn. Reson.2011,208, 44.
(4) Yates, J. R.; Pham, T. N.; Pickard, C. J.; Mauri, F.; Amado, A. M.; Gil, A. M.; Brown, S. P.J. Am. Chem. Soc.2005,127, 10216.
(5) Schmidt, J.; Hoffmann, A.; Spiess, H. W.; Sebastiani, D.J. Phys. Chem. B2006,110, 23204.
(6) Brouwer, D. H.; Alavi, S.; Ripmeester, J. A.Phys. Chem. Chem. Phys.2008,10, 3857.
(7) Gowda, C. M.; Vasconcelos, F.; Schwartz, E.; van Eck, E. R. H.; Marsman, M.; Cornelissen, J.; Rowan, A. E.; de Wijs, G. A.; Kentgens, A. P. M.Phys. Chem. Chem. Phys.2011,13, 13082.
(8) Mafra, L.; Santos, S. M.; Siegel, R.; Alves, I.; Paz, F. A. A.; Dudenko, D.; Spiess, H. W.J. Am. Chem. Soc.2012,134, 71.
(9) Dudenko, D. V.; Williams, P. A.; Hughes, C. E.; Antzutkin, O. N.; Velaga, S. P.; Brown, S. P.; Harris, K. D. M.J. Phys. Chem. C2013,117, 12258.
(10) Xu, J.; Terskikh, V. V.; Chu, Y.; Zheng, A.; Huang, Y.Chem. Mater.2015,27, 3306.
(11) Fernandes, J. A.; Sardo, M.; Mafra, L.; Choquesillo-Lazarte, D.; Masciocchi, N.Cryst. Growth Des.2015,15, 3674.
(12) Baias, M.; Lesage, A.; Aguado, S.; Canivet, J.; Moizan-Basle, V.; Audebrand, N.; Farrusseng, D.; Emsley, L.Angew. Chem., Int. Ed.2015,
54, 5971.
(13) Zhou, D. H.; Shea, J. J.; Nieuwkoop, A. J.; Franks, W. T.; Wylie, B. J.; Mullen, C.; Sandoz, D.; Rienstra, C. M.Angew. Chem., Int. Ed.
2007,46, 8380.
(14) Agarwal, V.; Penzel, S.; Szekely, K.; Cadalbert, R.; Testori, E.; Oss, A.; Past, J.; Samoson, A.; Ernst, M.; Böckmann, A.; Meier, B. H.
Angew. Chem., Int. Ed.2014,53, 12253.
(15) Knight, M. J.; Webber, A. L.; Pell, A. J.; Guerry, P.; Barbet-Massin, E.; Bertini, I.; Felli, I. C.; Gonnelli, L.; Pierattelli, R.; Emsley, L.; Lesage, A.; Herrmann, T.; Pintacuda, G. Angew. Chem., Int. Ed.
2011,50, 11697.
(16) Lamley, J. M.; Iuga, D.; Öster, C.; Sass, H.-J.; Rogowski, M.; Oss, A.; Past, J.; Reinhold, A.; Grzesiek, S.; Samoson, A.; Lewandowski, J. R.J. Am. Chem. Soc.2014,136, 16800.
M.; Terauchi, T.; Kainosho, M.; Ishii, Y.Chem. Commun.2015,51, 15055.
(18) Brown, S. P.Prog. Nucl. Magn. Reson. Spectrosc.2007,50, 199. (19) Sommer, W.; Gottwald, J.; Demco, D. E.; Spiess, H. W.J. Magn. Reson., Ser. A1995,113, 131.
(20) Schnell, I.; Lupulescu, A.; Hafner, S.; Demco, D. E.; Spiess, H. W.J. Magn. Reson.1998,133, 61.
(21) Saalwachter, K.; Lange, F.; Matyjaszewski, K.; Huang, C.-F.;̈ Graf, R.J. Magn. Reson.2011,212, 204.
(22) Elena, B.; Emsley, L.J. Am. Chem. Soc.2005,127, 9140. (23) Elena, B.; Pintacuda, G.; Mifsud, N.; Emsley, L.J. Am. Chem. Soc.2006,128, 9555.
(24) Cavadini, S.; Antonijevic, S.; Lupulescu, A.; Bodenhausen, G.J. Magn. Reson.2006,182, 168.
(25) Gan, Z. H.; Amoureux, J. P.; Trebosc, J.Chem. Phys. Lett.2007,
435, 163.
(26) Siegel, R.; Trebosc, J.; Amoureux, J.-P.; Gan, Z.́ J. Magn. Reson.
2008,193, 321.
(27) Cavadini, S.Prog. Nucl. Magn. Reson. Spectrosc.2010,56, 46. (28) Nishiyama, Y.; Malon, M.; Gan, Z.; Endo, Y.; Nemoto, T.J. Magn. Reson.2013,230, 160.
(29) O’Dell, L. A.; He, R.; Pandohee, J. CrystEngComm 2013,15, 8657.
(30) Haies, I. M.; Jarvis, J. A.; Bentley, H.; Heinmaa, I.; Kuprov, I.; Williamson, P. T. F.; Carravetta, M.Phys. Chem. Chem. Phys.2015,17, 6577.
(31) Tatton, A. S.; Pham, T. N.; Vogt, F. G.; Iuga, D.; Edwards, A. J.; Brown, S. P.CrystEngComm2012,14, 2654.
(32) Maruyoshi, K.; Iuga, D.; Antzutkin, O. N.; Alhalaweh, A.; Velaga, S. P.; Brown, S. P.Chem. Commun.2012,48, 10844.
(33) Webber, A. L.; Masiero, S.; Pieraccini, S.; Burley, J. C.; Tatton, A. S.; Iuga, D.; Pham, T. N.; Spada, G. P.; Brown, S. P.J. Am. Chem. Soc.2011,133, 19777.
(34) Reddy, G. N. M.; Cook, D. S.; Iuga, D.; Walton, R. I.; Marsh, A.; Brown, S. P.Solid State Nucl. Magn. Reson.2015,65, 41.
(35) Reddy, G. N. M.; Marsh, A.; Davis, J. T.; Masiero, S.; Brown, S. P.Cryst. Growth Des.2015,15, 5945.
(36) Robertson, A. J.; Pandey, M. K.; Marsh, A.; Nishiyama, Y.; Brown, S. P.J. Magn. Reson.2015,260, 89.
(37) Schnell, I.; Langer, B.; Söntjens, S. H. M.; van Genderen, M. H. P.; Sijbesma, R. P.; Spiess, H. W.J. Magn. Reson.2001,150, 57.
(38) Oda, K.; Koyama, H.Acta Crystallogr., Sect. B: Struct. Crystallogr. Cryst. Chem.1972,28, 639.
(39) Thewalt, U.; Bugg, C. E.; Marsh, R. E.Acta Crystallogr., Sect. B: Struct. Crystallogr. Cryst. Chem.1970,26, 1089.
(40) Fung, B.; Khitrin, A.; Ermolaev, K.J. Magn. Reson.2000,142, 97. (41) Brinkmann, A.; Kentgens, A. P. M.J. Am. Chem. Soc.2006,128, 14758.
(42) Hayashi, S.; Hayamizu, K.Bull. Chem. Soc. Jpn.1991,64, 685. (43) Hayashi, S.; Hayamizu, K.Bull. Chem. Soc. Jpn.1991,64, 688. (44) Harris, R. K.; Becker, E. D.; Cabral de Menezes, S. M.; Granger, P.; Hoffman, R. E.; Zilm, K. W.Pure Appl. Chem.2008,80, 59.
(45) Martin, G. E.; Hadden, C. E.J. Nat. Prod.2000,63, 543. (46) Clark, S. J.; Segall, M. D.; Pickard, C. J.; Hasnip, P. J.; Probert, M. J.; Refson, K.; Payne, M. C.Z. Kristallogr. - Cryst. Mater.2005,220, 567.
(47) Pickard, C. J.; Mauri, F.Phys. Rev. B: Condens. Matter Mater. Phys.2001,63, 245101.
(48) Yates, J. R.; Pickard, C. J.; Mauri, F. Phys. Rev. B: Condens. Matter Mater. Phys.2007,76, 024401.
(49) Perdew, J. P.; Burke, K.; Ernzerhof, M.Phys. Rev. Lett.1996,77, 3865.
(50) Tkatchenko, A.; Scheffler, M.Phys. Rev. Lett.2009,102, 073005. (51) Vanderbilt, D.Phys. Rev. B: Condens. Matter Mater. Phys.1990,
41, 7892.
(52) Ishii, Y.; Tycko, R.J. Magn. Reson.2000,142, 199.
(53) Paulson, E. K.; Morcombe, C. R.; Gaponenko, V.; Dancheck, B.; Byrd, R. A.; Zilm, K. W.J. Am. Chem. Soc.2003,125, 15831.
(54) Reif, B.; Griffin, R. G.J. Magn. Reson.2003,160, 78.
(55) Nishiyama, Y.Solid State Nucl. Magn. Reson.2016,78, 24. (56) Zorin, V. E.; Brown, S. P.; Hodgkinson, P.Mol. Phys.2006,104, 293.
(57) Bradley, J. P.; Tripon, C.; Filip, C.; Brown, S. P.Phys. Chem. Chem. Phys.2009,11, 6941.
(58) Davis, J. T.Angew. Chem., Int. Ed.2004,43, 668. (59) Davis, J. T.; Spada, G. P.Chem. Soc. Rev.2007,36, 296. (60) Mande, S. S.; Seshadri, T. P.; Viswamitra, M. A.Acta Crystallogr., Sect. C: Cryst. Struct. Commun.1989,45, 92.
(61) Giorgi, T.; Grepioni, F.; Manet, I.; Mariani, P.; Masiero, S.; Mezzina, E.; Pieraccini, S.; Saturni, L.; Spada, G. P.; Gottarelli, G.
Chem. - Eur. J.2002,8, 2143.
(62) Sugawara, Y.; Iimura, Y.; Iwasaki, H.; Urabe, H.; Saito, H.J. Biomol. Struct. Dyn.1994,11, 721.
(63) Yoneda, S.; Sugawara, Y.; Urabe, H.J. Phys. Chem. B2005,109, 1304.
(64) Peters, G. M.; Skala, L. P.; Plank, T. N.; Oh, H.; Manjunatha Reddy, G. N.; Marsh, A.; Brown, S. P.; Raghavan, S. R.; Davis, J. T.J. Am. Chem. Soc.2015,137, 5819.
(65) Bradley, J. P.; Velaga, S. P.; Antzutkin, O. N.; Brown, S. P.Cryst. Growth Des.2011,11, 3463.
(66) Amoureux, J.-P.; Trébosc, J.; Hu, B.; Halpern-Manners, N.; Antonijevic, S.J. Magn. Reson.2008,194, 317.
(67) Webber, A. L.; Elena, B.; Griffin, J. M.; Yates, J. R.; Pham, T. N.; Mauri, F.; Pickard, C. J.; Gil, A. M.; Stein, R.; Lesage, A.; Emsley, L.; Brown, S. P.Phys. Chem. Chem. Phys.2010,12, 6970.
(68) Pandey, M. K.; Kato, H.; Ishii, Y.; Nishiyama, Y.Phys. Chem. Chem. Phys.2016,18, 6209.
Analytical Chemistry Article
DOI:10.1021/acs.analchem.6b01869
Anal. Chem.2016, 88, 11412−11419